© 2015, IRJET ISO 9001:2008 Certified Journal Page 747
Energy Audit and Conservation Tool for Energy Efficiency
Sachin P. Parthe
1, Santosh Kompeli
21
Student (ME), Electrical Engineering Department, MSS’s COE&T Jalna, Maharashtra, India
2Assistant Professor, Electrical Engineering Department, MSS’s COE&T Jalna, Maharashtra, India
---***---Abstract –
Now a day’s India is facing a lack ofElectrical power availability. Out of total commercial energy available in the country, the industrial sector is the sector which is consuming almost 50% of total energy. Obsolete technology is one of the main reason for major energy consumption in India. Demand of electricity is increasing by 6-8% every year, but production of energy is not increasing in the same ratio and so the gap between demand and supply is increasing. To reduce this gap, there are two alternative ways: one is to conserve the electricity and second is to generate more electricity, which requires huge investment. So even a 5% of saving in electricity will prevent the necessity to install power plants in MW. With this concern the government of India has to make mandatory the “Energy Audits” for all Industrial users. Using energy more efficiently and effectively by reducing wastages of energy is the Energy Conservation. For making energy conservation effective, Energy audit is only a basic tool which we have to use in which auditing is the process to identify the wastages of energy without affecting productivity. Through this paper we are trying to shed some new focus on the way of energy generation through energy conservation by means of Energy Audits at all levels, types of customers. It is undeniable that various methodologies are an integral part of power conservation / generation activity and that it plays a crucial role in bridging the gap between power generation & requirement. The results has been evaluated by actual conducting Energy Audit in sample Industry – Kohler Power India, Aurangabad.
Key Words:
Power Scenario of India, Energy Audit,
Energy Conservation.
1. POWER SCENARIO OF INDIA
Since from independence, with the growth of economy, India’s power requirement has grown substantially. Country today faces a peak shortage of power around 11-18% and an energy shortage of about 7-11% [1]. Projected economic growth (@6.4%) of India will necessitate
corresponding growth in power requirement. In India, different sectors electric energy consumption is as follows, 1 Industrial: 26.64%
2 Domestic and commercial: 30.78% 3 Agriculture: 1.66%
4 Transport: 29.35% 5) Others: 11.57%
As of March 2015 the installed capacity of electrical sector in India is around 271.722 GW. In year 2014-15, it was 1010 kwh, the per capita electricity consumption in India with total electricity consumption of 938.823 billion kWh. Among all countries, in 2014-15 the Electric energy consumption in agriculture sector was recorded highest 18.45% in India..
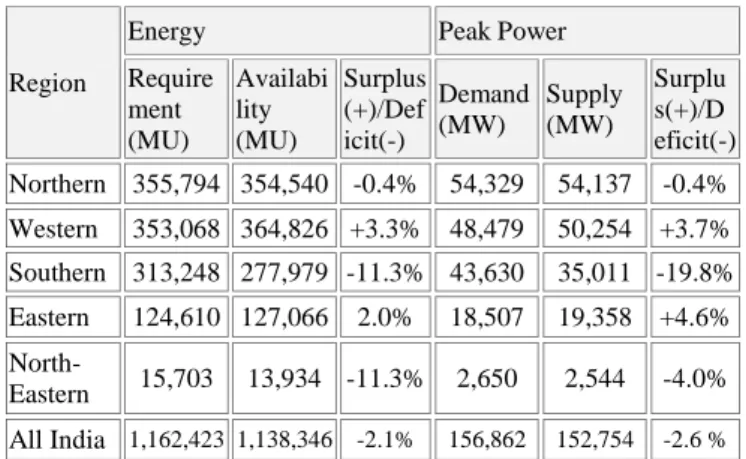
During the fiscal year 2014-15, the electricity generated in utility sector was 1,030.785 billion KWh with a short fall of requirement by 38.138 billion KWh (-3.6%) against the 5.1% deficit anticipated [2]. The peak load met was 141,180 MW with a short fall of requirement by 7,006 MW (-4.7%) against the 2.0% deficit anticipated. A base load energy deficit and peaking shortage to be 2.1% and 2.6% respectively anticipated for the 2015–16 fiscal year in a May 2015 report of India's Central Electricity Authority. Table - 1: Power Supply Position in FY2015-16 all India - (Anticipated)
Region
Energy Peak Power
Require ment (MU) Availabi lity (MU) Surplus (+)/Def icit(-) Demand (MW) Supply (MW) Surplu s(+)/D eficit(-) Northern 355,794 354,540 -0.4% 54,329 54,137 -0.4% Western 353,068 364,826 +3.3% 48,479 50,254 +3.7% Southern 313,248 277,979 -11.3% 43,630 35,011 -19.8% Eastern 124,610 127,066 2.0% 18,507 19,358 +4.6% North-Eastern 15,703 13,934 -11.3% 2,650 2,544 -4.0% All India 1,162,423 1,138,346 -2.1% 156,862 152,754 -2.6 % Even Indian government introduce an ambitious rural electrification program but around 400 million Indians lose electricity access during blackouts. Before 2017, India needs to add 135 GW of power generation capacity, if the current average Transmission and Distribution losses remains as it is at around 32%.
In the next 10 years, India’s power demand is expected to cross 300 GW. To meet this demand India need five to ten times increase in the pace of capacity addition, the profile
© 2015, IRJET ISO 9001:2008 Certified Journal Page 748 of planned capacities will also need to be suitably modified
to fulfil peak demands. A step-up of this magnitude is unlikely to materialize with a traditional approach. A new radically approach of Energy Audit and conservation at all levels of Electrical Energy utilization is required [3]. In the past five years, strategic measures such as the Electricity Act 2003 and the Ultra Mega Power Projects have been introduced, and a number of administrative steps, like tripartite agreements between the central government, central generators and the states and recapitalization of State Electricity Boards have been taken to unleash the potential of the power sector. Though progressive and necessary, these measures have been insufficient.
To fulfil the required power requirement of 315 to 335 GW by 2017, India require a generation capacity of 415 to 440 GW. This implies a tripling of installed capacity from the current level of about 140 GW, which, in turn, translates into an annual addition of 20 to 40 GW. This is fivefold to tenfold the 4 GW per year that was achieved in the last 10 years.
The magnitude of the task at hand will not be enough to achieve this quantum of increase in the pace of capacity addition. To suitably modify the profile of fresh capacities, India needs to adopt new radical approach of Energy Audit and its conservation at all levels of utilization of Electrical Energy.
2. ENERGY AUDIT
An energy audit is defined as a systematic procedure that obtains an adequate knowledge of existing energy consumption profile of the site. It is a process inspection, survey and analysis of energy flows for energy conservation in a building, process or system to reduce the amount of energy input into the system without affecting the output. It helps to identify the factors that have an effect on the energy / power consumption. The performance of an energy audit is the essential step to the energy efficiency improvements. It is a procedure that helps to analyze the use of energy in an industries, enterprise, commercial or building. It serves to identify how a facility of factories uses energy and to identify opportunities of energy conservation. Energy audit can assist in evaluating energy efficiency, identifying energy saving opportunities and establishing a plan to implement energy saving projects. It is a process to collect comprehensive data on energy use. Energy Audit is a process which needs experienced personnel know as Energy Auditor and some auditing equipment’s. Through the energy audit we can assess the energy cost and its effect to the total production cost. Also, we can identify financially and technically viable options for reducing energy usage. It will help us to identify possible ways to improve productivity through interventions in areas not directly linked to energy consumption. There are different types of energy audits, which can include simple or
detailed data analysis & surveys. The time required to conduct any audit depends on the size and type of factory. But priority should be given to the departments or sections of the plant of highest energy / power consumption.
Broadly Energy audit is having two types, one Preliminary Audit & another one is detailed audit. Preliminary Audit is type of energy audit uses existing or easily obtained data for energy audit. The amount of energy consumptions in a facility is obtained by conducting a simple survey. Detailed Audit is done in three phases, preparing for the audit visit, performing the facility survey and implementing the audit recommendations.
Let’s take an example of one medium scale industry to conduct preliminary energy audit & evaluate the possible energy savings which in turn, we can compare with how much we can save the energy if we conduct such audits in each and every industry in India.
3. ENERGY AUDIT OF KOLHER COMPANY
3.1 Introduction about Kohler Company
We have herewith planned to conduct actual Energy Audit of one medium scale Industry “Kohler Power India” Aurangabad.
The Kohler Company, founded in 1873, is a manufacturing company based in Kohler, Wisconsin. Kohler is one of the best known company for its plumbing products, but the company also manufactures engines, generators, furniture, cabinetry and tile. One of entity “Global Power group” manufactures generators ranging in size from 1.5 KVA to 3.3 MVA. We have planned and conducted Preliminary Energy Audit of Kohler plant at Aurangabad in month of Aug 2015 and the energy saving ideas observed in Audit is as below-
3.2 Kohler Company – Details of Electrical Load
Total Connected Load - 1865 KW
Three Phase Load - 762 KW
Single Phase Load - 1102.38 KW
State Electricity Board Sanction Max. Demand - 837 KVA Available Power Source - Transformer 1 500 KVA
Transformer 2 500 KVA Diesel Genset as Standby to MSEB Power DG 1 - 320 KVA Diesel Genset as Standby to MSEB Power DG 2 - 500 KVA Three phase Load 762.65KW
Single Phase Load 1102.38 KW
After converting single Phase to Three Phase - 367.33 KW Total Load in Three Phase - 1130 KW Maximum Demand [(1130 x 65%)/0.8] = 847 KVA
3.3 LED Lights against Conventional Lights
© 2015, IRJET ISO 9001:2008 Certified Journal Page 749 LED (Lighting Emitted Diode) is an alternative to
traditional light sources and considered to be the latest cutting edge lighting technology. Now a days LED has already exceeded the values of halogen and incandescent lamps. [5].
Illustration of possible savings at Kohler Power System – Payback Period For 70W LED Lamp Against 250W Sodium vapor. These lamps were used as flood lights in shop floor in KPS.
We do appreciate that the initial costs are quite high for organization. To see all the benefits, organization will receive from using LED lighting. Everyone is different and need different levels and colors of light.
Table - 2: Illustration of Possible savings at Kohler Power India due to LED Lights.
3.4 Variable Frequency Drive (VFD) for KD15 and
LGA Test cell fresh air blowers
When we are discussing about energy savings we are obviously need to consider VFD’s and when we are discussing about VFD’s then the attention often focuses on a centrifugal fan or pump applications. However, we should not overlook other applications which also have large potential energy savings. Applications involving
regeneration, power factor correction, common bus applications or a combination of the three can also quickly achieve a significant reduction in energy use. [6].
In conclusion, when using an AC drive and motor combination there are many different applications and methods where the energy savings and the energy recovery can be significant. [7].
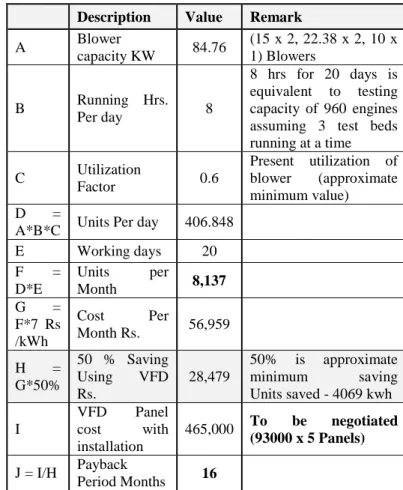
In Kohler Power India, we are proposing for using Variable Frequency Drive for KD15 and LGA Test cell fresh air blowers for reducing electricity power consumption – Table - 3: Proposal of VFD.
Description Value Remark
A Blower capacity KW 84.76 (15 x 2, 22.38 x 2, 10 x 1) Blowers B Running Hrs. Per day 8 8 hrs for 20 days is equivalent to testing capacity of 960 engines assuming 3 test beds running at a time C Utilization Factor 0.6 Present utilization of blower (approximate minimum value) D =
A*B*C Units Per day 406.848
E Working days 20 F = D*E Units per Month 8,137 G = F*7 Rs /kWh Cost Per Month Rs. 56,959 H = G*50% 50 % Saving Using VFD Rs. 28,479 50% is approximate minimum saving Units saved - 4069 kwh I VFD Panel cost with installation 465,000 To be negotiated (93000 x 5 Panels) J = I/H Payback Period Months 16
So, by implementing Variable Frequency Drive (VFD) we can further save 4069 kWh units per month with in only 5 blowers.
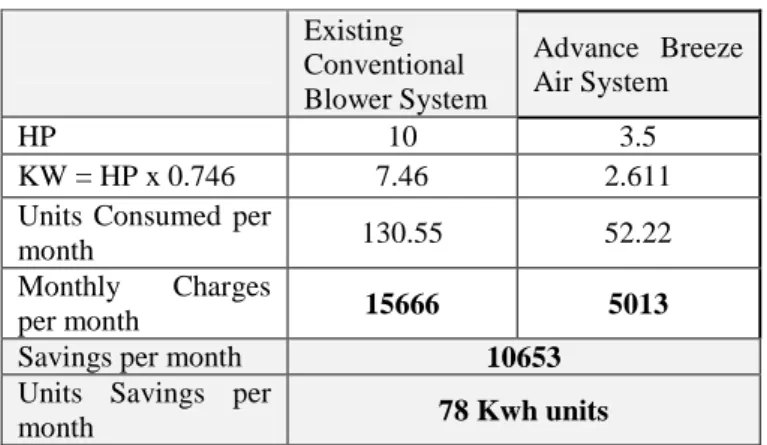
3.5 Breeze air Blowers instead of Conventional
Blowers
We have observed conventional blowers were used for providing cool air in engine assembly section for maintaining dust free environment. These blowers can be convert to advance breeze air blowers which can be most effective way of reduce energy consumption.
Conventional Lamp
250W light Consumption, Considered for
12hrs working (KWH) 30
Daily Electricity charges @ rate of Rs
7.5/KWH 22.5
Monthly Charges (30days) 675
Yearly charges (For 12Months) 8100
LED Lamp
70 W LED lamp Equivalent to 250 W Conventional Lamp, Considered for 12hrs
working (KWH) 0.840
Daily electricity charges @ rate of Rs
7.5/KWH 6.3
Monthly Charges (30days) 189
Yearly charges (For 12Months) 2268
Net Saving per Year per lamp (=8100-2268) 5832
Pay Back Period one lamp in years 1.4
Net Power Saving per Year per lamp (W) 180
Total Power Saving on 240 nos SV Lighting
lamps (KW) 43.2
Total Monthly Units Saving on 240 nos SV Lighting lamps (KWH) considering 12
© 2015, IRJET ISO 9001:2008 Certified Journal Page 750 Table – 4: Proposal of Breeze air Blower
3.6 Controlling Load Factor
Electrical Load factor is a measure of the utilization rate, or efficiency of electrical energy usage. It is the ratio of total energy (KWh) used in the billing period divided by the possible total energy used within the period, if used at the peak demand (KW) during the entire period. Thus, Load Factor = KWh/KW/hours in the period.
But, controlling Load Factor will not give direct energy savings but it will provide reduction in power charges Electricity bills. We can work towards to maintain Load Factor in required limit, it will help us to utilize the incentive schemes of Electricity Boards.
We can refer the incentives declared by Maharashtra State Electricity Distribution Co. Ltd. as below:-
Consumers having load factor over 75% up to 85 % will be entitled to a rebate of 0.75 % on the energy charges for every percentage point increase in load factor from 75% to 85%. Consumers having a load factor over 85 % will be entitled to rebate of 1% on the energy charges for every percentage point increase in load factor from 85 %. The total rebate under this head will be subject to a ceiling of 15% of the energy charges for that consumer. This incentive is limited to HT-I category only. Further, the load factor rebate will be available only if the consumer has no arrears with the MSEDCL, and payment is made within seven days from the date of the bill or within 5 days of the receipt of the bill, whichever is later.
However, the consumer would be subjected to the penal charges for exceeding the contract demand and has to pay.
3.7 Redefining, monitoring and controlling -
Maximum Demand
Maximum demand is the maximum power value, usually the average of 15 minutes, reached during the billing period. Again this is not the option to reduce energy consumption directly but we can work out to reduce Electricity charges. Power charges are depend on the Contract Demand, it’s 50% of Con. Demand and Bill
Demand of that particular month. E.g. if we take an Max demand and bill demand of month April, May 2013 & Aug, Dec 2013 for Kohler company as mentioned in below table – 5.
Min Fixed Maximum Demand charges (Rs. 79610) has charge by electricity board based on Connected demand 418.5 KVA as Contract Demand (KVA) is 837 KVA even though the Actual Demand is less than 418.5 KVA, as per month Aug and Dec 2013.
Table – 5: Maximum Demand Details Month Apr-13 May-13 Aug-13 Dec-13 Connected Demand 418.5 418.5 418.5 418.5
Actual Max Demand 441 452 378 354
Billed Max Demand 441 452 419 419
Rs per Billed MD 190 190 190 190
Fixed MD Charges 83790 85880 79610 79610
If in case, in any month Actual Max Demand crosses the Connected Demand then it will be charged extra as we can find it has been charged in month of April and May 2013. And hence, if we monitor and control the Max Demand and maintain it below the Connected Demand we can save the extra charges to pay.
3.8 Total Suggested Power Saving
Table - 6: Total Power Saving in Kohler Power System Ideas Suggested for Energy
Conservation - Units (kwh) Per Month Rs. Per Month @ 6.33 per Unit Savings from LED Lights against
Conventional Lights – 15552 98,444
Savings from Variable Frequency Drive for KD15 and LGA Test cell fresh air blowers –
4069 25,753
Savings from Breeze air Blowers
instead of Conventional Blowers – 78 494
Savings from Controlling Load
Factor – 0
Savings from Redefining, monitoring
and controlling - Maximum Demand 0
Total Suggested Savings 19699 124691
Average Total Power Consumption
of Plant Per Month – 100690
Average Total Power Consumption
of Plant Per Month (in Percentage) – 20%
Existing Conventional Blower System Advance Breeze Air System HP 10 3.5 KW = HP x 0.746 7.46 2.611
Units Consumed per
month 130.55 52.22
Monthly Charges
per month 15666 5013
Savings per month 10653
Units Savings per
© 2015, IRJET ISO 9001:2008 Certified Journal Page 751
4. CONCLUSIONS
Through this paper, we have tried to shed some light on the way of energy generation through energy conservation by means of Energy Audits at all types of users of Electrical Energy / customers.
It is undeniable that various methodologies are an integral part of power conservation activity and that it plays a crucial role in bridging the gap between power generation & requirement.
We have evaluated results of Energy Audit, by actually obtaining 20% of reduction in Energy consumption in Kohler Company, one medium scale industry. In India, currently registered small / medium industries are around 36368nos [8]. and its average power consumption is around 38.64Gwh [9]. If we conduct such primary Energy Audit in each industry, then we can expect minimum 20% of reduction in Energy Consumption pan India, which will be around 7.728Gwh.
Hence, we are stating as Energy Audit and Conservation is a Tool for Energy Efficiency and Energy Audit can be used as a continuous improvement tool with periodic re-assessments to track and trend of progress and its effectiveness.
ACKNOWLEDGEMENT
With profound feeling of immense gratitude and affection, I would like to thank my guide & Prof. Kompally Santosh, Head Department of Electrical Engineering for his continuous support, motivation, enthusiasm and guidance. His encouragement, supervision with constructive criticism and confidence enabled me to complete this paper.
I also wish to extend thanks to Dr. C.M. Sedani, Principal of Institute for providing necessary facilities to complete this paper.
I express my deep sense of gratitude towards my parents for their sustained cooperation and wishes, which have been a prime source of inspiration to take this paper work to its end without any hurdles.
REFERENCES
[1] P. Garg, Energy Scenario and Vision 2020 in India, Journal of Sustainable Energy and Environment, Feb 2012.
[2] Animesh Pal, Power Sector in India Growth, Policies
and Challenges, International Journal of Emerging Technology and Advanced Engineering, Volume 3, Special Issue 3: ICERTSD 2013, Feb 2013, pages 527-536.
[3] Jian Zhang, Yuchen Zhang, Song Chen, Sizhuo Gong
How to Reduce Energy Consumption by Energy Audits
and Energy Management, The Case of Province Jilin in China, IEEE 2011.
[4] Nilesh R. Kumbhar, Rahul R. Joshi, An Industrial Energy Auditing: Basic Approach, International Journal of Modern Engineering Research, Vol.2, Issue.1, pp-313-315,
[5] Prasad Bhukya, Preliminary Electrical Energy audit analysis of mineral based industry, International Journal of Scientific and Research Publications, Volume 4, Issue 5, May 2014.
[6] Prof. Dr. Eng. lliva K. lliev, Energy Efficiency and Energy Management Handbook, EEFF, May 2011, [7] Karlis Grinbergs, Energy Audit Method for Industrial
Plants, 4th International Conference Civil Engineering’13 Proceedings Part I Industrial Energy Efficiency. [8] http://articles.economictimes.indiatimes.com/2013- 07-16/news/40613264_1_annual-returns-1-5-lakh-registered-companies [9] http://www.indiastat.com/industries/18/industrialg rowth/135/stats.aspx
BIOGRAPHIES
Mr. Sachin Pandurnag Parthe has completed his B.E from Pune University in 2003 and currently pursuing M.E. (Electrical Power System) from MSS’s COE&T, Jalna, Dr. BAMU, Aurangabad. Mr. Santosh Kompeli, (M-Tech in Electrical Power System) Head &
Assistant Professor, Electrical
Engineering Department, MSS’s COE, Jalna, Dr. BAMU, Aurangabad.