Air Force Institute of Technology
AFIT Scholar
Theses and Dissertations Student Graduate Works
6-19-2014
Android Based Behavioral Biometric
Authentication via Multi-Modal Fusion
Anthony J. Grenga
Follow this and additional works at:https://scholar.afit.edu/etd
This Thesis is brought to you for free and open access by the Student Graduate Works at AFIT Scholar. It has been accepted for inclusion in Theses and Dissertations by an authorized administrator of AFIT Scholar. For more information, please [email protected].
Recommended Citation
Grenga, Anthony J., "Android Based Behavioral Biometric Authentication via Multi-Modal Fusion" (2014).Theses and Dissertations. 519.
ANDROID BASED BEHAVIORAL BIOMETRIC AUTHENTICATION VIA MULTI-MODAL FUSION
THESIS
Anthony J. Grenga, Civilian AFIT-ENG-T-14-J-5
DEPARTMENT OF THE AIR FORCE AIR UNIVERSITY
AIR FORCE INSTITUTE OF TECHNOLOGY
Wright-Patterson Air Force Base, OhioDISTRIBUTION STATEMENT A:
The views expressed in this thesis are those of the author and do not reflect the official policy or position of the United States Air Force, the Department of Defense, or the United States Government.
This material is declared a work of the U.S. Government and is not subject to copyright protection in the United States.
AFIT-ENG-T-14-J-5
ANDROID BASED BEHAVIORAL BIOMETRIC AUTHENTICATION VIA MULTI-MODAL FUSION
THESIS
Presented to the Faculty
Department of Electrical and Computer Engineering Graduate School of Engineering and Management
Air Force Institute of Technology Air University
Air Education and Training Command in Partial Fulfillment of the Requirements for the Degree of Master of Science in Cyber Operations
Anthony J. Grenga, B.S.C.S. Civilian
June 2014
DISTRIBUTION STATEMENT A:
AFIT-ENG-T-14-J-5
ANDROID BASED BEHAVIORAL BIOMETRIC AUTHENTICATION VIA MULTI-MODAL FUSION
Anthony J. Grenga, B.S.C.S. Civilian
Approved:
/signed/
Gilbert L. Peterson, PhD (Chairman)
/signed/
Major Thomas E. Dube, PhD (Member)
/signed/ Barry E. Mullins, PhD (Member)
27 May 2014 Date 27 May 2014 Date 27 May 2014 Date
AFIT-ENG-T-14-J-5
Abstract
Because mobile devices are easily lost or stolen, continuous authentication is extremely desirable for them. Behavioral biometrics provides non-intrusive continuous authentication that has much less impact on usability than active authentication. However single-modality behavioral biometrics has proven less accurate than standard active authentication. This thesis presents a behavioral biometric system that uses multi-modal fusion with user data from touch, keyboard, and orientation sensors. Testing of five users shows that fusion of modalities provides more accurate authentication than each individual modalities by itself. Using the BayesNet classification algorithm, fusion achieves False Acceptance Rate (FAR) and False Rejection Rate (FRR) values of 9.65% and 2% respectively, each of which is 8% lower than the closest individual modality.
Acknowledgments
I would like to thank James Okolicia for all the help he provided with data acquisition and analysis, all those who participated as test subjects, and Dr. Peterson for adopting me as an advisee.
Table of Contents
Page
Abstract . . . iv
Dedication . . . v
Acknowledgments . . . vi
Table of Contents . . . vii
List of Figures . . . x
List of Tables . . . xi
List of Acronyms . . . xii
I. Introduction . . . 1
1.1 Mobile Device Authentication . . . 1
1.2 Behavioral Biometrics . . . 2
1.3 Multi-Modal Fusion . . . 2
1.4 Thesis Structure . . . 3
II. Related Work . . . 4
2.1 Mobile Device Authentication . . . 4
2.2 Static vs Active Authentication . . . 5
2.3 Biometric Performance Measures . . . 5
2.4 Biometric Authentication . . . 5
2.5 Behavioral Biometric Authentication . . . 6
2.6 Sensor Dynamics . . . 7
2.7 Touch Dynamics . . . 8
2.8 Keyboard Dynamics . . . 10
2.9 Conclusion . . . 11
III. Experimental Design . . . 12
3.1 Data Collection . . . 12
3.1.1 Device Drivers . . . 12
Page
3.1.3 Application Code . . . 17
3.2 Collection Environment . . . 18
3.2.1 Participant Tasks and Selection . . . 18
3.3 Feature Generation . . . 20
3.3.1 Touch Features . . . 20
3.3.1.1 Average Speed per Movement Direction . . . 20
3.3.1.2 Movement Direction Histogram . . . 21
3.3.1.3 Travel Distance Histogram . . . 22
3.3.1.4 Extreme Movement Speed Relative to Travel Distance . . 23
3.3.1.5 Distribution of Actions on the Screen . . . 23
3.3.1.6 Distribution of Pressure on the Screen . . . 24
3.3.1.7 Movement Elapsed Time Histogram . . . 24
3.3.1.8 Average Movement Speed Relative to Travel Distance . . 24
3.3.2 Keystroke Features . . . 24
3.3.3 Gesture Features . . . 25
3.3.3.1 Scale Gesture Histogram . . . 26
3.3.3.2 Scale Gesture Actions on Screen . . . 26
3.3.3.3 Extreme Scale Gestures . . . 26
3.3.3.4 Gesture Elapsed Time . . . 26
3.3.3.5 Average Speed Relative to Travel Distance for Gestures . 27 3.3.4 Orientation Features . . . 27 3.4 Fusion Design . . . 29 3.4.1 Feature Selection . . . 30 3.4.2 Data Sets . . . 30 3.4.2.1 Identification . . . 30 3.4.2.2 Authorization . . . 30 IV. Results . . . 32 4.1 User Identification . . . 33 4.2 Authentication . . . 34 4.3 Additional Testing . . . 35 4.4 Summary . . . 37 V. Conclusion . . . 39 5.1 Final Thoughts . . . 39 5.2 Future Work . . . 40
Page Appendix B: Tasks Given to Participants . . . 44 Bibliography . . . 45 Vita . . . 48
List of Figures
Figure Page
3.1 Device X and Y coordinates with respect to orientation. . . 15
3.2 Accelerometer X Y Z coordinate plane [19]. . . 15
3.3 Device as configured for tests. . . 19
3.4 Features are generated for each user based on slices. . . 21
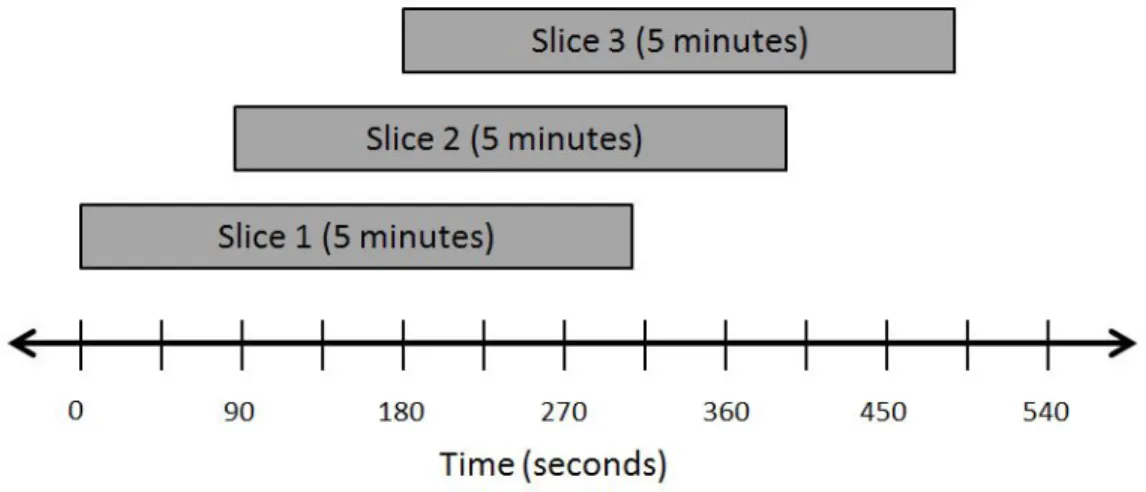
3.5 Overview of slice size and window slide. . . 22
3.6 Direction sectors of touch action movement [1]. . . 22
3.7 The nine screen regions. . . 23
3.8 Orientation States. . . 28
List of Tables
Table Page
3.1 Output from the device driver capture tool when recording touch. . . 13
3.2 Output from the device driver capture tool when recording accelerometer. . . . 13
3.3 Output from the device driver capture tool when recording gyroscope. . . 14
3.4 Output from the device driver capture tool when recording buttons. . . 14
3.5 Output from the Android framework capture tool when recording Gestures. . . 16
3.6 Output from the Android application capture tool when recording keystrokes. . 17
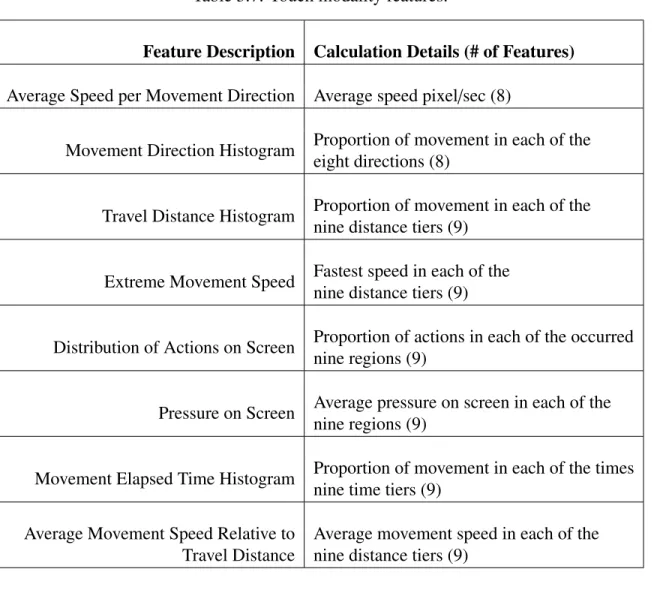
3.7 Touch modality features. . . 25
3.8 Keystroke features. . . 26
3.9 Gesture modality features. . . 27
3.10 Orientation features. . . 28
4.1 Number of Features from Each Modality. . . 32
4.2 User Identification Comparison Results. . . 34
4.3 Authentication Comparison Results. . . 35
4.4 3 Minute Window User Identification Comparison Results. . . 36
List of Acronyms
Acronym Definition
AFIT Air Force Institute of Technology
BYOD Bring Your Own Device
EER Equal Error Rate
WPAFB Wright Patterson Air Force Base
FAR False Acceptance Rate
FRR False Rejection Rate
GUI Graphical User Interface
IMU Inertial Measurement Unit
SD Secured Digital
WiFi Wireless Fidelity
RERAN Record and Replay for Android
ANDROID BASED BEHAVIORAL BIOMETRIC AUTHENTICATION VIA MULTI-MODAL FUSION
I. Introduction
Technology no longer confines computers to a desk. Today’s computers can fit inside a pocket in the form of a mobile phone. These devices have earned the name “smartphones” for their various capabilities, including the ability to access the Internet through a cell carrier’s mobile network. Personal computer sales are down for the first time in eleven years, while smartphones have reached over one billion users worldwide [15]. Smartphones contain valuable personal information, and the owner’s life is often completely integrated into them. Mobile banking, social media, email, and communication are all driven through a single device. However, the convenience of an all-in-one, completely integrated device introduces an easy avenue for a phone’s exploitation and one stop shop for a user’s information. Especially in the realm of government, the talk of Bring Your Own Device (BYOD) has lead to even more security concerns with mobile devices.
1.1 Mobile Device Authentication
Physical security is one specific concern with BYOD for mobile devices. Mobile devices are small and easily stolen or forgotten, leaving the device’s valuable information available for the taking. Current security mechanisms on mobile devices are not as strong as their computer counterparts [6], while they have the potential to hold the same amount of valuable information. The two current standards for mobile device authentication are Google’s Draw and Lock Pattern [19], and Apple’s four digit PIN [4]. These methods are short enough that potential attackers can obtain them easily by observing the target. Also,
all forms of standard static authentication leave the device unprotected after authorization occurs. For example, if the device is unlocked and then left unattended, or stolen while being used, the users, personal information is freely available.
One way to overcome a situation were the user’s unlocked device is intercepted would be to implement a form of reoccurring authentication. An example of continuous authentication would be a password required for re-authentication every five minutes regardless of user activity. However, being constantly asked to re-enter a password while using the device would interfere with the user experience.
1.2 Behavioral Biometrics
Biometrics is the measurable data determined from the biology of the user, such as fingerprint, retina scan, facial recognition, and many other methods [9]. Behavioral biometrics is the measurable data determined from a user’s behaviors such as the way he or she uses the mouse, or interacts with the Graphical User Interface (GUI) [9]. Described simply, standard biometrics is determined by something that you are physically, while behavioral biometrics is determined by something that you do.
Behavioral biometrics techniques are particularly useful when attempting to imple-ment a form of continuous user authentication. This method is able to be non-intrusive and not impact general usability while performing active authentication. This is accomplished by constantly monitoring the user behavior, in order to dynamically make a decision on a set of classifiers that defines a user, to determine if the device is being operated by a valid user.
1.3 Multi-Modal Fusion
This research fuses features captured from the touch screen, keyboard, and orientation sensors to create a dynamic behavioral authentication system for Android mobile devices. In order to validate the method proposed in this work data was collected from a Samsung
Galaxy S4, running Cyanogenmod version 10.2. The test device was used by five participants to capture usage data. The raw usage data was then processed to create features from each modality. Multi-modal fusion then combined these features from the different modalities for classification with three different algorithms: BayesNet, J48 decision tree, and LibSVM, for both identification (multi-class) and authentication (binary class). The tested fusion system achieved a 97.91% identification rate with False Acceptance Rate (FAR) and False Rejection Rate (FRR) authentication values of 9.67% and 2%, respectively.
1.4 Thesis Structure
Chapter 2 discusses prior work on mobile authentication, focusing on behavioral biometrics, sensor dynamics, touch dynamics, and keyboard dynamics. Overviews of static versus dynamic analysis and metrics for biometrics are also presented. Chapter 3 details the experimental design of the fusion system, while overviewing data collection, the collection environment, and feature generation. Next, Chapter 4 analyzes results from the experiments performed. Finally, Chapter 5 provides conclusions of the research and suggests areas of future work.
II. Related Work
In the past, mobile device authentication has been quite simple [13]. Apple and Google, the leaders in the mobile device industry, have kept authentication relatively straightforward with four digit codes and draw-and-lock patterns, respectively [4, 19]. Shoulder surfing, the act of an outside party obtaining these four digit codes or patterns by watching the user, makes these methods insecure [10]. To eliminate the threat of shoulder surfing, biometric authentication measures may be used. Such methods have been growing in popularity in recent years [25].
This chapter presents some of the latest research in mobile device authentication and biometric authentication. An explanation of static versus dynamic authentication is followed by an overview of metrics and terminology for biometrics. Next, a short survey of previous work done with general biometrics on mobile devices is presented. After this background, the chapter presents prior research on behavioral biometric authentication, including the specific categories of sensor dynamics, touch dynamics, and keyboard dynamics. This chapter serves as a foundation for original contributions included in later chapters.
2.1 Mobile Device Authentication
Due to the large number of daily authorizations (unlocking the device) for the average user, mobile device authentication must be secure while also being convenient [6]. This is significantly different from traditional computer use, in which the number of daily authorizations can be relatively low. The frequency of authorization requests has driven mobile phone developers to develop simple and convenient authorization mechanisms on modern devices.
2.2 Static vs Active Authentication
There are two main forms of mobile device authentication: static and active [20]. Static authentication is authentication that occurs once, such as a login screen on a standard computer. Active authentication is authentication that occurs dynamically throughout interaction with the device. A significant advantage of active authentication is that an unattended end system will require re-authorization before allowing access to an authorized user. In contrast, an unattended end system using static authentication could potentially provide access to an unauthorized user. The following sections cover several examples of active authentication [5, 16, 22, 27]. Behavioral biometric authentication is presented as a suitable method for active authentication, because this method can be applied continuously without impeding the user’s actions.
2.3 Biometric Performance Measures
Establishing metrics is important to quantify the success of a mechanism. Previous work with biometrics has measured performance using False Acceptance Rate (FAR), False Rejection Rate (FRR), and Equal Error Rate (EER). FAR refers to the percentage of authentication in which a false positive was reported. That is, an illegitimate user was granted access. Similarly, FRR refers to the rate of false negatives, wherein a valid user was denied access. EER is the value at which the FAR and FRR are equal. This is obtained by plotting curves for the FAR and FRR based on the Receiver Operating Characteristic (ROC). For a quick comparison of two systems, EER can be used. In general a low EER means that a system is accurate [9].
2.4 Biometric Authentication
Biometric authentication is authentication based on a user’s physical traits, in contrast to standard authentication, which is based on the user’s knowledge [9]. One example of biometrics authentication in the current mobile device market is Apple’s iPhone fingerprint
scanner. This authentication method stores a mathematical representation of the user’s fingerprint for authentication and has a FAR of 0.002% [4]. Other forms of biometric authentication methods include use of the front facing camera on mobile devices for either facial recognition [24] or finger knuckle identification [12]. The mobile device camera has also been used to capture fingerprint images for authentication [7].
2.5 Behavioral Biometric Authentication
Behavioral biometric authentication is authentication based on a user’s classifiable behaviors [9]. Some uses of behavioral biometric authentication include authentication based on mouse dynamics [31] and keyboard dynamics [28]. In addition to mobile devices, biometric authentication has been evaluated on desktop computers. Bailey [5], implemented behavioral biometric authentication on computers via multi-model fusion. This means that authentication includes monitoring of all keystrokes, mouse events, and GUI actions. These actions are then “fused” into a single profile, which is then used as a standard for authentication of the valid user. Bailey captured keyboard and mouse events using hooked windows drivers. Once the data was recorded, features were established for each task based on keystrokes and mouse events. Keystroke features included duration of key press and latency between two key presses, while mouse features included movement direction, travel distance, click duration, location on the screen and several other factors. GUI features were established based on user actions, control types and processes executed. Fusion between these various features was then applied using two different methods: multi-class and binary multi-class datasets. Bailey found that the fusion of these different modalities features provided better identification than the features applied individually.
Others have taken a user’s behavioral decisions to determine access such as Al-Khazzar, et al. [2]. In order to build a profile for each user, Al-Al-Khazzar, et al. used a three dimensional maze where users could make diverse decisions and they identified each user from his or her actions. Different options for movement within the maze included left
and right turns, continuing forward or turning around in the maze. Second level variables from consecutive decisions were also factored into user identification. The effort achieved an 84% identification rate with a FAR of 0. This established the premise that it is possible for users’ decisions to be used as a potential means of user identification on a mobile device. Efforts have also been made to create a user “Finger Print” by identifying behaviors while using a mobile device. Gupta, et al. [22] created “HuMan”, a utility that analyzes a user’s emails, text messages, phone calls, and other actions on the device. Despite the use of many different behavioral factors of mobile phone actions, HuMan has only achieved a 40% identification rate, with an EER of 15%.
Existing authentication mechanisms have also been modified to incorporate behavioral authentication methods. Benton, et al. [8] used the Android “Draw and Lock Pattern” authentication along with behavioral features for authentication. While a user entered the draw and lock pattern, pressure, duration between points, andx,ycoordinates for the points were captured as features and these features were then analyzed to grant a user access, given that the correct code was entered. The draw and lock pattern in conjunction with the behavioral aspects while entering the pattern created a two-step authentication similar to a token-pin setup. However, the limitations on the amount of data collected from only the draw-and-lock pattern led to a high EER of 17%.
2.6 Sensor Dynamics
Miguel, et al. [21] and Nickel [29] used the accelerometer to identify a user based on their average gait cycle. Average gait cycle is a normal walking pattern, including one step from each leg. Miguel identified some of the weaknesses when using the accelerometer, such as differences in sampling rates between devices and noise from the high sensitivity of the accelerometers on the latest mobile devices. Even with these weaknesses, Miguel and Nickel still achieved reasonable FAR and FRR rates. However, they were obtained at optimal conditions: the phone was attached directly to the users belt in both studies, with
no user activity on the device during test. This raises the issue of applicability, since the average user may store his or her mobile device in a pocket or a purse, rather than on a belt clip. Also, this form of authentication does not address the situation of stationary device use, when the user is not walking.
Others have used the sensors on mobile devices to authenticate the user via behavior while holding the device [27]. This method focuses on not interfering with the user experience when authenticating. To monitor the behavior, the orientation sensors were used to capture pitch, roll, and heading. By capturing these values, the mechanism is then able to identify users based on how they hold the phone while stationary. The research found that each user holds a device differently in regards to pitch, roll, and heading. Lin, et al. [27] achieved an EER of 6.85% with this method.
2.7 Touch Dynamics
Hooking into the GUI, Gomez, et al. [18] were able to capture user touches on a device and replay the user’s actions. This mechanism, Record and Replay for Android (RERAN) established the idea that touches can be accurately captured and replayed to reproduce a user’s activities on a mobile device. RERAN was able to record user actions to successfully replay 86 of 100 Android applications tested.
Feng, et al. [16] created the Finger gestures Authentication System using Touchscreen (FAST) framework to authenticate users via their touch gestures. The gestures identified as features for the test were flick, pinch, spread, drag, and rotate. When testing FAST, the sample population was divided into two different groups. For one group, data was collected only on their touch gestures, while the second group was asked to wear an Inertial Measurement Unit (IMU) glove, which monitored the hand and finger movements while operating the device. The participants performed touch-related tasks to train the framework to each user, and then repeated the same tasks while the FAST framework analyzed the gestures to determine authorization dynamically throughout the experiment. From the
group that did not wear a glove, FAST achieved a FAR of 11.96% and FRR of 8.93%. The additional features captured from the IMU glove allowed FAST to achieve an improved FAR of 2.15% and a FRR of 1.63%. Unfortunately, the IMU sensor glove used to achieve the low FAR and FRR values from this test is highly impractical for everyday use. Also, the work identifies the weakness that authentication on gestures alone is weak, because of the average mobile device use is not gesture-heavy. For an average user, it would take about an hour to gather adequate gesture data to dynamically authenticate the user [16].
Another active identification method using touch dynamics was created by Bo, et al. [11]. Bo, et al. framework, SilentSense, focused on tap, scroll and fling user touch actions. Specific touch features analyzed included coordinates, duration, pressure, vibration and rotation. The SilentSense framework first observes and learns user’s behaviors, and then identifies the user based on matching learned actions. When testing SilentSense, developers observed that one touch action corresponded to a FAR of 22%, and one fling action a FAR of 9%. When observing more than three fling actions, SilentSense had a FAR of below 1%. Bo, et al. determined that for SilentSense to have an EER of below 1%, 10 consecutive touch actions were required. However, SilentSense is only an identification tool which constantly learns and identifies users, and is not yet viable as a method of authentication. Beyond the outcomes of SilentSense’s acceptance rates, Bo, et al. identified power consumption as one of the major issues with constantly monitoring user actions. The constant polling of high power sensors and additional reporting of user actions introduces a significant strain on the battery consumption of mobile devices [11].
Frank, et al. [17] used only horizontal and vertical touch swipes to authenticate a user. From the swipes, several features were identified for classification, such as coordinates, length, and duration. Frank’s tests required subjects to read several passages and answer questions based on the reading. With a single stroke analyzed, the result of turning the page of the passage, the framework achieved an approximate 13% EER. With 11-12 strokes
analyzed, the EER lowers to around 2%. Stroke analysis achieves one of the best EERs of all related work surveyed. However, the test is executed in a perfect environment where multiple similar swipes are analyzed as the user reads extended passages on a mobile device.
Others have also explored user identification based on touch screen biometrics, such as the work of Angulo, et al. [3], which focuses on Android’s draw-and-lock pattern. Angulo, et al. identified users by focusing on the time spent on a dot and the time spent outside of a dot as features for classification. Angulo, et al. identifies a dot as one of the nine points on the screen, between which lines can be connected to draw a specific pattern. Participants repeatedly drew three different standard lock patterns, fifty times each to extract features. Of the 150 tests, the initial 10 repetitions of each pattern were disregarded for the participants to learn the pattern, leaving 130 tests to be evaluated. Using the Random Forest Classifier, the overall results yielded an EER of 10.39%. Angulo, et al. determined that an EER of 10.39% was viable for implementation, considering that, the 10.39% would be only if the impostor knew the user’s lock pattern. However, given a six-dot draw-and-lock pattern, there are over 16000 possible combinations. At this point, behavioral authentication of the pattern is irrelevant and its only benefits would be if the attacker knew the pattern.
2.8 Keyboard Dynamics
Xuan, et al. [23] used typing behavior to authenticate a user. Their mechanism tracked duration of key presses and latency between keystrokes. This mechanism was implemented solely in conjunction with standard user authentication (via user name and password). The study used a client server architecture where user name and password were gathered in conjunction with typing behavior, and this information was then used for authentication. A significant weakness in this mechanism was the limited sample space, since duration and latency were only monitored for the length of the user’s login credentials.
In a similar manner, the work of Saevanee, et al. [30] focused on users’ behaviors when entering a 10 digit number. Saevanee, et al. asked the 10 participants to enter a 10-digit number 30 times on a mobile device. From this data, the features extracted were duration of key press and latency between presses. The first 20 times the code was entered by each participant was used for classification while the last 10 were used to determine authentication rates against the classifiers. Using these features as individual authentication methods, the application of press duration achieved an average EER of 30% and press latency an EER of 35%. Although these rates seem alarmingly high, they are only based on one feature. The possibility of multifactor fusion could result in much lower EER values.
2.9 Conclusion
Although there is some research being done in behavioral biometrics on mobile devices, there is limited research done with fusion of more than one or two features. Of the work surveyed, fusion was only implemented on features from similar data sources, and never from different modalities on mobile devices. Specifically, more work needs to be done with active authentication, in order to support the growing field of behavioral biometrics. A viable source of active authentication would be beneficial as a nonintrusive option, as opposed to the inconvenience of a short screen time-out and forced re-authentications. The surveyed work has also identified some issues with behavioral biometric authentication that must be addressed when considering a viable implementation, such as the usability issues associated with false rejections, and the power consumption of additional processing and polling of sensors on the device.
III. Experimental Design
This study focuses on three modalities: the touchscreen, the keyboard, and the orientation sensors on the device, to determine if the fused features obtained from the three modalities are viable for a active authentication system on mobile devices. The following chapter depicts the data collection method, collection environment, participant tasks and selection, feature generation, and finally, the fusion design.
3.1 Data Collection
To permit active authentication on mobile devices, information about the individual user of the device must be captured. The target platform for this experiment was Google’s Android operating system, using Cyanogenmod version 10.2 [14]. Android was selected for two reasons. First, Android’s ease of development due to an open source nature. Second Android is currently the leader in mobile device market share, with over 52% of current mobile users using Android [26]. For data collection on the device, different user actions demanded different collection methods. To capture the different modalities, three different collection methods were used: hooking device drivers, modifying the Android framework, and hooking applications.
3.1.1 Device Drivers.
Device drivers provide communication between the hardware and operating system without the operating system needing direct knowledge of the hardware. Most of the data used is collected at the driver level before the information is passed to the operating system. Raw touch data, IMU sensor data, and button data were collected within their respective drivers, Appendix A outlines what was captured from each specific driver. When a hardware action occurs, the drivers process these events and deliver the event to the input system. This occurs through the input_report() and inputsync() functions.
The input_report() function sends the specific handled event to the input system and the input_sync() function signals that the complete event was handled. Within the source for each kernel driver, input_report() functions were identified and the data being reported to the input system was captured and reported to a log file on the Secured Digital (SD) card. All kernel drivers were written in C and Standard file input and output functions were unavailable. Therefore, syscalls were utilized for file manipulation. Examples of the data capture from the device drivers can be seen in Tables 3.1-3.4. The order of the output for each line includes the action name, time in seconds, and data values from the input.
Table 3.1: Output from the device driver capture tool when recording touch.
Action Time (s) FingerID X Y Pressure
Touch Action 1398097280.247149 0 164 400 58 Touch Action 1398098019.290789 0 917 1329 83 Touch Action 1398098020.767627 0 147 1475 104 Touch Action 1398098021.109027 0 848 1489 95 Touch Action 1398099756.466021 0 918 351 124 Touch Action 1398099758.334460 0 866 1187 89
Table 3.2: Output from the device driver capture tool when recording accelerometer.
Action Time (s) X Y Z Accl Action 1398097260.923694 -1421 8995 12071 Accl Action 1398097260.981463 -966 8858 12335 Accl Action 1398097261.041369 -1505 8565 12858 Accl Action 1398097261.103137 -2108 8387 14675 Accl Action 1398097261.161792 -738 9107 12652 Accl Action 1398097261.222857 -1585 8663 13557
When examining a specific event, all data associated with that event handled by the driver was captured. The captured touch data contains FingerID, X, Y, and pressure. FingerID represents the finger performing that specific touch, if there are multiple fingers
Table 3.3: Output from the device driver capture tool when recording gyroscope. Action Time (s) X Y Z Gyro Action 1398097280.990069 -435 268 -319 Gyro Action 1398097280.998523 -423 284 -296 Gyro Action 1398097281.008075 -431 306 -235 Gyro Action 1398097281.018023 -477 354 -212 Gyro Action 1398097281.028094 -525 325 -177 Gyro Action 1398097281.038073 -615 330 -114
Table 3.4: Output from the device driver capture tool when recording buttons.
Action Time (s) Press/Release Button ID
Button Action 1398089763.425630 n/a 172
Button Action 1398089764.863466 n/a 172
Capacitive Button Action 1398089783.216768 Press 1
Capacitive Button Action 1398089783.407716 Release 1
Capacitive Button Action 1398089841.538942 Press 0
Capacitive Button Action 1398089841.717347 Release 0
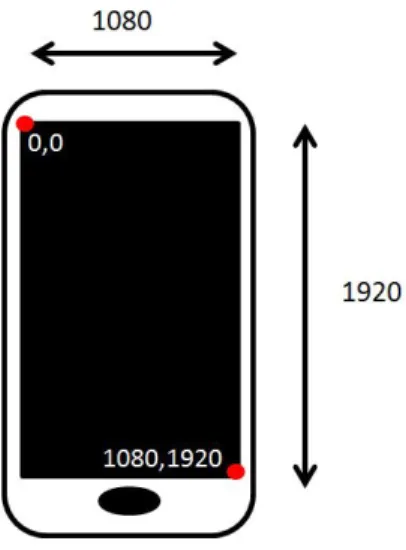
being used. FingerID is an array with start index of 0. X and Y represent the location (coordinates), of the touch on the device’s screen, the orientation of the device does not affect the location of a point on the device, as seen in Figure 3.1.
Pressure is an integer value representing the force of that touch ranging from 0 to 200. The captured accelerometer data containsx, y,andzwherex,y,zrepresents directional forces on the x,y,z planes as seen in Figure 3.2. The captured gyroscope data contains
x, y, and z where x,y and z represents rotational motion in degrees per second on each specific axis. The captured button data contains two types of button actions: standard and capacitive. Additional information captured was buttonID, and press and release. Standard button actions represent any time a physical button is pressed, such as the volume button or the home button, there is no press release data for physical buttons. Capacitive button actions represent anytime a capacitive button was pressed or released. On the test device,
Figure 3.1: Device X and Y coordinates with respect to orientation.
there were two capacitive buttons: an options button and a back button. All specific files and locations of data capture functionality are located in Appendix A.
Figure 3.2: Accelerometer X Y Z coordinate plane [19].
3.1.2 Android Framework.
The Android framework is what enables and controls its unique functionality as a mobile platform operating system. It is the application-level code that contains abstracted
hooks that become the building blocks for application developers. Data for touch gestures, and keyboard could not be obtained from the drivers themselves because they are higher level constructs in themselves. The Android framework was specifically used for capturing the multitouch gestures: pinch and zoom. Multitouch gestures are handled by the Java event listener Scale Gesture Detector. Within the scale gesture detector, as soon as a multitouch event is constructed, the data is collected from that event as it is accessible to applications. The data collection for multitouch gestures took place in the gesture detector constructor. The Android framework is written in Java and all parts of the gesture collection used Java
PrintWriters. An example of the data capture from the Android framework can be seen in Table 3.5. The order of the output for each line includes action name, time in seconds, and data values from the input.
Table 3.5: Output from the Android framework capture tool when recording Gestures.
Action Time (s) Span X Span Y Focus X Focus Y
ScaleGesture 1398097681 144.0 144.0 817.1221 1513.8779 ScaleGesture 1398097681 144.0 144.0 815.5853 1515.4149 ScaleGesture 1398097681 144.0 144.0 814.03656 1516.9636 ScaleGesture 1398097684 144.0 144.0 835.0 1478.9015 ScaleGesture 1398097684 144.0 144.0 835.0 1477.3508 ScaleGesture 1398097684 144.0 144.0 835.0 1475.807
The captured gesture data contains span X, span Y, focus X and focus Y. Span X and Y represent the distance between two fingers in each axes starting at 0. Focus X and Y represent the central point of the pinch or zoom in terms of x,y coordinates of the phone screen. For example, if a user was performing a zoom gesture the focus would be at point x,y and while they were sliding their fingers outward the distance between them would become greater resulting in a larger span x and span y value, with the inverse being true for a pinch gesture. When attempting to capture flick gestures, there were several issues with
how a flick is processed within the Java framework that were not conducive to capturing it as a single action. Therefore no features were generated for flick gestures.
3.1.3 Application Code.
Recent mobile devices have replaced the standard physical keypad with a full touchscreen interface. With this touchscreen interface there is no longer a dedicated driver that runs keyboard input. However, the keyboard itself is an application that runs on the screen of the mobile device. Since the keyboard is an application, the data collection for the keyboard input was done within the Java application itself. Within the keyboard application, hooks to the key press and key release methods were made to log input from the user. An example of the data capture from the Android application can be seen in Table 3.6. The order of the output for each line includes action name, time in seconds, and data values from the input.
Table 3.6: Output from the Android application capture tool when recording keystrokes.
Action Time (s) Key Code ASCII Value Press/Release
Keyboard Action 1398098008 73 I Press
Keyboard Action 1398098008 73 I Release
Keyboard Action 1398098008 104 h Press
Keyboard Action 1398098010 98 b Press
Keyboard Action 1398098011 97 a Press
Keyboard Action 1398098012 97 a Release
The captured keyboard data contains time in seconds, key code, ASCII value, and whether each action was a press or release. The key code represents an integer that identifies a character pressed. Special keys such as back space, shift, and emotions return negative numbers, and their values have been mapped. ASCII value is the transformation from key code to actual ASCII printable character. Press/Release represents when a key-down action and key-up action have taken place. If the users, finger slides from one key
to another there is no release unless that finger is removed from the screen on that specific key, such as press events for ‘h’ and ‘b’ as seen in the sample output in Table 3.6.
3.2 Collection Environment
The data collection was performed on a Samsung Galaxy S4 with the following software configuration:
• Custom version of Cyanogenmod 10.2
• GApps for Cyanogenmod (Google’s Proprietary Applications)
• Games
– Angry Birds
– 2048
– Candy Crush
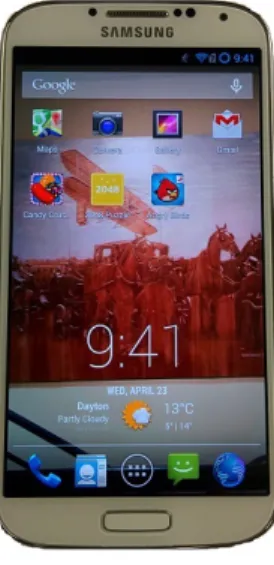
Cyanogenmod is an open source firmware distribution for smartphones and tablets that is based offthe Android operating system [14]. Cyanogenmod was used for the collection environment operating system because of the ease at which changes to source can be made and recompiled, in order to add the data collection tools to the phone. Each participant used the same device configured as listed above. The device used is shown below in Figure 3.3.
3.2.1 Participant Tasks and Selection.
A total of five participants volunteered from the general population of the Air Force Institute of Technology (AFIT). All participants were graduate students from the Cyber Security program. All participants had a personal smartphone with standard touch keyboard and multi-touch interface. For this reason, no time was allotted for the participants to learn the interface and get comfortable with the device.
Figure 3.3: Device as configured for tests.
Participants were given an outline of a basic afternoon lunch break scenario for testing. Participants received the device and testing sheet at AFIT on Wright Patterson Air Force Base (WPAFB) and were told to locate a lunch destination using the device, drive to that location and perform basic tasks with the device throughout the scenario. The lunch destination was subject to participant discretion. However, the destination must have freely-accessible Wireless Fidelity (WiFi) Internet access. The test device did not have active access to cellular networks and therefore relied on WiFi for functionality. Once participants arrived at their lunch destination, they were required to send text messages, browse the Internet, play a game, and send an email. These tasks were designed to simulate a normal user’s interaction with their mobile device. The full testing sheet given to each participant is displayed in Appendix B.
3.3 Feature Generation
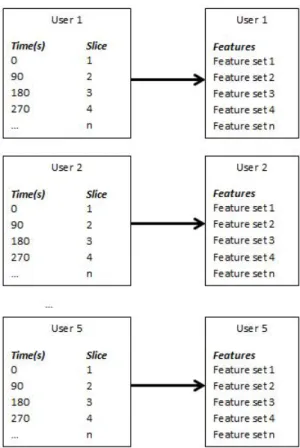
After the raw data was collected from the participants, it was then processed to create features for classification. The derived features are similar to those used by Bailey [5] on behavioral computer-based biometric authentication via multimodal fusion. Feature generation was aided by software created for Bailey’s work, modified and appended for use with mobile devices. In previous work, features were sliced based on tasks. For this work, to ensure that individual slices contained adequate data, slices were 5 minutes with 90-second window slides. A slide refers to the amount of time before a new window starts, creating an overlap of data slices. Feature generation from slices is depicted in Figure 3.4, with an overview of slice size and window slide shown in Figure 3.5. Additionally features were divided into smaller slice sizes, to 3 minute windows maintaining 90 second slides. This smaller window size was used in attempt to deal with a lack of user data.
3.3.1 Touch Features.
The touch features were derived from work done with mouse features by Ahmed, et al. [1], Zheng, et al. [32], and Shen, et al. [31]. The methods for each feature calculation are discussed below and presented in Table 3.7. Some of the features are movement based and were initially created for mouse events where the cursor never leaves the screen. With touch events, however, there are portions of time when no finger is on the device, or touches are happening without a dragging movement. To deal with this issue, movement for touch events were defined as half a second of silence, or a touch difference of 500 units.
3.3.1.1 Average Speed per Movement Direction.
The average speed per movement direction feature represents the user’s touch actions in eight different directions across the screen, as represented in Figure 3.6. Ahmed, et al. [1] used eight, 45 degree wide sectors for mouse movements, so the same is used here for touch. Movement direction was determined based on the angle between the start
Figure 3.4: Features are generated for each user based on slices.
coordinates and the end coordinates. Speed was determined via start and end coordinates representing start and stop times along with distance over time, to be calculated from time stamps, yielding pixels per second. Pixels per second is used for any following speed-related feature calculation.
3.3.1.2 Movement Direction Histogram.
The movement direction histogram represents the proportion of movements that the user makes in each of the eight directions across the screen. Calculated by the number of movements in each of the eight directions dived by total number of movements.
Figure 3.5: Overview of slice size and window slide.
Figure 3.6: Direction sectors of touch action movement [1].
3.3.1.3 Travel Distance Histogram.
The travel distance histogram represents the proportion of user movements in a certain range of distances. All distance ranges are measured in pixels. The histogram contains nine tiers with 200 pixel intervals: I(0-200), II(201-400), III(401-600), IV(601-800), V(801-1000), VI(1001-1200) VII(1201-1400), VIII(1401-1600), IX(1601+). These ranges were established from a pilot study performed on a test device.
3.3.1.4 Extreme Movement Speed Relative to Travel Distance.
Extreme movement speed relative to travel distance represents the largest recorded speed in a given distance tier, similar to the above travel distance histogram. The same nine tiers are used from the travel distance histogram, except pixels per second.
3.3.1.5 Distribution of Actions on the Screen.
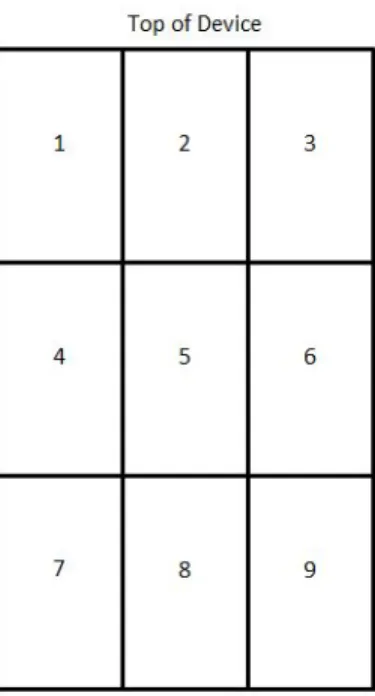
The distribution of actions on the screen represent a histogram containing the proportion of touch movements that end in the nine different regions across the screen as seen in Figure 3.7.
Figure 3.7: The nine screen regions.
The nine different regions are not affected by the orientation of the device, meaning that each region has the same boundaries and location in all four of the device orientation states.
3.3.1.6 Distribution of Pressure on the Screen.
The distribution of pressure on the screen represents a histogram containing the proportion of touch pressure that occurred in the nine regions across the screen seen in Figure 3.7.
3.3.1.7 Movement Elapsed Time Histogram.
The movement elapsed time histogram represents the time it took each touch movement to occur. The histogram has nine tiers at half second intervals: I(0-.5), II(.501-1), III(1.01-1.5), IV(1.501-2), V(2.01-2.5), VI(2.501-3) VII(3.01-3.5), VIII(3.501-4), IX(4.01+).
3.3.1.8 Average Movement Speed Relative to Travel Distance.
The average movement speed relative to travel distance is calculated using prior data about distance and speed from each touch movement. The average movement speed was determined for each of the nine travel distance tiers. Travel distance tiers are the same as those used in the travel distance histogram above.
3.3.2 Keystroke Features.
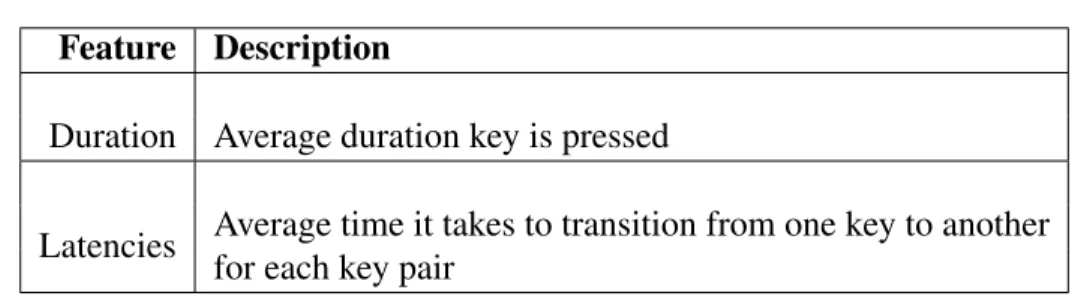
Similar to the previously discussed touch features, keystroke features were derived from previous work [28]. Physical and capacitive buttons were integrated into keyboard features with their respective keycodes. However, physical buttons do not have press-and-release reported and therefore do not have duration features. The two types of keyboard features, duration and latencies, are discussed below and presented in Table 3.8.
Keystroke duration refers to the average time between press and release for each key. Keystroke latencies refers to the average time it takes for a user to transition from one key to another. For example, the user is typing the word “the”, latencies would exist between the release of ‘t’ to the press of ‘h’ and the release of ‘h’ to the press of ‘e’. With 101 different keycodes from the keyboard and buttons, this results in 10,201 possible digraph combinations. Within the standardized data collection almost all of these will never occur.
Table 3.7: Touch modality features.
Feature Description Calculation Details (# of Features)
Average Speed per Movement Direction Average speed pixel/sec (8)
Movement Direction Histogram Proportion of movement in each of the eight directions (8)
Travel Distance Histogram Proportion of movement in each of the nine distance tiers (9)
Extreme Movement Speed Fastest speed in each of the nine distance tiers (9)
Distribution of Actions on Screen Proportion of actions in each of the occurred nine regions (9)
Pressure on Screen Average pressure on screen in each of the nine regions (9)
Movement Elapsed Time Histogram Proportion of movement in each of the times nine time tiers (9)
Average Movement Speed Relative to Average movement speed in each of the Travel Distance nine distance tiers (9)
The combinations that did not occur were removed so they do not add any interference to the classification algorithm. When typing, users often pause to think about what they are going to type next or to compose their thoughts. This pause would significantly influence latencies. To help remedy the situation any touch action in between a key press would disregard that latency for that key press.
3.3.3 Gesture Features.
Gesture features were calculated focusing on pinch and zoom gestures specifically based on the size of separation between fingers and the location they appeared on the
Table 3.8: Keystroke features.
Feature Description
Duration Average duration key is pressed
Latencies Average time it takes to transition from one key to another for each key pair
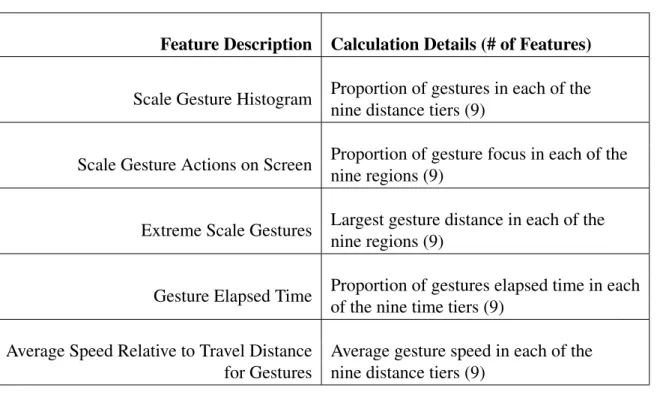
screen. Gesture features were created by extrapolating concepts from the touch features above. The gesture features are presented in Table 3.9.
3.3.3.1 Scale Gesture Histogram.
The scale gesture histogram represents the proportion of user gestures in certain distance intervals. The distance intervals represent the distance between the two fingers performing either a pinch or zoom, as discussed in Section 3.1.2. The histogram contains nine tiers with 200 pixel intervals: I(0-200), II(201-400), III(401-600), IV(601-800), V(801-1000), VI(1001-1200) VII(1201-1400), VIII(1401-1600), IX(1601+).
3.3.3.2 Scale Gesture Actions on Screen.
Scale gesture actions on the screen represent a histogram containing the proportion of gesture actions that have a focus in one of the nine different regions across the screen, as seen in Figure 3.7.
3.3.3.3 Extreme Scale Gestures.
Extreme scale gestures relative to distance represents the largest recorded gesture in a given distance tier. The same nine tiers are used from scale gesture histogram above.
3.3.3.4 Gesture Elapsed Time.
The gesture elapsed time histogram represents the proportion each gesture to occur in a specific time interval. The histogram has nine tiers at half second intervals: I(0-.5), II(.501-1), III(1.01-1.5), IV(1.501-2), V(2.01-2.5), VI(2.501-3) VII(3.01-3.5), VIII(3.501-4), IX(4.01+).
3.3.3.5 Average Speed Relative to Travel Distance for Gestures.
Average speed relative to travel distance for gestures is calculated using prior data about gesture distance and gesture elapsed time. To determine the average speed for each of the nine travel distance tiers, gesture distance was divided by elapsed time. Travel distance tiers are the same as those used in the scale gesture histogram above.
Table 3.9: Gesture modality features.
Feature Description Calculation Details (# of Features)
Scale Gesture Histogram Proportion of gestures in each of the nine distance tiers (9)
Scale Gesture Actions on Screen Proportion of gesture focus in each of the nine regions (9)
Extreme Scale Gestures Largest gesture distance in each of the nine regions (9)
Gesture Elapsed Time Proportion of gestures elapsed time in each of the nine time tiers (9)
Average Speed Relative to Travel Distance Average gesture speed in each of the for Gestures nine distance tiers (9)
3.3.4 Orientation Features.
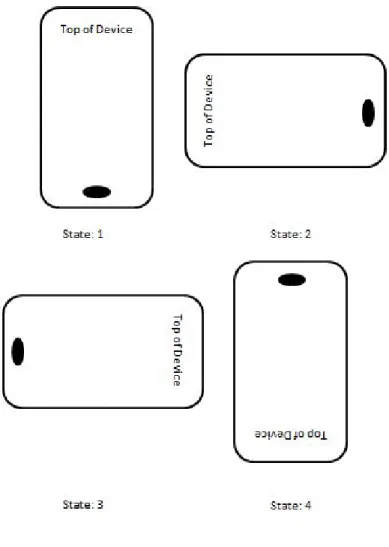
Orientation features were derived by a pilot study done on the test device. The two types of orientation features, are the orientation histogram and orientation time histogram presented in Table 3.10. Orientation histogram represents the number of orientation events in each of the four orientation states. The orientation states represent when the device is right side up (state 1), on either side (states 2 and 3), or upside down (state 4) as pictured in Figure 3.8. Orientation time histogram represents the amount of average time spent in each of the four orientation states.
Figure 3.8: Orientation States.
Table 3.10: Orientation features.
Feature Description
Orientation Histogram Number of orientation event changes in each state Orientation Time Histogram Average time spent in each orientation state
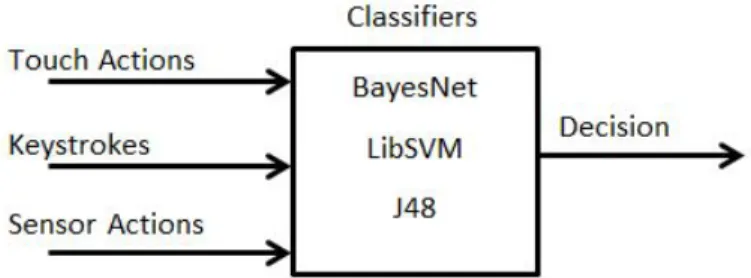
3.4 Fusion Design
To determine if the fusion of the modalities (touch, sensors, and keyboard) provide better results then each modality separately, comparison testing was performed on each of the modalities individually against the fusion approach was performed on the two data sets: multi-class and binary-class. Both identification and authorization were tested to determine if the fusion system is viable as an active source of authentication on mobile devices.
The fusion approach can be seen in Figure 3.9. It involves taking the selected features from all three modalities and then passing them through one of the classification algorithms in order to make a decision. The three different algorithms tested for classification come from successful results in previous work. BayesNet, LibSVM, and the J48 decision tree algorithms were successfully used for classification on keystrokes, mouse dynamics, and GUI interactions, respectively [5, 28, 31], along with gesture recognition and gait cycles [16, 21]. All machine learning classification is done using the Weka data mining toolkit. Weka was chosen from its success in Bailey’s work with multi-modal fusion on computers [5].
3.4.1 Feature Selection.
For all testing, features were selected based on the results from initial data collection. Due to the structured test setup and limited typing required for the participants to perform during data collection, a significant number of the key latencies would never occur and they were excluded. However, all other features were used for fusion.
3.4.2 Data Sets.
The two classification tasks conducted were multi-class (user identification) and binary-class (authorization). Both classification tasks were tested for each individual modality (touch, keyboard, orientation sensors) and for the fusion approach.
3.4.2.1 Identification.
User identification is a multi-class classification problem. This is because each user must be identified from a large pool of unidentified users (multiple classes). An optimal classification algorithm identifies each user from the given data set correctly. The outcome of multi-class classification will determine the identification rate for each algorithm. Identification classification is done on the entirety of user slices, with 10-fold cross-validation.
3.4.2.2 Authorization.
Authentication is a binary-class problem. That is, a single known class is used to determine the identity of a second unknown class. To train the classifier for this form of test, a selection of 5 known user slices with 2 unknown user slices are used. The known user slices where all from a single user, while the unknown slices will be a random sample of the other four user slices. For testing a set of user slices containing 5 known user slices along with 15 unknown user slices were fed into the classifier to make a decision on each user slice whether it is the known user or an unknown user. Any slices in the training set were not used in the test set and any slices in the test set were not used in the training set, making the training set and test set mutually exclusive. Two distinct training sets and two
distinct test sets were created for each user, with 15 instances in each set for a total of 300 classifications. The success of each authorization determined the FRR and FAR, which represent Type I and Type II errors respectively. A Type I error is when a valid user (user that should be authenticated) is denied access, and a Type II error is when an invalid user (user that should not be authenticated) is authorized access. The final FAR and FRR values were calculated by taking the average over all user classifications.
This concludes the description of experimental design for an original contribution to the field of biometric authentication. The following section details the results of this experiment.
IV. Results
This reserach included two main goals: to show that behavioral biometrics would be viable if implemented on mobile devices, and to show that fusion between different modalities provides better authentication results than using them individually. This chapter analyzes the results from feature fusion to determine if it is more effective than the results from the individual modalities. Comparison results from both tasks (user identification and authentication) are presented in the following sections.
The 5 test subjects worked on the prescribed mobile device tasks for an average of 17.4 minutes, resulting in an average of 11.6 slices recorded for each user. From the 5 users, there are a total of 58 slices. Of these 58 slices, 10 were considered unusable, because they occurred while the device was locked or not being used. The unusable slices were removed, resulting in 48 slices viable for testing. As discussed in Section 3.4.1, all features that returned valid information were used for testing. Table 4.1 shows the total number of features from each modality. The division of modalities for testing is based on those detailed in Section 3.3. That is, the touch modality contains all touch features along with gesture features. The keyboard modality contains all key features along with button features. Finally, the sensor modality contains all orientation sensor features.
Table 4.1: Number of Features from Each Modality.
Feature Total Number of Features
Touch 140
Keyboard 83
From the total number of features, the only modality that had features removed was the keyboard. Due to the limited requirements for using the keyboard to complete the task, some of the keys were not pressed, and therefore some of the latency combinations did not occur. Of the 130 keys available to the user only 22 were used at least once, with only 61 of the possible key combinations occurring throughout the test.
Furthermore a pilot study captured accelerometer and raw gyroscope data, and no features were generated using this data. This was due to inconsistencies from the un-calibrated raw gyroscope data, the lack of a clearly defined method for creating accelerometer-based features for mainly stationary users. How a user holds a phone in regards to a three dimensional axis system was assumed to be as relevant as touch data, meaning including this feature would likely significantly improve authentication accuracy. The accelerometer is most useful while the user is walking. However, at that time, the device is locked and no other features are being captured. While the accelerometer’s potential was not as high as the gyroscope, any feature unobtained is lost data.
For the classification experiments, the Weka data mining and machine learning software system version 3.7.11 was used. Version 3.7.11 was used successfully for both the BayesNet and J48 decision tree algorithms. Testing LibSVM used Version 3.6.7 since LibSVM had errors in Version 3.7.11. A portion of the BayesNet and J48 classification testing was done using version 3.6.7 to ensure that the of results over the two different versions of the Weka platform were consistent. It was found that version did not affect results. For each classification experiment, the Weka defaults were used for all three classification algorithms. This decision was made based off prior work. Classification testing was done to determine authentication and user identification rates.
4.1 User Identification
User identification was tested on the 48 usable instances with the three classification algorithms, using a Cross Validation (CV) value of ten folds. Each identification test was
performed on the modalities individually, along with the feature fusion method. Table 4.2 shows the comparison results. These results show that the BayesNet classification algorithm on the feature fusion data set performed the best, with a correct user identification rate of 97.91%. This means that with cross validation set at ten folds, the BayesNet classification algorithm was able to correctly determine 47 of the 48 instances with only one incorrect prediction. Also, high identification rates occur with BayesNet on touch data at (95.83%) and J48 on the fusion data set at (81.13%). Extremely low values occurred mostly on the sensor data set (31.25%, 37.50%) and with the LibSVM classification algorithm (20.83%, 50.00%).
Table 4.2: User Identification Comparison Results.
Identification (10-fold CV) %
Touch Keyboard Sensor Fusion
BayesNet 95.83% 52.08% 31.25% 97.91%
J48 75.00% 60.41% 37.50% 81.13%
LibSVM 20.83% 50.00% 52.08% 20.83%
4.2 Authentication
Because this experiment was developed to support research in user authentication, the data gathered from each test subject was analyzed to test the success of multiple methods. Authentication was tested on two training sets and two test sets of data for each user. As discussed in Section 3.4.2.2, each training set consisted of 5 known user slices and 2 unknown user slices, and each test set consisted of 5 known user slices and 15 unknown user slices. Selection of all slices was random, using the Python libraryrandom.py. To maintain the mutual-exclusivity of the training and test sets, all four sets were not simultaneously selected, due to the limited number of user instances. Instead, each of the four combinations
of training and test sets was randomly generated. Each of the four combinations was then tested using each of the three classification algorithms to determine acceptance rates.
The resulting FAR and FRR values for each modality and fusion on each classification algorithm are shown in Table 4.3. The best result was the BayesNet classification algorithm on the feature fusion data set, with a FAR of 9.67% and FRR of 2%. Noticeably low FAR and FRR values of 21% and 10.67%, respectively, occurred with the BayesNet algorithm on the touch data set. It can also be seen that sensor data provided little to no valuable data for classification, and all three algorithms categorized most sensor data as belonging to the known class, as shown in the fifth column of the following table.
Table 4.3: Authentication Comparison Results.
Authentication (FAR & FRR) %
Touch Keyboard Sensor Fusion
BayesNet FAR 21.00% 47.00% 99.33% 9.67% FRR 10.67% 13.33% 0.00% 2.00% J48 FAR 28.67% 39.00% 96.67% 25.33% FRR 8.33% 14.67% 0.00% 1.00% LibSVM FAR 46.00% 56.00% 100.00% 31.33% FRR 17.66% 23.00% 0.00% 6.33% 4.3 Additional Testing
In order to imporve the accuracy of experimental results, more data instances were added. This was done by reworking feature generation. The window size was changed from 5 minutes to 3 minutes and the slide length remained the same, at 90 seconds. This increased the total number of complete instances from 48 to 104. Table 4.4 shows the user identification comparison results with the smaller window size.
The reconfigured feature generation obtained comparable identification results, for a 97.12% user identification rate with the BayesNet classification algorithm applied to the fusion data set. The smaller window size generally yielded better results with regards to the J48 decision tree algorithm.
Table 4.4: 3 Minute Window User Identification Comparison Results.
Identification (10-fold CV) %
Window Size (minutes) Touch Keyboard Sensor Fusion
BayesNet 3 95.20% 46.15% 42.31% 97.12% 5 95.83% 52.08% 31.25% 97.91% J48 3 84.60% 61.54% 52.88% 86.54% 5 75.00% 60.41% 37.50% 81.13% LibSVM 3 16.35% 48.08% 39.42% 16.35% 5 20.83% 50.00% 52.08% 20.83%
Initially, Authentication testing with the smaller window size had negative effects on all FAR and FRR values. However, with the smaller window size, more instances allowed for a re-balancing of training and test data sets in order to achieve optimal results. Interesting results were observed when each training set was changed to have 4 known classes and 4 unknown classes, and each test set was changed to have 10 known and 5 unknown classes. FAR and FRR values for fusion on each classification algorithm for the initial 3 minute window analysis and re-balanced sets are shown in Table 4.5.
With the re-balanced training and tests sets, authentication testing yielded a lower FAR value of 8.67%. However, it raised the FRR to 32.67% and therefore causes too much of an adverse effect on usability to be viable. This negative effect on the FRR is most likely due
Table 4.5: 3 Minute Window Authentication Comparison Results.
Authentication (FAR & FRR) %
Fusion 3 Minute Window Fusion 5 Minute Window
BayesNet FAR 8.67% 9.67% FRR 32.67% 2.00% J48 FAR 16.67% 25.33% FRR 28.00% 1.00% LibSVM FAR 32.67% 31.33% FRR 58.67% 6.33%
to poor balancing of data in training and test sets. However, other combinations of training and test sets did not provide any better results.
4.4 Summary
Feature fusion improves the accuracy, FAR, and FRR over the individual modalities. Several conclusions can be made from the experimental results. Overall, the BayesNet classification algorithm provided the most consistent and accurate results compared to the J48 and LibSVM algorithms. Of the individual modalities, touch features provided the most accurate results for both user identification and authentication rates.
Some of the issues encountered during testing were specifically focused on the inconsistent results from the LibSVM classification algorithm. These issues indicate a potential problem with data collection and feature generation, which may interfere with the algorithm.
Also, the lack of gyroscope and accelerometer data within the sensor modality was due to lack of implementation (ability to create valid features), and not weakness of sensor data as a means for classification. Additionally, the lack of test data also may have skewed
results, because only five participants were available for the experimental study. Time also played an important factor limiting total number of slices available for testing.
The data collection from this research represents a more realistic picture of how a user will operate a smartphone compared to the related works referenced. When using sensor data, Miguel, et al. [21] and Nickel [29] had users walk with a device at a fixed point on their belt. Bo, et al. [11] captured touch data from only performing one task on the device. Xuan, et al. [23] only captured data from users entering passwords. The related work, which only examines data captured data from best case scenarios and repetitive tasks, while this effort asked participants to perform a wide range of tasks in order to simulate normal user activity. This difference in data collection makes introduces much difficulty in comparing the results of each study.
As stated at the beginning of this chapter, the main goals of this work are to present a behavioral biometric authentication system and determine if feature fusion provides better results than each modality individually. From the results of this study, it can be stated that feature fusion did indeed provide better results than each individual modality. With reasonable best case FAR and FRR values of 9.67% and 2% using the BayesNet algorithm, the combination of features is a promising possibility in the search for an effective authentication system on mobile devices. With additional testing in conjunction with some of the improvements discussed in the following chapter, multi-modal fusion has the potential to achieve FAR and FRR values even lower than the results observed here.
V. Conclusion
Current mobile devices are protected by simple authentication mechanisms, such as a PIN or draw-and-lock pattern. These mechanisms are insecure and easily thwarted by a malicious observer [10]. Additionally, mobile device authentication does not address the situation of when the device is compromised after it is already unlocked, such as being stolen or handed to another person to view a picture. Active authentication can solve these issues. Behavioral biometrics potentially provides a non-intrusive way of providing active authentication that would not severely impact usability. Specifically, mobile devices touch screen actions and gestures, keyboard and button input, and sensors are all easily available data sources for accomplishing behavioral biometrics on mobile devices.
Unfortunately, currently available methods for active authentication would negatively impact usability of a mobile device. To not impact usability low FAR and FRR values less than 2%, would maintain authentication with minimal requests for the user to manually authenticate
5.1 Final Thoughts
Previous research into mobile device behavioral biometrics has been done with touch, keyboard, and sensors. However, work has not been performed on the fusion of these modalities for active authentication. Five users performed a prescribed set of ordinary mobile device actions to capture data used for testing. Data was captured with a variety of methods, such as grabbing raw data directly from device drivers, hooking into the Java framework, and logging data from particular application on the device. From the data collected features were created for use with a set of three distinct classification algorithms (BayesNet, J48, LibSVM) to determine identification and authentication rates.
The results show that feature fusion provided statistically better results than the individual modalities for both identification and authentication. The BayesNet classification algorithm provided the most consistent and accurate results for this study. Feature fusion with BayesNet achieved a 97.91% identification rate, with FAR and FRR values of 9.67% and 2% respectively. Although these results are not the best of prior research the study was limited with only five test subjects thus yielded limited experimental data and results.
The system presents a new approach to behavioral biometrics on mobile devices, by capturing data from a broader range of inputs to better classify the user for authentication.
5.2 Future Work
The endgame for this research is to produce a cross-platform active authentication system that will provide extremely low FAR and FRR values. The rest of this section outlines some of future work that would be needed accomplish this task.
The FAR and FRR values of the current proof of concept are not low enough for a production system. More testing, with a larger pool of users, on a more complex and all-inclusive set of prescribed actions needs to be done to first determine statistically stronger results. Also, within classification decisions each feature needs to be examined in order to determine relevance and whether each decision must be reevaluated.
Missing sensor features need to be addressed as well, to potentially yield better acceptance rates. For the sensor features to be implemented, issues with the high variability of raw un-calibrated gyroscope data must be addressed. Also, issues involving access to the gyroscope as a sensor type occurred in this study and were unresolved when attempting to use the Java framework to capture sensor data. With the gyroscope data captured and used for classification, three dimensional position data would allow the classification algorithm to determine how the user holds the phone. Another sensor left untapped for this endeavor was the accelerometer. Constant polling of the accelerometer is mostly useless for active
authentication because normal use does not revolve around any sudden and deterministic movements that would identify a user. However, if implemented to create features from only accelerometer data for a 3 second window before the screen is turned on, data gathered would identify the directional force at which a user brings the phone out from a pocket, purse, belt clip, or other storage location.
Secondary effects testing would also be extremely beneficial when implementing a production system. An example of secondary effects would be the effects that monitoring and polling sensors have on battery consumption. Also, it would be advantageous to determine what is the best method to deal with authentication failure such as a PIN or specific behavioral sequence.
If the aforementioned work were accomplished, the current system would still be confined to a specific device and not easily converted across mobile devices and platforms. To accomplish a greater range of device capability, research must be done to see if other methods just as effective at capturing features directly hooked from device drivers. For a viable cross platform system, hooking device specific drivers is unreasonable.
The use of a multi-modal authentication mechanism could potentially result in a finished product that would allow smartphone users the security to protect their personal information stored on their devices without compromising usability of the device that has become and integral part of daily life in modern society.