3099(18)30685-6
Downloaded from:
http://researchonline.lshtm.ac.uk/id/eprint/4654568/
DOI:
https://doi.org/10.1016/S1473-3099(18)30685-6
Usage Guidelines:
Please refer to usage guidelines at
https://researchonline.lshtm.ac.uk/policies.html
or alternatively
contact
researchonline@lshtm.ac.uk.
The global burden of typhoid and paratyphoid fevers:
a systematic analysis for the Global Burden of
Disease Study 2017
GBD 2017 Typhoid and Paratyphoid Collaborators*
Summary
Background Efforts to quantify the global burden of enteric fever are valuable for understanding the health lost and the large-scale spatial distribution of the disease. We present the estimates of typhoid and paratyphoid fever burden from the Global Burden of Diseases, Injuries, and Risk Factors Study (GBD) 2017, and the approach taken to produce them.
Methods For this systematic analysis we broke down the relative contributions of typhoid and paratyphoid fevers by country, year, and age, and analysed trends in incidence and mortality. We modelled the combined incidence of typhoid and paratyphoid fevers and split these total cases proportionally between typhoid and paratyphoid fevers using aetiological proportion models. We estimated deaths using vital registration data for countries with sufficiently high data completeness and using a natural history approach for other locations. We also estimated disability-adjusted life-years (DALYs) for typhoid and paratyphoid fevers.
Findings Globally, 14·3 million (95% uncertainty interval [UI] 12·5–16·3) cases of typhoid and paratyphoid fevers occurred in 2017, a 44·6% (42·2–47·0) decline from 25·9 million (22·0–29·9) in 1990. Age-standardised incidence rates declined by 54·9% (53·4–56·5), from 439·2 (376·7–507·7) per 100 000 person-years in 1990, to 197·8 (172·0–226·2) per 100 000 person-years in 2017. In 2017, Salmonella enterica serotype Typhi caused 76·3% (71·8–80·5) of cases of enteric fever. We estimated a global case fatality of 0·95% (0·54–1·53) in 2017, with higher case fatality estimates among children and older adults, and among those living in lower-income countries. We therefore estimated 135·9 thousand (76·9–218·9) deaths from typhoid and paratyphoid fever globally in 2017, a 41·0% (33·6–48·3) decline from 230·5 thousand (131·2–372·6) in 1990. Overall, typhoid and paratyphoid fevers were responsible for 9·8 million (5·6–15·8) DALYs in 2017, down 43·0% (35·5–50·6) from 17·2 million (9·9–27·8) DALYs in 1990.
Interpretation Despite notable progress, typhoid and paratyphoid fevers remain major causes of disability and death, with billions of people likely to be exposed to the pathogens. Although improvements in water and sanitation remain essential, increased vaccine use (including with typhoid conjugate vaccines that are effective in infants and young children and protective for longer periods) and improved data and surveillance to inform vaccine rollout are likely to drive the greatest improvements in the global burden of the disease.
Funding Bill & Melinda Gates Foundation.
Copyright © 2019 The Author(s). Published by Elsevier Ltd. This is an Open Access article under the CC BY 4.0 license.
Introduction
Typhoid and paratyphoid fevers, collectively referred to as enteric fever, are caused by systemic infection with Salmonella enterica subspecies serovars Typhi and Paratyphi A, B, and C.1 Whereas most non-typhoidal
Salmonella spp infections typically produce diarrhoeal
illness and less commonly cause bloodstream infection, typhoid and paratyphoid infections produce primarily bacteraemic febrile illnesses, with prolonged high fever, headache, and malaise being characteristic symptoms. Without effective treatment, typhoid and paratyphoid fevers can lead to altered mental states (termed the typhoid state2), ileus, gastrointestinal bleeding,
intestinal perforation, septic shock, and death.1,3 Typhoid
and paratyphoid infections are relatively common in countries with poor water supply and sanitation, especially south Asia, southeast Asia, and sub-Saharan Africa, where they are a major cause of death and disability, especially among children.4–7
With growing antimicrobial resistance, and intensifying conversations around typhoid vaccine policy, accurate and detailed estimates of enteric fever burden are required.8 The Strategic Advisory Group of Experts
(SAGE) of WHO convened in October, 2017, and recommended the use of typhoid conjugate vaccines in children between 6 months and 2 years of age, with a catch-up campaign for children up to 15 years of age, where possible, and WHO pre qualified the first typhoid
Lancet Infect Dis 2019;
19: 369–81
Published Online
February 18, 2019 http://dx.doi.org/10.1016/ S1473-3099(18)30685-6 See Comment page 340 *Collaborators are listed at the end of the Article Correspondence to: Dr Jeffrey D Stanaway, University of Washington Institute for Health Metrics and Evaluation, Seattle, WA 98121, USA
conjugate vaccine in December, 2017.8 These de-
velopments give typhoid-endemic, low-income countries priority access and funding for the vaccine and could make vaccines increasingly accessible. However, data to support their introduction remain sparse.9
Efforts to quantify the global burden of enteric fever have produced estimates ranging from 11·9 million to 27·1 million cases per year.5–7,10,11 These estimates are
invaluable in understanding the health lost to enteric fever and in clarifying the large-scale spatial distribution of the disease. However, none of these studies produced country-level estimates separately for typhoid and paratyphoid fevers. Moreover, most studies have previously assumed a uniform case fatality of 1%5,6,12 and
none has investigated the effects of age or income on case fatality. Finally, most studies have developed point estimates rather than trends.
With each iteration of the Global Burden of Diseases, Injuries, and Risk Factors Study (GBD),13–16 we have
improved our estimation methods and acquired additional data that have allowed us to address some of the shortcomings of previous enteric fever estimates. Here, we present estimates of the typhoid and paratyphoid fever burden from GBD 2017, separately and collectively, by country, year, age, and sex. In addition to estimating incidence and mortality, we present estimates of three health gap metrics: years of life lost (YLLs) to premature mortality, years lived with dis ability (YLDs), and disability-adjusted life-years (DALYs).
Methods
Overview
For this systematic analysis we modelled the combined incidence of typhoid and paratyphoid infections. We then modelled the proportion of this combined incidence that was attributable to typhoid fever and the proportion attributable to paratyphoid fever, and split total cases proportionally between the two. We estimated deaths using an ensemble model of vital registration data for locations with rich vital registration data and using a natural history approach for other locations. For the natural history model, we modelled case fatality by age and national income category and estimated deaths as the product of cases and case fatality. To propagate uncertainty through the modelling chain, we used posterior simulation, estimating 1000 draws from the posterior distribution of each estimate, and doing all calculations at the draw level. The code used in this analysis is available online.
Incidence model
We estimated the total incidence of typhoid and para- typhoid fevers from hybridised estimates of two models: a model of moderate and high-burden super-regions (incidence ≥10 per 100 000) based on only incidence data; and a model of low-burden super-regions (incidence <10 per 100 000) including both incidence data and estimates of incidence derived from vital registration sources (appendix pp 5–6). Incidence data were from population-based cohort studies and national surveillance
For the code used in the
analysis see http://ghdx.
healthdata.org/gbd-2017/code
See Online for appendix
Research in context Evidence before this study
We searched PubMed for “(“typhoid” OR “paratyphoid” OR “typhi” OR “paratyphi”) AND (“burden” OR “estimates” OR “model”)”, with no restrictions placed on date of publication or language. We identified global (or near-global) estimates of enteric fever incidence, ranging from 12 million to 27 million cases annually. Estimates of mortality ranged from 129 000 to 223 000 deaths. Most previous studies assumed a case fatality of 1%, whereas one study estimated a case fatality range of 0·4% to 2·1%. Only previous iterations of the Global Burden of Diseases, Injuries, and Risk Factors Study (GBD) have reported estimates of temporal trends and health gap metrics for typhoid and paratyphoid fevers separately.
Added value of this study
We present estimates of the global burden of typhoid and paratyphoid fevers from GBD 2017, separately and collectively, by country, year, age, and sex. To our knowledge, this is the first study to provide estimates of typhoid and paratyphoid fever incidence, mortality, years of life lost (YLLs) to premature mortality, years lived with disability (YLDs), and disability-adjusted life-years (DALYs) at country, regional, and global levels, and the first study to provide global estimates of
enteric fever trends. As such, we believe this analysis to be the most comprehensive picture of the burden of enteric fever to date. Trend estimates offer important information about the changing burden of the disease. Estimates of health gap metrics, which account for disease severity and give greater weight to deaths occurring at younger ages, allow for comparisons between diseases of differing severity and give policy makers the information required to set objective priorities.
Implications of all the available evidence
Growing antimicrobial resistance and national decision making about typhoid vaccine use heighten the need for accurate and detailed estimates of the global enteric fever burden. Our estimates, showing a decline in the number of typhoid and paratyphoid illnesses globally, from 25·9 million in 1990 to 14·3 million in 2017, are similar to previously published estimates that have ranged from about 12 million to 27 million. Still, the wide uncertainty around estimates and large differences in region-level estimates reflect the paucity of data and highlight the need for more widespread active surveillance of enteric fever. As countries move forward with vaccine roll-out, better data and better surveillance should be a priority.
systems. The systemic review, data availability maps, and all included sources are listed in the appendix (pp 3–4, 14, and 54–93). We excluded studies that reported data with the Widal test, given the unreliable performance characteristics of this diagnostic method. We assumed two major sources of under-reporting: first, imperfect blood culture sensitivity resulting in missed cases among those who were tested; and, second, incompleteness of data from passive national surveillance sources. We estimated blood culture sensitivity as 55% (95% CI 39–71)17–19 and adjusted reported case estimates by
dividing by sensitivity, using posterior simulation to incorporate uncertainty from the sensitivity adjustment.
We modelled incidence using the Bayesian meta-regression tool DisMod-MR, which has been described elsewhere.20 DisMod-MR uses non-linear mixed-effects
models to produce estimates by age, sex, year, and location. It uses age integration to accommodate data with disparate age categorisation schemes. Country-level covariates help inform estimates where data are sparse. The tool uses a Bayesian cascading geographical hierarchy to ensure that estimates have a strong spatial structure and to allow extrapolations to countries with no data. In addition to country-level covariates, DisMod accepts study-level covariates that allow data to be adjusted to account for known sources of bias and heterogeneity.
The incidence model used two country-level covariates. The first was the summary exposure value for unsafe water, which is a metric of the risk-weighted prevalence of exposure to unsafe water, weighted by the type of water supply,21 included because poor access to safe drinking
water is a known risk factor for typhoid fever. The second was the proportion of the population living in the classic Indian Ocean monsoon belt,22 which was included both
because typhoid fever incidence increases following monsoons23 and to prevent un reasonably high estimates
in countries that have poor access to improved water supply but lie outside high-incidence regions, and for which few data are available (primarily countries in sub-Saharan Africa). These covariates were selected on the basis of disease epidemiology, the significance of their association with incidence (p<0·05), and non-collinearity (eg, sanitation was not included as a covariate because of its high collinearity with unsafe water). We used a study-level covariate identifying datapoints from passive national surveillance systems. We indicated active surveillance as the reference category and allowed DisMod-MR to adjust reported incidence rates from passive national surveillance sources to their expected values under the counterfactual scenario that they had been recorded via active surveillance (see appendix p 3 for details).
Aetiology models
We estimated the aetiological breakdown of the typhoid– paratyphoid fever envelope using data from national surveillance, population-based cohort studies, and vital registration sources (appendix pp 59–60). Although
studies typically classify cases as being typhoid or paratyphoid fever, sources rarely differentiate between Paratyphi A, B, and C. We assume, but cannot confirm, that Paratyphi A is the primary paratyphoid serovar. We used two DisMod-MR models: one for the proportion of the total cases caused by typhoid fever, and a second for the proportion of cases caused by paratyphoid fever. We rescaled each proportion estimate to ensure that the proportions due to typhoid and paratyphoid fever always summed to one. For each age-sex-year-location, and for each draw, the incidence of typhoid fever was calculated as the product of total incidence and the proportion of that total from typhoid fever; and the incidence of paratyphoid fever was calcu lated as the product of the total incidence and proportion of that total due to paratyphoid fever. Case fatality model
We modelled case fatality using notifiable disease and hospital data sources that reported both cases and deaths (see the appendix pp 90–93 for the full source list). We excluded sources that reported case fatality estimates from out breaks as these estimates tend to be notably higher than those reported under the endemic conditions in which most cases occur. The scarcity of case fatality data and the small number of sources reporting age-specific case fatality precluded the use of a single model to estimate case fatality by country, age, and year. Instead, we first used the age-integration abilities of DisMod-MR using only age-specific data to estimate a global age pattern. Second, we did a meta-analysis of mean all-age case fatality data for three income groups: high-income countries (World Bank “high income, OECD” and “high income, non-OECD” countries), upper-middle-income countries (equivalent to the World Bank classification), and low-income countries (World Bank “low-income” and “lower-middle income” countries).24 We then applied the
global age pattern to the mean case fatality estimates for each income category to derive age-specific case fatality estimates for each of the three income categories. We estimated the relative risk of fatality among typhoid fever cases compared with paratyphoid fever cases using a single large dataset that reported case fatality separately for typhoid and paratyphoid fevers.25 Finally, we applied
this relative risk to our overall case fatality estimate to derive separate estimates of case fatality for typhoid and paratyphoid fevers. As with our estimates of incidence, we used posterior simulation to incorporate uncertainty from the average case fatality, age-pattern, and the relative fatality of typhoid and paratyphoid fevers (see appendix pp 9–10 for details).
Mortality estimation
GBD uses a star-rating system from zero to five to represent the quality and completeness of cause of death (CoD) data, primarily vital registration data, for each location, during the GBD estimation period.26 For
Cases Deaths YLLs YLDs DALYs Paratyphoid fever only
1990 5508 (4233–7086) 28·5 (12·7–56·7) 2071 (913–4172) 15·0 (9·4–22·6) 2086 (923–4199) 1995 5139 (3963–6543) 27·3 (12·4–53·8) 1977 (888–3912) 14·0 (8·8–21·0) 1991 (897–3931) 2000 4698 (3640–5953) 25·2 (11·5–49·9) 1817 (835–3600) 12·9 (8·1–19·5) 1830 (845–3619) 2005 4232 (3311–5327) 23·0 (10·5–45·3) 1649 (756–3259) 11·6 (7·3–17·3) 1661 (762–3274) 2010 3794 (2992–4739) 20·9 (9·5–40·6) 1477 (670–2862) 10·4 (6·7–15·5) 1487 (679–2881) 2017 3397 (2666–4184) 19·1 (8·7–37·3) 1354 (622–2620) 9·4 (5·9–13·9) 1364 (631–2641) Typhoid fever only
1990 20 366 (17 117–23 882) 202·0 (112·5–327·1) 14 954 (8330–24 474) 192·7 (128·8–277·2) 15 147 (8493–24 777) 1995 18 424 (15 562–21 584) 185·4 (104·2–302·6) 13 693 (7658–22 281) 174·9 (117·9–254·6) 13 868 (7801–22 501) 2000 16 797 (14 229–19 550) 171·6 (96·6–278·9) 12 598 (7138–20 572) 160·0 (108·1–227·6) 12 758 (7280–20 723) 2005 15 415 (13 131–17 894) 160·2 (89·8–262·9) 11 712 (6582–19 081) 147·3 (97·6–213·2) 11 860 (6694–19 317) 2010 13 769 (11 739–15 938) 145·4 (80·9–236·0) 10 556 (5902–17 048) 132·2 (88·3–188·4) 10 688 (6028–17 188) 2017 10 924 (9343–12 597) 116·8 (65·4–187·7) 8332 (4632–13 419) 105·5 (70·3–151·0) 8437 (4731–13 577) Typhoid and paratyphoid fevers combined
1990 25 875 (22 073–29 915) 230·5 (131·2–372·6) 17 026 (9768–27 546) 207·7(140·0–299·2) 17 233 (9931–27 789) 1995 23 563 (20 198–27 338) 212·7 (120·8–341·5) 15 671 (8845–25 182) 189·0 (127·6–273·5) 15 860 (9016–25 474) 2000 21 495 (18 521–24 788) 196·8 (113·0–315·9) 14 415 (8329–23 159) 172·8 (117·1–245·0) 14 588 (8422–23 327) 2005 19 648 (16 992–22 576) 183·2 (104·6–293·4) 13 362 (7649–21 673) 158·9 (106·0–229·1) 13 521 (7780–21 847) 2010 17 564 (15 295–20 086) 166·3 (95·2–264·5) 12 033 (6907–19 424) 142·7 (95·4–202·7) 12 175 (7033–19 654) 2017 14 321 (12 540–16 337) 135·9 (76·9–218·9) 9686 (5485–15 746) 114·9 (77·7–164·2) 9801 (5569–15 880)
95% uncertainty intervals are included in parentheses. YLL=years of life lost. YLD=years lived with disability. DALY=disability-adjusted life-years.
Table 1: Global numbers of cases, deaths, years of life lost, years lived with disability, and disability-adjusted life-years (in thousands) by year for typhoid and paratyphoid fevers
Figure 1: Incidence rates (per 100 000) of typhoid and paratyphoid fevers, by country, in 2017
Unfilled locations are those for which GBD does not produce estimates. The inset maps detail smaller locations. ATG=Antigua and Barbuda. FSM=Federated States of Micronesia. GBD=Global Burden of Diseases, Injuries, and Risk Factors Study. Isl=Islands. LCA=Saint Lucia. TLS=Timor-Leste. TTO=Trinidad and Tobago. VCT=Saint Vincent and the Grenadines.
Persian Gulf Caribbean LCA Dominica ATG TTO Grenada VCT TLS Maldives Barbados Seychelles Mauritius Comoros
West Africa Eastern Mediterranean
Malta
Singapore Balkan Peninsula Tonga Samoa FSM Fiji Solomon Isl Marshall Isl Vanuatu Kiribati 0 to <15 15 to <50 50 to <100 100 to <200 200 to <500 500 to 700
pp 10–11 for details), we estimated deaths directly from vital registration data using the CoD ensemble modelling (CODEm) tool, which has been described elsewhere.26
Briefly, CODEm estimates a set of plausible submodels, tests each for out-of-sample predictive validity, and
produces final estimates from an ensemble derived from weighted combinations of submodels. For locations with lower than four-star CoD data, we considered the data insufficiently complete and used a natural history approach in which we estimated typhoid fever mortality
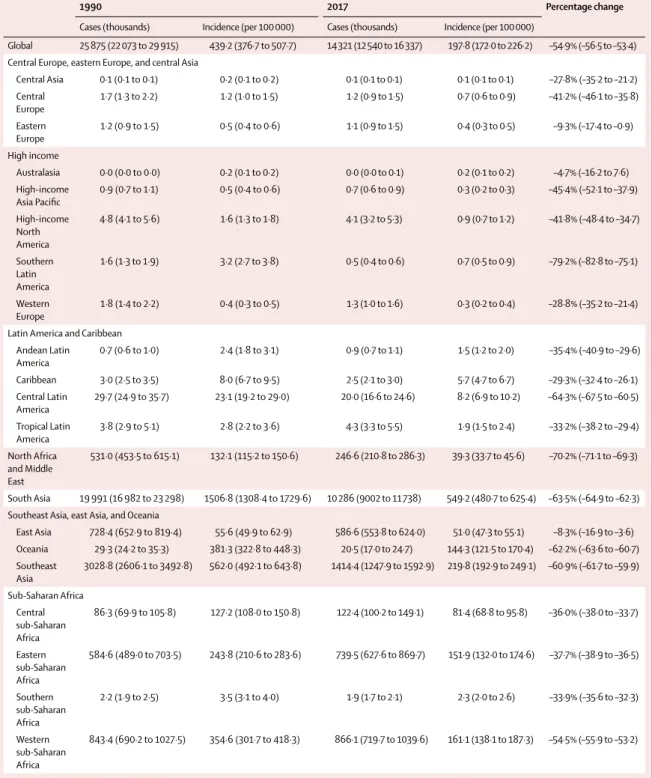
1990 2017 Percentage change
Cases (thousands) Incidence (per 100 000) Cases (thousands) Incidence (per 100 000)
Global 25 875 (22 073 to 29 915) 439·2 (376·7 to 507·7) 14 321 (12 540 to 16 337) 197·8 (172·0 to 226·2) –54·9% (–56·5 to –53·4) Central Europe, eastern Europe, and central Asia
Central Asia 0·1 (0·1 to 0·1) 0·2 (0·1 to 0·2) 0·1 (0·1 to 0·1) 0·1 (0·1 to 0·1) –27·8% (–35·2 to –21·2) Central Europe 1·7 (1·3 to 2·2) 1·2 (1·0 to 1·5) 1·2 (0·9 to 1·5) 0·7 (0·6 to 0·9) –41·2% (–46·1 to –35·8) Eastern Europe 1·2 (0·9 to 1·5) 0·5 (0·4 to 0·6) 1·1 (0·9 to 1·5) 0·4 (0·3 to 0·5) –9·3% (–17·4 to –0·9) High income Australasia 0·0 (0·0 to 0·0) 0·2 (0·1 to 0·2) 0·0 (0·0 to 0·1) 0·2 (0·1 to 0·2) –4·7% (–16·2 to 7·6) High-income Asia Pacific 0·9 (0·7 to 1·1) 0·5 (0·4 to 0·6) 0·7 (0·6 to 0·9) 0·3 (0·2 to 0·3) –45·4% (–52·1 to –37·9) High-income North America 4·8 (4·1 to 5·6) 1·6 (1·3 to 1·8) 4·1 (3·2 to 5·3) 0·9 (0·7 to 1·2) –41·8% (–48·4 to –34·7) Southern Latin America 1·6 (1·3 to 1·9) 3·2 (2·7 to 3·8) 0·5 (0·4 to 0·6) 0·7 (0·5 to 0·9) –79·2% (–82·8 to –75·1) Western Europe 1·8 (1·4 to 2·2) 0·4 (0·3 to 0·5) 1·3 (1·0 to 1·6) 0·3 (0·2 to 0·4) –28·8% (–35·2 to –21·4) Latin America and Caribbean
Andean Latin America 0·7 (0·6 to 1·0) 2·4 (1·8 to 3·1) 0·9 (0·7 to 1·1) 1·5 (1·2 to 2·0) –35·4% (–40·9 to –29·6) Caribbean 3·0 (2·5 to 3·5) 8·0 (6·7 to 9·5) 2·5 (2·1 to 3·0) 5·7 (4·7 to 6·7) –29·3% (–32·4 to –26·1) Central Latin America 29·7 (24·9 to 35·7) 23·1 (19·2 to 29·0) 20·0 (16·6 to 24·6) 8·2 (6·9 to 10·2) –64·3% (–67·5 to –60·5) Tropical Latin America 3·8 (2·9 to 5·1) 2·8 (2·2 to 3·6) 4·3 (3·3 to 5·5) 1·9 (1·5 to 2·4) –33·2% (–38·2 to –29·4) North Africa and Middle East 531·0 (453·5 to 615·1) 132·1 (115·2 to 150·6) 246·6 (210·8 to 286·3) 39·3 (33·7 to 45·6) –70·2% (–71·1 to –69·3) South Asia 19 991 (16 982 to 23 298) 1506·8 (1308·4 to 1729·6) 10 286 (9002 to 11 738) 549·2 (480·7 to 625·4) –63·5% (–64·9 to –62·3) Southeast Asia, east Asia, and Oceania
East Asia 728·4 (652·9 to 819·4) 55·6 (49·9 to 62·9) 586·6 (553·8 to 624·0) 51·0 (47·3 to 55·1) –8·3% (–16·9 to –3·6) Oceania 29·3 (24·2 to 35·3) 381·3 (322·8 to 448·3) 20·5 (17·0 to 24·7) 144·3 (121·5 to 170·4) –62·2% (–63·6 to –60·7) Southeast Asia 3028·8 (2606·1 to 3492·8) 562·0 (492·1 to 643·8) 1414·4 (1247·9 to 1592·9) 219·8 (192·9 to 249·1) –60·9% (–61·7 to –59·9) Sub-Saharan Africa Central sub-Saharan Africa 86·3 (69·9 to 105·8) 127·2 (108·0 to 150·8) 122·4 (100·2 to 149·1) 81·4 (68·8 to 95·8) –36·0% (–38·0 to –33·7) Eastern sub-Saharan Africa 584·6 (489·0 to 703·5) 243·8 (210·6 to 283·6) 739·5 (627·6 to 869·7) 151·9 (132·0 to 174·6) –37·7% (–38·9 to –36·5) Southern sub-Saharan Africa 2·2 (1·9 to 2·5) 3·5 (3·1 to 4·0) 1·9 (1·7 to 2·1) 2·3 (2·0 to 2·6) –33·9% (–35·6 to –32·3) Western sub-Saharan Africa 843·4 (690·2 to 1027·5) 354·6 (301·7 to 418·3) 866·1 (719·7 to 1039·6) 161·1 (138·1 to 187·3) –54·5% (–55·9 to –53·2)
95% uncertainty intervals are included in parentheses. GBD regions are detailed in the appendix. GBD=Global Burden of Diseases, Injuries, and Risk Factors Study.
Table 2: Typhoid and paratyphoid fevers and age-standardised incidence rates by GBD region, for 1990 and 2017, and the percentage change in age-standardised incidence rates between 1990 and 2017
as the product of typhoid fever incidence and case fatality. We estimated paratyphoid fever mortality as the product of paratyphoid fever incidence and case fatality. One funda mental principle of GBD is that the sum of all cause-specific mortality estimates should equal all-cause mortality within each age, sex, year, and location. We impose this consistency through CoDCorrect, a process in which we rescale cause-specific mortality estimates to fit the all-cause mortality envelope.26
Estimation of health gap metrics
We estimated three health gap metrics: YLLs, which quantify fatal health loss according to a reference life expectancy at the age of death (ie, deaths at younger ages result in more YLLs); YLDs, which quantify non-fatal health loss accounting for both the duration and severity of a condition; and DALYs, which are the sum of YLLs and YLDs, and quantify fatal and non-fatal health loss combined. YLLs were calculated with methods described previously.26
To calculate YLDs, we assigned cases proportionally across different sequelae, each with an associated duration and disability weight. We split typhoid fever cases between four sequelae: moderate typhoid fever, severe un complicated typhoid fever, severe typhoid fever with gastro intestinal bleeding, and severe typhoid fever with other complications (including, but not limited to, intes tinal perforation).27
Paratyphoid fever cases were split between mild paratyphoid fever, moderate paratyphoid fever, severe paratyphoid fever, and paratyphoid fever with abdominal complications. Each sequela was assigned the disability of the most closely matching health state from the 235 health states in GBD 2017.4 We assumed the duration of illness was 14 days
(95% UI7–21) for mild or moderate sequelae, and 28 days (14–49) with severe or complicated sequelae.28–31 YLDs from
a given sequela were calculated as the product of the number of incident cases of that sequela, its duration in years, and the corresponding disability weight. Total YLDs for typhoid fever were calculated as the sum of the YLDs from each of its four sequelae, and total YLDs for
Cases (thousands) Deaths
Typhoid fever Paratyphoid fever Percentage
typhoid fever Typhoid fever Paratyphoid fever Percentage typhoid fever Global 10 924·3 (9343·0–12 597·1) 3396·9 (2666·5–4184·1) 76·3% (71·8–80·5) 116 815 (65 421–187 652) 19 108 (8706–37 332) 85·9% (77·7–91·9) Central Europe, eastern Europe, and central Asia
Central Asia 0·1 (0·1–0·1) 0·0 (0·0–0·0) 81·0% (75·9–86·0) 1 (1–1) 1 (0–3) 48·9% (22·2–87·2)
Central Europe 0·1 (0·1–0·1) 1·1 (0·8–1·4) 9·3% (7·8–11·2) 2 (1–4) 1 (1–2) 62·6% (47·0–80·1)
Eastern Europe 0·6 (0·4–0·8) 0·5 (0·4–0·7) 52·7% (47·6–58·2) 1 (0–1) 1 (0–1) 41·8% (27·0–62·7)
High income
Australasia 0·0 (0·0–0·0) 0·0 (0·0–0·1) 13·3% (10·5–16·5) 0 (0–0) 0 (0–0) 39·2% (14·0–58·2)
High-income Asia Pacific 0·1 (0·1–0·1) 0·6 (0·5–0·8) 14·5% (12·6–16·6) 0 (0–1) 1 (0–2) 34·1% (18·0–73·8) High-income North
America 0·6 (0·4–0·8) 3·5 (2·8–4·6) 14·3% (12·6–16·3) 0 (0–1) 2 (1–7) 18·6% (6·2–30·5)
Southern Latin America 0·2 (0·1–0·3) 0·3 (0·2–0·4) 41·1% (34·6–47·6) 3 (2–6) 0 (0–0) 97·7% (92·8–99·0)
Western Europe 0·1 (0·1–0·2) 1·1 (0·9–1·4) 11·5% (9·0–14·4) 12 (7–16) 2 (0–4) 84·3% (77·1–96·4)
Latin America and Caribbean
Andean Latin America 0·9 (0·7–1·1) 0·0 (0·0–0·0) 97·8% (97·0–98·5) 7 (3–13) 0 (0–0) 98·8% (97·8–99·4)
Caribbean 0·9 (0·7–1·2) 1·6 (1·3–1·9) 37·7% (31·7–44·3) 11 (5–20) 9 (4–17) 56·3% (40·7–70·4)
Central Latin America 19·3 (16·0–23·7) 0·7 (0·6–1·0) 96·4% (95·6–97·0) 97 (59–249) 1 (1–5) 98·3% (94·3–99·6) Tropical Latin America 4·2 (3·3–5·4) 0·1 (0·1–0·1) 97·6% (96·8–98·3) 30 (14–54) 0 (0–1) 98·7% (97·6–99·3) North Africa and Middle East 239·4 (205·0–277·5) 7·2 (5·0–10·3) 97·1% (96·0–97·9) 2 731 (1458–4752) 43 (17–94) 98·4% (97·2–99·2) South Asia 7478·0 (6350·9–8665·0) 2808·3 (2194·4–3478·8) 72·7% (67·4–77·7) 78 892 (44 214–125 372) 15 773 (7319–30 611) 83·4% (73·9–90·3) Southeast Asia, east Asia, and Oceania
East Asia 378·3 (342·9–416·2) 208·3 (177·7–241·2) 64·5% (59·4–69·4) 2845 (1416–4991) 858 (361–1702) 76·9% (65·3–86·0)
Oceania 16·2 (13·3–19·5) 4·3 (3·1–5·8) 79·0% (74·0–83·6) 195 (100–350) 29 (12–60) 87·2% (79·4–92·9)
Southeast Asia 1284·6 (1132·7–1448·2) 129·8 (98·4–167·5) 90·8% (88·5–92·7) 12 090 (6822–19 869) 705 (305–1405) 94·5% (90·4–97·0) Sub-Saharan Africa
Central sub-Saharan Africa 119·2 (97·2–145·1) 3·2 (2·1–4·6) 97·4% (96·5–98·2) 1236 (634–2188) 18 (7–41) 98·5% (97·4–99·2) Eastern sub-Saharan Africa 726·4 (615·6–856·5) 13·1 (9·4–18·1) 98·2% (97·6–98·7) 9893 (5240–16 866) 93 (38–184) 99·1% (98·3–99·5) Southern sub-Saharan
Africa 1·7 (1·5–2·0) 0·1 (0·1–0·2) 92·2% (90·1–94·0) 18 (10–32) 1 (0–2) 95·5% (92·3–97·6)
Western sub-Saharan Africa 653·2 (534·8–794·0) 212·9 (158·2–278·3) 75·4% (70·2–80·0) 8751 (4481–15 514) 1568 (640–3306) 84·8% (76·2–91·4)
95% uncertainty intervals are included in parentheses. GBD=Global Burden of Diseases, Injuries, and Risk Factors Study.
paratyphoid fever were calculated as the sum of the YLDs from each of its four sequelae. Finally, we adjusted YLDs through a comorbidity correction that ensures that comorbidities cannot result in an aggregate disability weight greater than one (equivalent to death).4
Role of the funding source
AKMZ, an employee of the funder of this study, helped acquire data and provided feedback and edits on the manuscript. The sponsor of this study had no other role in study design, data collection, data analysis, data interpretation, or writing of the report. The corresponding author had full access to all the data in the study and had final responsibility for the decision to submit for publication.
Results
We estimate that 14·3 million (95% uncertainty interval [UI] 12·5–16·3) cases of typhoid and paratyphoid fevers occurred globally in 2017, a 44·6% (42·2–47·0) decline from 25·9 million (22·1–29·9) cases in 1990 (table 1). Age-standardised incidence rates declined by 54·9% (53·4–56·5), from 439·2 (376·7–507·7) per 100 000 person-years in 1990 to 197·8 (172·0–226·2) per 100 000 person-years in 2017. Comparing GBD super-regions, south Asia had the highest age-standardised incidence rate (549 [481–625] cases per 100 000 person-years) and the largest number of cases (10·3 million [9·0–11·7]), accounting for 71·8% of global cases in 2017. The southeast Asia, east Asia, and Oceania super-region accounted for 14·1% of global cases (2·02 million [1·82–2·23]), and the sub-Saharan Africa super-region accounted for 12·1% (1·73 million [1·45–2·06];figure 1, table 2). Of all cases globally, 76·3% (71·8–80·5) were attributable to S Typhi (table 3). Thus, in 2017, we estimate that there were 10·9 million (9·3–12·6) cases of typhoid fever and 3·4 million (2.7–4·2) cases of paratyphoid fever globally (table 3).
Incidence rates were highest among children, peaking in the 5–9-year age group and declining steadily into adulthood (figure 2). In 2017, 12·6% (8·7–17·7) of cases occurred among children younger than 5 years, and 55·9% (50·3–61·6) occurred among children younger than 15 years of age (appendix pp 15–16). We found differing age patterns in high-incidence and low-incidence regions, with incidence concentrated among children in high-incidence regions, and distributed more broadly across age groups in low-incidence regions (appendix p 17). 56·3% (51·8–61·2) of cases occurred among males.
Mean all-age global case fatality was 0·95% (0·54–1·53), with higher case fatality estimates among children and older adults, and among those living in lower-income countries (appendix pp 22–25). Case fatality for typhoid fever was 1·89 times (1·09–3·28) that for paratyphoid fever. Cause, age, and income-specific case fatality estimates for paratyphoid fever ranged from a low of 0·3% (0·1–0·8) among adults in high-income countries
to a high of 0·9% (0·4–1·9) among post-neonates (28–364 days) in lower-income countries; and those for typhoid fever ranged from 0·6% (0·2–1·3) among adults in high-income countries to 1·6% (0·8–3·0) among post-neonates in lower-income countries (appendix p 25).
We estimated 135·9 thousand (76·9–218·9) deaths from typhoid and paratyphoid fever globally in 2017, a 41·0% (33·6–48·3) decline from 230·5 thousand (131·2–372·6) in 1990 (table 1). As with cases, south Asia had the highest mortality rates and highest absolute number of deaths, accounting for 69·6% (94·7 thousand [54·4–135·2]) of global deaths from typhoid and paratyphoid fever in 2017, followed by the sub-Saharan Africa super-region (21·6 thousand [11·3–38·1]; 15·9% of global deaths), and the southeast Asia, east Asia, and Oceania super-region (16·7 thousand [9·38–27·7]; 12·3% of global deaths; figure 3, appendix p 26). Mortality rates were highest among young children, peaking among those aged 5–9 years, and steadily declined with age (figure 4). In 2017, 17·2% (12·3–23·4) of deaths occurred among children younger than 5 years of age, and 59·3% (53·6–65·2%) occurred among children younger than 15 years of age. Of all deaths globally, 85·9% (77·7–91·9) were attributable to S Typhi, resulting in 116·8 thousand (65·4–187·7) deaths from typhoid fever and 19·1 thousand (8·7–37·3) from paratyphoid fever in 2017 (table 3). 74·0 thousand (42·1–120·1) deaths occurred among males compared with 61·9 thousand (34·7–101·4) deaths among females.
The 10·9 million cases of typhoid fever and 3·4 million cases of paratyphoid fever in 2017 resulted in 105·5 thousand (70·3–151·0) YLDs attributable to typhoid fever and 9·4 thousand (5·9–13·9) YLDs attributable to paratyphoid fever. Similarly, the 116·8 thousand deaths due to typhoid fever and 19·1 thousand deaths due to paratyphoid fever in 2017, resulted in 8·3 million Figure 2: Global age-specific incidence rates (per 100 000) of typhoid and paratyphoid fevers in 2017 0 200 400 600 800 Post neon atal1–4 5–9 10–1415–1920–2425–2930–3435–3940–4445–4950–5455–5960–6465–6970–7475–7980–8485–8990–94≥95 Age (years) Incidence (per 100 000)
(4·6–13·4) YLLs attributable to typhoid fever and 1·3 million (0·6–2·6) attributable to paratyphoid fever. Overall, typhoid and paratyphoid fever were responsible for 9·8 million (5·6–15·8) DALYs in 2017, down 43·0% (35·5–50·6) from 17·2 million (9·9–27·8) DALYs in 1990 (table 4). In 2017, 20·5% (14·8–27·5) of DALYs occurred among children younger than 5 years of age, and
67·0% (61·6–72·4) occurred among children younger than 15 years of age.In 2017, 5·35 million (3·01–8·59) DALYs occurred among males, and 4·45 million (2·52 –7·31) DALYs occurred among females.
Discussion
We present comprehensive global estimates of typhoid and paratyphoid fever by country, age, year, and sex. Our estimates show the number of typhoid and paratyphoid fever cases declining globally, from 25·9 million in 1990 to 14·3 million in 2017. Given the limited use of typhoid vaccine in typhoid-endemic countries, these declines likely reflect the broad improvements that come with economic develop ment, including infrastructure improvements (eg, water supply and sanitation), and improved food handling practices, as well increased access to antibiotic treatment.
Our global estimates of cases and deaths are com- parable to previously published estimates (appendix p 19). Crump and colleagues6 estimated that, in 2000, there were
21·7 million cases of typhoid fever (with results from a sensitivity analysis ranging from 10·8 million to 43·3 million), 5·4 million cases of paratyphoid fever, and 216 510 deaths from typhoid fever (sensitivity analysis range of 21 651 to 1·1 million). Buckle and colleagues,5 after
accounting for low diagnostic sensitivity, estimated 26·9 million (IQR18·3–35·7) cases in 2010. Mogasale and Persian Gulf Caribbean LCA Dominica ATG TTO Grenada VCT TLS Maldives Barbados Seychelles Mauritius Comoros
West Africa Eastern Mediterranean
Malta
Singapore Balkan Peninsula Tonga Samoa FSM Fiji Solomon Isl Marshall Isl Vanuatu Kiribati 0 to <1 1 to <5 5 to <10 10 to <20 20 to <40 40 to <50 50 to <80
Mortality rate (per 100 000)
Figure 3: Typhoid and paratyphoid fever mortality rates (per million), by country, in 2017
Unfilled locations are those for which GBD does not produce estimates. The inset maps detail smaller locations. ATG=Antigua and Barbuda. FSM=Federated States of Micronesia. GBD=Global Burden of Diseases, Injuries, and Risk Factors Study. Isl=Islands. LCA=Saint Lucia. TLS=Timor-Leste. TTO=Trinidad and Tobago. VCT=Saint Vincent and the Grenadines.
Figure 4: Global age-specific mortality rates (per 100 000) from typhoid and paratyphoid fevers in 2017 0 2 4 6 8 Post neon atal1–4 5–910–1415–1920–2425–2930–3435–3940–4445–4950–5455–5960–6465–6970–7475–7980–8485–8990–94≥95 Age (years) Mortality (per 100 000)
colleagues7 published two sets of estimates for low-income
and middle-income countries for 2010: first, an estimate of 11·9 million (95% CI 9·9–14·7) cases and 129 thousand (95% CI 75–208) deaths, derived from a model that included an adjustment for water-related risk at each study site; and, second, unadjusted estimates of 20·6 million (95% CI 17·5–24·2) cases and 223 thousand (95% CI 131–344) deaths. Kim and colleagues11 updated the
estimates produced by Mogasale and colleagues to include data from the Typhoid Fever Surveillance in Africa Program (TSAP), resulting in a slight upward revision to
12·1 million (95% CI 10·0–14·8) cases from the adjusted model and 20·8 million (17·8–24·2) from the unadjusted model. Finally, Antillón and colleagues10 estimated
17·8 million (95% CI 6·9–48·4) annual cases in low-income and middle-low-income countries. Our estimates differ only modestly from those that have been previously published, and our uncertainty intervals overlap with those of all previous estimates, except for the estimates adjusted for water-related risk from Mogasale and colleagues and from Kim and colleagues (appendix p 19). All previous death estimates fall within our uncertainty intervals.
YLLs YLDs DALYs
Number (thousands) Rate (per million) Number (thousands) Rate (per million) Number (thousands) Rate (per million) Global 9686·1 (5484·9–15 746·2) 1363·2 (770·0–2209·0) 114·88 (77·73–164·22) 15·87 (10·69–22·71) 9801 (5579–15 839) 1379·1 (784·3–2233·0) Central Europe, eastern Europe, and central Asia
Central Asia 0·1 (0·0–0·1) 0·9 (0·4–1·5) 0·001 (0·000–0·001) 0·01 (0·01–0·01) 0·1 (0·0–0·1) 0·9 (0·4–1·5) Central Europe 0·1 (0·0–0·1) 0·5 (0·3–0·8) 0·004 (0·003–0·006) 0·03 (0·02–0·04) 0·1 (0·1–0·1) 0·5 (0·3–0·8) Eastern Europe 0·0 (0·0–0·0) 0·1 (0·1–0·2) 0·007 (0·004–0·011) 0·03 (0·02–0·04) 0·0 (0·0–0·1) 0·2 (0·1–0·2) High income Australasia 0·0 (0·0–0·0) 0·0 (0·0–0·1) 0·000 (0·000–0·000) 0·01 (0·00–0·01) 0·0 (0·0–0·0) 0·0 (0·0–0·1) High-income Asia Pacific 0·0 (0·0–0·1) 0·1 (0·1–0·3) 0·003 (0·002–0·004) 0·01 (0·01–0·01) 0·0 (0·0–0·1) 0·1 (0·1–0·3) High-income North America 0·1 (0·1–0·3) 0·3 (0·2–0·9) 0·016 (0·010–0·023) 0·03 (0·02–0·05) 0·1 (0·1–0·3) 0·3 (0·2–0·9) Southern Latin America 0·1 (0·1–0·1) 1·2 (0·8–2·0) 0·003 (0·002–0·004) 0·04 (0·02–0·06) 0·1 (0·1–0·1) 1·2 (0·8–2·1) Western Europe 0·2 (0·1–0·3) 0·3 (0·2–0·4) 0·005 (0·003–0·007) 0·01 (0·01–0·02) 0·2 (0·1–0·3) 0·3 (0·2–0·4) Latin America and Caribbean
Andean Latin America 0·3 (0·2–0·6) 5·5 (2·7–10·5) 0·009 (0·005–0·013) 0·15 (0·09–0·22) 0·3 (0·2–0·7) 5·7 (2·9–10·6) Caribbean 1·4 (0·7–2·5) 32·4 (15·9–60·3) 0·014 (0·009–0·020) 0·31 (0·20–0·46) 1·4 (0·7–2·5) 32·7 (16·2–60·6) Central Latin America 3·7 (2·4–9·0) 15·0 (9·6–36·6) 0·19 (0·13–0·28) 0·79 (0·51–1·14) 3·9 (2·6–9·2) 15·8 (10·2–37·8) Tropical Latin America 1·4 (0·7–2·6) 6·4 (3·0–11·9) 0·04 (0·03–0·06) 0·18 (0·11–0·27) 1·5 (0·7–2·6) 6·6 (3·2–12·1)
North Africa and
Middle East 196·7 (104·3–345·6) 309·4 (164·3–544·1) 2·38 (1·56–3·48) 3·80 (2·50–5·53) 199·1 (106·6–347·6) 313·2 (167·9–547·2) South Asia 6737·5 (3894·5–10 976·9) 3571·8 (2054·4–5791·6) 79·47 (53·40–114·18) 42·48 (28·67–60·67) 6817 (3958–11 097) 3614 (2095–5856) Southeast Asia, east Asia, and Oceania
East Asia 237·7 (122·0–415·6) 234·4 (122·2–410·1) 4·30 (2·93–6·05) 3·70 (2·46–5·31) 242·0 (126·5–419·1) 238·1 (125·9–414·2) Oceania 16·2 (8·3–28·7) 1082·0 (559·3–1928·3) 0·17 (0·11–0·26) 12·06 (7·69–17·84) 16·3 (8·5–28·9) 1094·1 (569·1–1942·8) Southeast Asia 864·3 (488·9–1412·0) 1358·7 (770·0–2228·3) 12·92 (8·66–18·50) 20·07 (13·48–28·68) 877·2 (502·4–1424·3) 1378·7 (792·4–2244·9) Sub-Saharan Africa Central sub-Saharan Africa 93·9 (47·8–165·7) 569·7 (292·9–1007·4) 1·18 (0·75–1·75) 7·88 (5·14–11·48) 95·1 (48·7–166·8) 577·6 (300·0–1013·5) Eastern sub-Saharan Africa 749·3 (397·3–1279·1) 1392·7 (738·9–2378·6) 7·16 (4·66–10·61) 14·71 (9·70–21·19) 756·5 (405·2–1286·6) 1407·4 (755·1–2396·0) Southern sub-Saharan Africa 1·4 (0·7–2·5) 16·9 (8·9–30·2) 0·02 (0·01–0·03) 0·21 (0·14–0·31) 1·4 (0·8–2·5) 17·1 (9·1–30·4) Western sub-Saharan Africa 781·7 (399·5–1408·5) 1303·3 (677·9–2307·3) 6·99 (4·42–10·39) 13·08 (8·50–19·14) 788·7 (404·6–1419·7) 1316·4 (686·4–2318·8)
95% uncertainty intervals are included in parentheses. YLL=years of life lost. YLD=years lived with disability. DALY=disability-adjusted life-years. GBD=Global Burden of Diseases, Injuries, and Risk Factors Study.
Whereas global estimates show broad agreement, regional estimates are more variable (appendix p 19). Our model suggests that incidence is highest in south Asia, followed by southeast Asia, western sub-Saharan Africa, eastern sub-Saharan Africa, and Oceania, a distribution that is broadly similar to that estimated by Crump and colleagues.6 The estimates by Mogasale and colleagues7
and by Kim and colleagues11 suggest that incidence rates
in central and eastern sub-Saharan Africa are similar to those of south Asia, but otherwise show a similar distribution to our estimates. Antillón and colleagues10
suggest a notably different distribution, estimating by far the highest incidence rates in Oceania, followed by central sub-Saharan Africa, with a relatively modest incidence in south Asia. These differences reflect the scarce data available about typhoid incidence, and the resulting sensitivity to analytical methods. Notably, Oceania and central sub-Saharan Africa are two potentially high-burden regions with almost no data, and they are the regions for which estimates vary most widely. Additionally, our estimates for Latin America and southern sub-Saharan Africa are lower than those published previously. Whereas other estimates were restricted to a small number of older studies in these regions, we believe that our ability to use more recent vital registration and reporting data has resulted in estimates that more accurately reflect the burden in these regions.
Several notable strengths underlie these estimates. We had access to previously unavailable data, and our estimates are therefore based on the largest collection of sources yet included in a typhoid fever burden assess-ment. Improved data access also allowed us to estimate case fatality by age and national income category, and to develop separate estimates for typhoid and paratyphoid fever. DisMod-MR is a powerful modelling tool that allowed us to use information from heterogeneous data and covariates, consequently allowing us to make more informed and detailed extrapolations over space, time, and age. Use of posterior simulation allowed us to propagate uncertainty through the modelling process. Finally, working within the larger GBD infrastructure allowed us to estimate YLLs, YLDs, and DALYs within the larger context of other causes of health loss, and thereby produce estimates that are adjusted for multiple causes of death and for multiple causes of non-fatal burden.
However, data about typhoid and paratyphoid fever are still relatively sparse and we have no data from much of sub-Saharan Africa, Oceania, and Latin America. The absence of data from Nigeria is a substantial source of uncertainty given the country’s large population and potentially high burden. The absence of active surveillance data from high-burden countries is an important limitation. Moreover, the degree to which incidence from cohort studies represents incidence throughout a country is questionable, as many incidence studies were done in urban slum areas where typhoid
fever burden can be greatest. This suggests a need for data covering both a larger geographical range and a greater diversity of sites within countries, which might help reduce the biases related to site selection. Similarly, data about case fatality are both sparse and of questionable quality. No gold standard data exist for typhoid fever case fatality: data from passive surveillance sources are likely to overestimate case fatality (ie, greater under-reporting of less-severe and non-fatal cases than of fatalities), data from active surveillance sources are likely to underestimate case fatality (because of early diagnosis and treatment), and hospital-based data contain conflicting sources of bias (over-representation of severe cases would tend to produce overestimates, whereas diagnosis and treatment would tend to produce underestimates). Our method for splitting the overall case fatality estimates into separate estimates for typhoid and paratyphoid fever is also limited by the sparse data. That said, our case fatality estimates, ranging from 0·3% to 1·6%, are in line with the widely held expert opinion that case fatality is approximately 1%,5,6 and also
in line with estimates produced by Mogasale and colleagues,7 which ranged from 0·4% to 2·1%. Beyond
data limitations, our unsafe water covariate is an imperfect proxy for microbiologically safe water, which would probably be a better measure of faecal conta- mination and typhoid fever risk. Moreover, our model does not capture the burden associated with chronic carriage, most notably the increased risk of gallstones and gallbladder cancer.32 Finally, our modelling
framework is restricted to pre defined GBD age groups, which precludes estimation of burden for finer age categories that might be informative for vaccine policy.
Nevertheless, this study provides important information about the burden of typhoid and paratyphoid fevers and can be refined as additional data become available. Although SAGE has issued recommendations for typhoid conjugate vaccine use, decision making around vaccine intro duction lies largely with individual countries. Most countries eligible to apply for support from Gavi, the Vaccine Alliance, are in sub-Saharan Africa, and these new estimates should complement in-country surveillance data and offer valuable evidence to help countries make informed decisions around vaccine introduction.
Our global estimates are largely con sistent with previous typhoid fever burden estimates but add important information about the spatial distribution of the burden and the relative contributions of typhoid and paratyphoid fever; these findings offer empirical estimates of incidence and case fatality by age and income; and they provide important information about trends in incidence and mortality. The large differences in the published burden estimates for some regions stem from the paucity of data and highlight the need for more widespread active surveillance of enteric fever. As countries move forward with vaccine rollout, better
data and better surveillance must be a priority. Despite notable progress, typhoid and paratyphoid fevers clearly remain a major cause of death and disability to which billions of people worldwide are continuously exposed.
GBD 2017 Typhoid and Paratyphoid Collaborators
Jeffrey D Stanaway, Robert C Reiner, Brigette F Blacker, Ellen M Goldberg, Ibrahim A Khalil, Christopher E Troeger, Jason R Andrews, Zulfiqar A Bhutta, John A Crump, Justin Im, Florian Marks, Eric Mintz, Se Eun Park, Anita K M Zaidi, Zegeye Abebe, Ayenew Negesse Abejie, Isaac Akinkunmi Adedeji,
Beriwan Abdulqadir Ali, Azmeraw T Amare, Hagos Tasew Atalay, Euripide F G A Avokpaho, Umar Bacha, Aleksandra Barac, Neeraj Bedi, Adugnaw Berhane, Annie J Browne, Jesus L Chirinos, Abdulaal Chitheer, Christiane Dolecek, Maysaa El Sayed Zaki, Babak Eshrati,
Kyle J Foreman, Abdella Gemechu, Rahul Gupta,
Gessessew Bugssa Hailu, Andualem Henok, Desalegn Tsegaw Hibstu, Chi Linh Hoang, Olayinka Stephen Ilesanmi, Veena J Iyer,
Amaha Kahsay, Amir Kasaeian, Tesfaye Dessale Kassa,
Ejaz Ahmad Khan, Young-Ho Khang, Hassan Magdy Abd El Razek, Mulugeta Melku, Desalegn Tadese Mengistu,
Karzan Abdulmuhsin Mohammad, Shafiu Mohammed, Ali H Mokdad, Jean B Nachega, Aliya Naheed, Cuong Tat Nguyen,
Huong Lan Thi Nguyen, Long Hoang Nguyen, Nam Ba Nguyen, Trang Huyen Nguyen, Yirga Legesse Nirayo, Tikki Pangestu, George C Patton, Mostafa Qorbani, Rajesh Kumar Rai, Saleem M Rana, Chhabi Lal Ranabhat, Kedir Teji Roba, Nicholas L S Roberts, Salvatore Rubino, Saeid Safiri, Benn Sartorius, Monika Sawhney, Mekonnen Sisay Shiferaw, David L Smith, Bryan L Sykes, Bach Xuan Tran, Tung Thanh Tran, Kingsley Nnanna Ukwaja, Giang Thu Vu, Linh Gia Vu, Fitsum Weldegebreal, Melaku Kindie Yenit, Christopher J L Murray, Simon I Hay.
Affiliations
Department of Health Metrics Sciences (J D Stanaway PhD, R C Reiner PhD, I A Khalil MD, Prof A H Mokdad PhD,
Prof D L Smith PhD, Prof C J L Murray DPhil, Prof S I Hay FMedSci), Institute for Health Metrics and Evaluation (J D Stanaway, R C Reiner, B F Blacker MPH, E M Goldberg MPH, I A Khalil MD,
C E Troeger MPH, K J Foreman PhD, N L S Roberts BS,
Prof A H Mokdad PhD, Prof D L Smith PhD, Prof C J L Murray DPhil, Prof S I Hay FMedSci), University of Washington, Seattle, WA, USA; Division of Infectious Disease & Geographic Medicine, Stanford University, Stanford, CA, USA (J R Andrews MD); The Centre for Global Child Health, Hospital for Sick Children, University of Toronto, Toronto, ON, Canada (Prof Z A Bhutta PhD); Center of Excellence in Women and Child Health (Prof Z A Bhutta), Department of Paediatrics and Child Health (A K M Zaidi SM), Aga Khan University, Karachi, Pakistan; Centre for International Health, University of Otago, Dunedin, New Zealand (Prof J A Crump MD); Division of Infectious Diseases and International Health, Duke University, Durham, NC, USA (Prof J A Crump); International Vaccine Institute, Seoul, South Korea (J Im MS, F Marks PhD, S Park MIS); Department of Medicine, University of Cambridge, Cambridge, UK (F Marks); Waterborne Diseases Prevention Branch, Centers for Disease Control and Prevention, Atlanta, GA, USA (E Mintz MD); Global Health Division, Bill & Melinda Gates Foundation, Seattle, USA (A K M Zaidi SM); Human Nutrition Department (Z Abebe MSc), Institute of Public Health (M Melku MSc), University of Gondar, Gondar, Ethiopia; Debre Markos University, Debre Markos, Ethiopia (A N Abejie MPH); Department of Public Health, Wollega University, Nekemte, Ethiopia; Department of Sociology, Olabisi Onabanjo University, Ago-Iwoye, Nigeria (I A Adedeji PhD); Medical Technical Institute, Erbil Polytechnic University, Erbil, Iraq (B A Ali PhD); Faculty of Pharmacy (B A Ali), Ishik University, Erbil, Iraq (K A Mohammad PhD); Sansom Institute, South Australian Health and Medical Research Institute, Adelaide, SA, Australia
(A Amare PhD); Bahir Dar University, Bahir Dar, Ethiopia (A Amare PhD); Department of Nursing, Aksum University, Aksum, Ethiopia (H T Atalay MSc); Bénin Clinical Research Institute (IRCB), Abomey-Calavi, Benin (E F A Avokpaho MD); Contrôle Des Maladies
Infectieuses, Laboratory of Studies and Research-Action in Health, Porto Novo, Benin (E F A Avokpaho); School of Health Sciences, University of Management and Technology, Lahore, Pakistan (U Bacha MPhil); Clinic for Infectious and Tropical Diseases, Clinical Center of Serbia, Belgrade, Serbia (A Barac PhD); Faculty of Medicine, University of Belgrade, Belgrade, Serbia (A Barac); Department of Community Medicine, Gandhi Medical College Bhopal, Bhopal, India (Prof N Bedi MD); Jazan University, Jazan, Saudi Arabia (Prof N Bedi); School of Public Health, Addis Ababa University, Addis Ababa, Ethiopia (A Berhane PhD); Big Data Institute, Li Ka Shing Centre for Health Information and Discovery (A J Browne MPH), Centre for Tropical Medicine and Global Health, Nuffield Department of Medicine (C Dolecek MD), University of Oxford, Oxford, UK; Department of Public Health, Administration, and Social Sciences, Cayetano Heredia University, Peru (J L Chirinos DrPH); Ministry of Health, Baghdad, Iraq (A Chitheer MD); Mahidol–Oxford Tropical Medicine Research Unit, Faculty of Tropical Medicine, Mahidol University, Bangkok, Thailand (C Dolecek MD); Department of Clinical Pathology, Mansoura University, Mansoura, Egypt (Prof M El Sayed Zaki PhD); Center of Communicable Disease Control, Ministry of Health and Medical Education, Tehran, Iran (B Eshrati PhD); Department of Medical Laboratory Sciences (A Gemechu MSc), School of Nursing and Midwifery (K T Roba PhD), School of Pharmacy (M S Shiferaw MSc), Department of Medical Laboratory Science (F Weldegebreal MPH), Haramaya University, Harar, Ethiopia; Medical Microbiology, Nepal Health Research Council, Kathmandu, Nepal (A Gemechu MSc); Commissioner of Public Health, West Virginia Bureau for Public Health, Charleston, WV, USA (Prof R Gupta MD); Department of Health Policy, Management & Leadership, West Virginia University School of Public Health, Morgantown, WV, USA (Prof R Gupta); Biomedical Sciences Division (G B Hailu MSc), Department of Nutrition and Dietetics
(A Kahsay MPH), Clinical Pharmacy Unit (T D Kassa MSc, Y L Nirayo MS), School of Medicine (D T Mengistu MSc), Mekelle University, Mekelle, Ethiopia; Mizan-Tepi University, Teppi, Ethiopia (A Henok MPH); Department of Reproductive Health, Hawassa University, Hawassa, Ethiopia (D T Hibstu MPH); Center of Excellence in Behavioral Medicine (C L Hoang BMedSc, N B Nguyen MD, G T Vu BA, L G Vu B Med Sc), Center for Excellence in Behavioral Health (L H Nguyen PhD, T H Nguyen MSc), Nguyen Tat Thanh University, Ho Chi Minh, Vietnam; Department of Public Health and Community Medicine, University of Liberia, Monrovia, Liberia (O S Ilesanmi PhD); Indian Institute of Public Health Gandhinagar, Public Health Foundation of India, Gandhinagar, India
(V J Iyer MPH); Hematologic Malignancies Research Center (A Kasaeian PhD), Hematology-Oncology and Stem Cell Transplantation Research Center (A Kasaeian), Tehran University of Medical Sciences, Tehran, Iran; Epidemiology and Biostatistics Department, Health Services Academy, Islamabad, Pakistan (E A Khan MPH); Institute of Health Policy and Management (Prof Y Khang MD), Department of Health Policy and Management (Prof Y Khang), Seoul National University, Seoul, South Korea; Department of Cardiology, Damietta University, Damietta, Egypt (H Magdy Abd El Razek MD); Department of Biology, Salahaddin University, Erbil, Iraq (K A Mohammad PhD); Health Systems and Policy Research Unit, Ahmadu Bello University, Zaria, Nigeria (S Mohammed PhD); Institute of Public Health, Heidelberg University, Heidelberg, Germany (S Mohammed PhD); Department of Epidemiology, University of Pittsburgh, Pittsburgh, PA, USA (Prof J B Nachega PhD); Department of Epidemiology, Johns Hopkins University, Baltimore, MD, USA (Prof J B Nachega); Initiative for Non Communicable Diseases, International Centre for Diarrhoeal Disease Research, Bangladesh, Dhaka, Bangladesh (A Naheed PhD); Institute for Global Health Innovations, Duy Tan University, Hanoi, Vietnam (C T Nguyen MPH, H L T Nguyen MPH, T T Tran BMedSc); Lee Kuan Yew School of Public Policy, National University of Singapore, Singapore, Singapore (Prof T Pangestu PhD); Department of Paediatrics, University of Melbourne, Melbourne, VIC, Australia (Prof G C Patton MD); Population Health Group, Murdoch Childrens Research Institute, Melbourne, VIC, Australia (Prof G C Patton); Non-Communicable Diseases Research Center, Alborz University of
Medical Sciences, Karaj, Iran (M Qorbani PhD); Society for Health and Demographic Surveillance, Suri, India (R Rai MPH); Department of Economics, University of Goettingen, Göttingen, Germany (R Rai); Department of Public Health, Contech School of Public Health, Lahore, Pakistan (Prof S M Rana PhD); Public Health Department, University of Health Sciences, Lahore, Pakistan (Prof S M Rana); Institute for Poverty Alleviation and International Development, Yonsei University, Wonju, South Korea (C L Ranabhat PhD); Department of Biomedical Science, University of Sassari, Sassari, Italy (S Rubino MD); Managerial Epidemiology Research Center, Maragheh University of Medical Sciences, Maragheh, Iran (S Safiri PhD); Department of Public Health Medicine, University of Kwazulu-Natal, Durban, South Africa (Prof B Sartorius PhD); Department of Public Health Sciences, University of North Carolina at Charlotte, Charlotte, NC, USA (M Sawhney PhD); Department of Criminology, Law and Society, University of California Irvine, Irvine, CA, USA (Prof B L Sykes PhD); Department of Health Economics, Hanoi Medical University, Hanoi, Vietnam (B X Tran PhD); Department of Internal Medicine, Federal Teaching Hospital, Abakaliki, Nigeria (K N Ukwaja MD); and Department of Epidemiology and Biostatistics, Academy of Medical Science, Gondar, Ethiopia, Ethiopia
(M K Yenit MPH).
Contributors
JDS prepared the first draft and constructed the figures and tables. SIH provided overall guidance. SS managed the project. JDS finalised the manuscript on the basis of comments from other authors and feedback from reviewers. All other authors provided data or developed models for indicators, reviewed results, initiated modelling infrastructure, and reviewed and contributed to the paper.
Declaration of interests
JDS reports grants from Merck, outside the submitted work. AKMZ reports salaried employment with the Bill & Melinda Gates Foundation, during the conduct of the study. All other authors declare no competing interests.
Acknowledgments
Funding for this analysis was provided by the Bill & Melinda Gates Foundation (OPP1132415). The findings and conclusions in this report are those of the authors and do not necessarily represent the official position of the US Centers for Disease Control (CDC). AB received support for research from the Project of Ministry of Education, Science and Technology of the Republic of Serbia (No. III45005). JAC received support from the Bill & Melinda Gates Foundation (BMGF) grants OPP1125993, OPP1151153, and OPP1158210; US National Institutes for Health grant R01AI121378; and the New Zealand Health Research Council through e-ASIA Joint Research Program grant 16/697. FA acknowledges the support of grants from the Bill & Melinda Gates Foundation (OPPGH5321, OPP1127988).
References
1 Harris JB, Brooks WA. Typhoid and paratyphoid (enteric) fever. In: Magill AJ, Ryan ET, Hill DR, Solomon T, eds. Hunter’s tropical medicine and emerging infectious diseases, 9th edn. Philadelphia, PA: Elsevier, 2013: 568–76.
2 Verghese A. The ‘typhoid state’ revisited. Am J Med 1985;
79: 370–72.
3 Bhutta ZA. Impact of age and drug resistance on mortality in typhoid fever. Arch Dis Child 1996; 75: 214–17.
4 GBD 2016 Disease and Injury Incidence and Prevalence
Collaborators. Global, regional, and national incidence, prevalence, and years lived with disability for 328 diseases and injuries for 195 countries, 1990–2016: a systematic analysis for the Global Burden of Disease Study 2016. Lancet 2017; 390: 1211–59.
5 Buckle GC, Walker CLF, Black RE. Typhoid fever and paratyphoid
fever: systematic review to estimate global morbidity and mortality for 2010. J Glob Health 2012; 2: 010401.
6 Crump JA, Luby SP, Mintz ED. The global burden of typhoid fever.
Bull World Health Organ 2004; 82: 346–53.
7 Mogasale V, Maskery B, Ochiai RL, et al. Burden of typhoid fever in low-income and middle-income countries: a systematic, literature-based update with risk-factor adjustment. Lancet Glob Health 2014; 2: e570–80.
8 SAGE Working Group on Typhoid, Vaccines. Background paper to
SAGE on typhoid vaccine policy recommendations. Sept 24, 2017. http://www.who.int/immunization/sage/meetings/2017/october/1_ Typhoid_SAGE_background_paper_Final_v3B.pdf
(accessed Jan 21, 2019).
9 Jin C, Gibani MM, Moore M, et al. Efficacy and immunogenicity of
a Vi-tetanus toxoid conjugate vaccine in the prevention of typhoid fever using a controlled human infection model of Salmonella Typhi: a randomised controlled, phase 2b trial. Lancet 2017;
390: 2472–80.
10 Antillón M, Warren JL, Crawford FW, et al. The burden of typhoid fever in low- and middle-income countries: a meta-regression approach. PLoS Negl Trop Dis 2017; 11: e0005376.
11 Kim J-H, Mogasale V, Im J, Ramani E, Marks F. Updated estimates of typhoid fever burden in sub-Saharan Africa. Lancet Glob Health 2017; 5: e969.
12 Lozano R, Naghavi M, Foreman K, et al. Global and regional mortality from 235 causes of death for 20 age groups in 1990 and 2010: a systematic analysis for the Global Burden of Disease Study 2010. Lancet 2012; 380: 2095–128.
13 GBD 2016 DALYs and HALE Collaborators. Global, regional, and national disability-adjusted life-years (DALYs) for 333 diseases and injuries and healthy life expectancy (HALE) for 195 countries and territories, 1990–2016: a systematic analysis for the Global Burden of Disease Study 2016. Lancet 2017; 390: 1260–344. 14 Kassebaum NJ, Arora M, Barber RM, et al. Global, regional,
and national disability-adjusted life-years (DALYs) for 315 diseases and injuries and healthy life expectancy (HALE), 1990–2015: a systematic analysis for the Global Burden of Disease Study 2015. Lancet 2016;
388: 1603–58.
15 Murray CJL, Vos T, Lozano R, et al. Disability-adjusted life years (DALYs) for 291 diseases and injuries in 21 regions, 1990–2010: a systematic analysis for the Global Burden of Disease Study 2010. Lancet 2012; 380: 2197–223.
16 Murray CJL, Barber RM, Foreman KJ, et al. Global, regional, and national disability-adjusted life years (DALYs) for 306 diseases and injuries and healthy life expectancy (HALE) for 188 countries, 1990–2013: quantifying the epidemiological transition. Lancet 2015;
386: 2145–91.
17 Hoffman SL, Edman DC, Punjabi NH, et al. Bone marrow aspirate culture superior to streptokinase clot culture and 8 ml 1:10 blood-to-broth ratio blood culture for diagnosis of typhoid fever. Am J Trop Med Hyg 1986; 35: 836–39.
18 Gilman RH, Terminel M, Levine MM, Hernandez-Mendoza P, Hornick RB. Relative efficacy of blood, urine, rectal swab, bone-marrow, and rose-spot cultures for recovery of Salmonella Typhi in typhoid fever. Lancet 1975; 1: 1211–13. 19 Watson KC. Laboratory and clinical investigation of recovery of
Salmonella Typhi from blood. J Clin Microbiol 1978; 7: 122–26. 20 Flaxman AD, Vos T, Murray CJL. An integrative metaregression
framework for descriptive epidemiology. Seattle, WA: University of Washington Press, 2015.
21 GBD 2017 Risk Factor Collaborators. Global, regional, and national comparative risk assessment of 84 behavioural, environmental and occupational, and metabolic risks or clusters of risks for 195 countries and territories, 1990–2017: a systematic analysis for the Global Burden of Disease Study 2017. Lancet 2018; 392: 1923–94. 22 Ramage CS. Monsoon meteorology. New York, NY, USA: Academic
Press, 1971.
23 Dewan AM, Corner R, Hashizume M, Ongee ET. Typhoid fever and its association with environmental factors in the Dhaka Metropolitan Area of Bangladesh: a spatial and time-series approach.
PLoS Negl Trop Dis 2013; 7: e1998.
24 World Bank. Country and lending groups. Data. Oct 22, 2013. http://data.worldbank.org/about/country-and-lending-groups (accessed Feb 14, 2019).
25 Chinese Center for Disease Control and Prevention (CCDC). China notifiable infectious diseases 2004–2012. http://ghdx. healthdata.org/record/china-notifiable-infectious-diseases-2004-2012 (accessed Sept 12, 2018).
26 GBD 2017 Cause of death collaborators. Global, regional, and national age-sex-specific mortality for 282 causes of death, 1980–2017: a systematic analysis for the Global Burden of Disease Study 2017. Lancet 2018; 392: 1736–88.
27 Azmatullah A, Qamar FN, Thaver D, Zaidi AK, Bhutta ZA. Systematic review of the global epidemiology, clinical and laboratory profile of enteric fever. J Glob Health 2015; 5: 020407.
28 Poulos C, Riewpaiboon A, Stewart JF, et al. Cost of illness due to typhoid fever in five Asian countries. Trop Med Int Health 2011;
16: 314–23.
29 Riewpaiboon A, Piatti M, Ley B, et al. Cost of illness due to typhoid fever in Pemba, Zanzibar, East Africa. J Health Popul Nutr 2014;
32: 377–85.
30 Bahl R, Sinha A, Poulos C, et al. Costs of illness due to typhoid fever in an Indian urban slum community: implications for vaccination policy. J Health Popul Nutr 2004; 22: 304–10. 31 Stuart BM, Pullen RL. Typhoid; clinical analysis of 360 cases.
Arch Intern Med 1946; 78: 629–61.
32 Nagaraja V, Eslick GD. Systematic review with meta-analysis: the relationship between chronic Salmonella Typhi carrier status and gall-bladder cancer. Aliment Pharmacol Ther 2014; 39: 745–50.