ISSN 1832-1526
Australian Review of Public Affairs
Volume 10, Number 1: July 2011, 41–60 © The University of Sydney
primary school entry
Ben Edwards, Australian Institute of Family Studies Matthew Taylor, University of Canberra
Mario Fiorini, University of Technology Sydney
ABSTRACT
The practice of ‘academic red-shirting’ (parents delaying enrolment in primary school for a year after their child is first eligible) is becoming more common in the developed world. The idea behind this practice is that the ‘gift of time’ enables children to develop cognitively and emotionally so that they are more school-ready than their peers. Little is known about the factors associated with delayed school entry in Australia. In this paper we begin to fill this gap in the Australian research using data from the Longitudinal Study of Australian Children. We estimate that 14.5 per cent of school entrants in 2005 had been delayed from the previous year, the first national estimates of delayed entry. The rates of delayed school entry vary markedly between states and territories with New South Wales having particularly high rates of delayed entry (31.3 per cent in 2005). Parental decision-making about delaying a child’s entry to school appears to be most influenced by state and territory entry age policies with only a few other factors found to be statistically significant. Children who are less able to persist at tasks and boys are more likely to be delayed entrants. The decision to delay a child’s entry to school is also more likely if English is the mother’s first language and if the family lives in a non-metropolitan area.
Ben Edwards <[email protected]> is a Senior Research Fellow at the Australian Institute of Family Studies. Ben manages Growing Up in Australia: The Longitudinal Study of Australian Children. At the time of writing Matthew Taylor was a Senior Research Officer at the Australian Institute of Family Studies. His research interests include the economics of child development, income tax and transfer policy and the economic consequences of parental separation. Matthew has recently taken up a position at the National Centre for Social and Economic Modelling at the University of Canberra. Mario Fiorini <[email protected]> is a Lecturer in the School of Finance and Economics at the University of Technology Sydney. He obtained a PhD from University College London in 2008. Mario’s research interests include labour economics and applied econometrics.
Introduction
‘Academic red-shirting’ refers to the practice of parents delaying their children’s enrolment in their first year of primary school for a year after their child is first eligible. The idea behind this practice is that the ‘gift of time’ enables children to develop cognitively and emotionally so that they are more school-ready. In the popular media there are strong advocates for delayed school entry (see Biddulph 1998 for boys), while the Cambridge Primary Review, a recent review of primary school education in the United Kingdom recommended the school starting age should be raised to six years (Alexander et al. 2009). Yet there are costs associated with finishing school and starting work later. Further, education systems, such as those in the United States, that require children to remain in school until a certain age allow those children who start school later to leave having completed fewer years of education. The negative impact of fewer years of education on lifetime earnings is well documented (Angrist & Krueger 1991, 1992). Even in education systems such as those in Europe and Australia that require a minimum number of years of schooling (Council of Australian Governments 2009), increases in school entry ages are not without cost. There is the cost to parents of purchasing an additional year of childcare prior to their child’s entry to school in addition to the earnings foregone as these children enter the workforce a year later than they otherwise would. There are also costs to government in childcare subsidies and foregone taxation revenue. However, if it is the case that delayed school entry affords these children with an educational advantage these costs may be offset by higher rates of school retention and higher earnings once they enter the labour force.
In this paper we examine the child and parental characteristics associated with the parent’s decision to delay children until a later school intake than the earliest that the child was eligible. To date there has been little Australian research into the prevalence of academic red-shirting and the factors associated with it. We provide the first national estimates of the prevalence of academic red-shirting and identify the factors associated with delayed primary school entry from a comprehensive set of parent and child characteristics. In contrast to many earlier studies we also consider the extent to which differences in state and territory government entry policies may contribute to observed differences in the rates of delayed entry between state government jurisdictions.
Research on timing of primary school entry
Several studies have found that children who enter school older have better cognitive outcomes as measured by test scores in mathematics, reading and standardised scores of achievement (Bedard & Dhuey 2006; Cascio & Schazanbach 2007; Elder & Lubotsky 2009). These gains are often referred to as ‘the gift of time’, as there is a belief that children who begin school when they are older are more ‘school ready’ and consequently benefit more from school than children who begin school earlier. But as noted above, parental decisions to delay their child’s entry to primary school can also impact on the number of possible years of schooling children receive, and there is a substantial economic literature on the benefits of years of schooling on
future earnings (see, for example, Angrist & Krueger 1991; Bound, Jaeger & Baker 1995; Leigh & Ryan 2008). The findings of this research, then, seem at odds with research that supports the ‘gift of time’ argument. The future earnings research is based on the fact that the time when children can legally leave school depends on chronological age and not years of schooling (Deming & Dynarski 2008). Deming and Dynarski (2008) therefore argue that the increase in the number of school entrants who are delayed in the United States is responsible for the decreases in the years of schooling that have been observed in that country in recent times. While there has not been much of an attempt to reconcile these two bodies of research, one explanation for their divergent findings may be that children with greater levels of disadvantage are more likely to drop out (future earnings) and benefit less from starting school later (gift of time).1
In the United States, 16 per cent of children are red-shirted and there is some research on the factors associated with delayed school entry (Deming & Dynarski 2008). Data from the Early Childhood Longitudinal Study suggests that children who were delayed are more likely to be male, to be white (rather than African American, Hispanic or Asian), and less likely to have attended preschool before primary school (Malone et al. 2006). Parents of children who were delayed were more likely to have a university degree or higher, but there were no differences in delayed entry for children in families with incomes below the poverty line (compared to families with higher incomes). A school-based survey of 8,000 students in Wisconsin suggested that delayed entrants were more likely to be boys, be poor (eligible for a free lunch) and be born just before the cut-off to be eligible to attend primary school when compared to children who entered school on-time (Graue & DiPerna 2000). Other older national US studies also suggest that children are more likely to be delayed if they are born in the months just prior to the eligibility cut-off (that is, they would be among the youngest in their class), if they are boys and if they are considered less mature by their parents (Zill, Loomis & West 1997). Although these studies have highlighted several family demographic characteristics associated with delayed school entry, there has been limited examination of whether parental decisions to delay their child’s entry to school is associated with the characteristics of their child.
Most studies finding a benefit from academic red-shirting are based on data from United States and European children. Although the long-term effects of school starting age have not been the focus of many studies, there is a suggestion that the positive effects of an older school starting age for an individual are reduced over time (Elder & Lubotsky 2009; Peck & Trimmer 1995). However, one study of the later life outcomes of the entire Swedish population born between 1935 and 1984 finds that older children have better educational attainment and higher earnings (Fredriksson & Ockert 2005). This suggests that parents’ perceptions of their child’s school readiness
1 In light of recent moves by state and territory governments to adopt a policy that mandates a minimum number of years of school, this is of less concern in Australia, where secondary students are required to remain at school until they complete Year 10 (Council of Australian Governments 2009).
and the extent to which they believe their children will benefit from delayed entry may play an important role in parents’ decisions to delay their child’s entry to school. In this paper we begin to fill the gaps in the Australian and international research on factors associated with delayed primary school entry using data from the Child (or K) Cohort of Growing Up in Australia: The Longitudinal Study of Australian Children (LSAC). We begin by providing the first national estimates of delayed school entry for children who became eligible to attend school in 2005. We investigate whether different state and territory school entry age regulations are associated with the delay of school entry to the subsequent 2006 school intake. We then examine factors associated with delayed enrolment in primary school. We do so to determine whether it is state and territory school entry age regulations, parental characteristics or the characteristics of the child that are most influential in parents’ decision to delay their child’s entry to school.
School entry policy in Australia
In Australia, the state and territory governments have jurisdiction over primary and secondary education policy. Consequently, there is significant variation in school entry policies across the states and territories. Together with variation in the school entry eligibility dates there is also variation in the number of intakes during the school year and in the names given to describe the first year of formal schooling. Table 1 summarises the school entry policies of each state and territory in 2005.
Table 1. School entry policies of each state and territory in 2005
State Program Mandatory age Eligibility date Year before Year 1 Year child turns … Turns 5 by …
New South Wales Kindergarten 6 31 July
Victoria Preparatory 6 30 April
Queensland Year 1 7 1 January
Western Australia Pre-primary 6.5 30 June
South Australia Reception 6 5th birthday
Tasmania Preparatory 6 1 January
Australian Capital Territory Kindergarten 6 30 April
As Table 1 shows, in most states and territories in Australia, children must begin school no later than the year in which they turn six. In addition to this maximum age, state and territory governments also set eligibility dates whereby children born in the months preceding this date may enter school at the first available intake or may wait until the subsequent intake. In Australia the practice of delaying a child’s entry to school is allowed by state/territory government regulations until such time the child reaches a maximum entry age. For instance, in Victoria a child has to turn five by 30 April to start school in that year’s intake (usually around 1 February) otherwise she/he will have to wait until next year’s intake at which point she/he will be 12 months older. A child born before the eligibility date (for instance a child who turns five on 20 April) is eligible to start school at the beginning of that year. The parents of this child may however, decide to wait and enter their child into school the following year. We refer to children who enter school after they were first eligible as ‘delayed’ entrants. Further, as Table 1 indicates the Northern Territory and South Australia have multiple intakes within a given school year. In these states, children are eligible to enter school at the beginning of the term after their fifth birthday. Since it is not possible to determine in which intake these children began school from the LSAC data we are unable to reliably determine the school entry age of these children. It is for this reason that we exclude children who began school in the Northern Territory and South Australia from the analysis that follows.
If parents choose to send their children to primary school in the year when they are first eligible, the difference in entry age regulations between the states and territories contribute to substantial differences in entry ages between states even for children born on the same day. The observed differences in entry ages between states and territories will also reflect differential patterns of delayed entry by parents in each state. In light of these differences there has been some discussion at the Ministerial Council of Education, Employment Training and Youth Affairs (MCEETYA) and policy work to investigate implementing a common school starting age in Australia in 2010 (Atelier Learning Solutions & Access Economics 2006). The options investigated in this review ranged from an eligibility age of four years five months to four years eight months, which mean that in some instances the eligibility age would be younger than had previously been the case. The scope of the review included the economic costs and benefits and excluded non-economic issues such as changes to the amount of family time with children or potential personal, emotional or psychological costs or benefits to children of an earlier or later school starting age (Atelier Learning Solutions & Access Economics 2006, p. iv).
While the proposed policy reform has not been implemented, gaining an understanding of the role that school entry age policies play in parental decisions to delay their child’s entry to school is essential for assessing the impacts of any future policy reform.
Method
In this section we describe the data used and outline some of the psychometric measures used in our multivariate analysis. Our data are drawn from the Child
Cohort of LSAC. During 2004, 4,983 children born between March 1999 and February 2000 and their families were recruited. At Wave 1 the average child was 57 months old (4.8 years), with most of the sample falling within a three-month band from the mean. Because of their young age, only 15 per cent of children were already in school. At Wave 2 the average child was 82 months old (6.8 years, 26 months older than at Wave 1). Almost all children were in school with the majority in Year 1 (the second year of school in all states but Queensland). Attrition between the two waves was approximately 10 per cent. We include only those children who were yet to enter school in the first wave of LSAC to ensure that each of these child assessments were made prior to the child’s entry to school.
Who Am I?
The Who am I? (WAI), developed by the Australian Council for Educational Research, is a measure of children’s school readiness. It assesses the general cognitive abilities needed for beginning school. The WAI is a direct child assessment measure that requires children to copy shapes (circle, triangle, cross, square, and diamond) and write numbers, letters, words and sentences. These are similar activities to those that children undertake in their first year of school.
Peabody Picture Vocabulary Test
In addition to WAI as a specific measure of school readiness we also include a direct measurement of children’s verbal ability prior to school entry. The LSAC has a short form of the Peabody Picture Vocabulary Test (PPVT-III), which is a test designed to measure a child’s knowledge of the meaning of spoken words and his or her receptive language and vocabulary acquisition (Dunn & Dunn 1997). It was adapted for the Australian context.2 It contains different, but overlapping, sets of items of appropriate difficulty for children aged four to five years and six to seven years. A book with 40 plates of display pictures was used. The child is not required to define words but to show what they mean by pointing to (or saying the number of) a picture that best represents the meaning of the word.
We hypothesise that it is those children who are more school-ready and have higher levels of verbal ability who are more likely to attend school when first eligible. In addition to the child’s level of cognitive we also hypothesise that the behaviour and temperament of children prior to school entry would also play a role in parents’ decisions to send their children to school when first eligible.
2 Permission to adapt and create a short form for LSAC was granted by the publisher. The PPVT-III-LSAC Australian Short-form was developed by S. Rothman, Australian Council for Educational Research (ACER), Melbourne from the Peabody Picture Vocabulary Test, 3rd edn (PPVT-III) Form IIA, English edition.
Social or emotional wellbeing
In both waves parents completed the Strengths and Difficulties Questionnaire (Goodman 1997) which asks parents 25 questions about their child’s behaviour. The questionnaire includes five sub-scales (which each consist of the mean of five items) as follows:
• prosocial behaviour—propensity to behave in a way that is considerate and helpful to others;
• hyperactivity—fidgetiness, concentration span and impulsiveness;
• emotional symptoms—frequency of display of negative emotional states (for example, nervousness, worry);
• peer problems—ability to form positive relationships with other children; and
• conduct problems—tendency to display problem behaviour when interacting with others.
Temperament style
Child temperament at Wave 1 was measured by the Short Temperament Scale for Children (STSC, adapted from Sanson et al. 1993). Three dimensions were assessed:
• sociability—reflecting the child’s ease when meeting new people or in new social situations (for example, the child is outgoing with adult strangers outside the home);
• persistence—the child’s ability to stay with an activity and see tasks through to completion (for example, practices a new skill for ten minutes or more); and
• reactivity—the mildness or intensity with which the child reacts (for example, responds to frustration intensely).
We hypothesise that children who are more social in behaviour and temperament and those less likely to have peer problems are less likely to be delayed. Children who are reported to have emotional problems may be more likely to be delayed as their parents may perceive these children as having greater difficulty in adapting to a new environment. Children who have persistent temperaments may be more likely to attend school when first eligible to the extent that activities undertaken in a more formal learning environment require some persistence.
In addition to these psychometric measures, we also include a number of child and family socio-demographic characteristics. Consistent with previous research (Malone et al. 2006, Graue & Diperna 2000) we include child gender. We also include number of siblings as this is likely to capture economies of scale in the costs of childcare that may make is easier for parents to delay the focal child. It may also be the case that parents who have had more children are in a better position to assess the school readiness of each individual child. We also include mother’s and father’s income as this gives an indication of parents’ ability to finance an additional year of childcare. The amount of disposable income available for childcare expenditure will be determined by the
number of income earners and children in the household, we therefore include an indicator for whether there are two parents in the household and the total number of people in the household. We also include mother’s and father’s educational attainment, we think it likely that it is parents with higher levels of education who will perceive a developmental advantage in delaying their child’s entry to school. For similar reasons we include mother’s and father’s English proficiency; parent’s from non-English speaking backgrounds may not be informed about the operation of school entry policies and may not know whether they can delay their child from starting school. We also include whether the child is Indigenous and an indicator for whether the household is outside a metropolitan area. We have no strong priors as to the direction of the association between these variables and school entry when first eligible.
Results
Estimates of delayed entry
Table 2 provides estimates of the percentage of children who entered school early, on-time (that is, in the year they were first eligible) or were delayed for those children who entered school in 2005 by states and territory. We focus on those children who entered school in 2005 as these children represent the largest school intake in the LSAC study (2,930 children in 2005, compared to 392 in 2004 and 495 in 2006). Children are classified as early entrants, entering in the year first eligible or delayed entrants according to whether the age at which they were first eligible to begin school is less than, equal to, or greater than the age we would predict given information about their date of birth, the entry age eligibility dates contained in Table 1, the school term start dates for each state and territory and the information on the child’s grade progression.
Table 2. Percentage of children who are delayed, on-time and early by state Delayed entry On-time entry Early entry Total
% N % N % N % N
New South Wales 31.32 331 68.68 726 0.00 0 100.00 1057
Victoria 10.23 86 89.77 755 0.00 0 100.00 841
Queensland 0.00 0 99.82 550 0.18 1 100.00 551
Western Australia 1.65 5 98.35 298 0.00 0 100.00 303
Tasmania 0.00 0 98.99 98 1.01 1 100.00 99
Australian Capital Territory 5.06 4 94.94 75 0.00 0 100.00 79 Total 14.54 426 85.39 2502 0.07 2 100.00 2930
While we can reasonably infer when the child began school for a state/territory that has a single intake of students at the beginning of the school year, this is not the case for South Australia and the Northern Territory, which have multiple intakes throughout the year. Consequently we do not include children resident in South Australia (6.88 per cent of the sample) and the Northern Territory (1.52 per cent) in the analyses that follow. It should also be noted that while children who begin school in Queensland do so in a single intake at the beginning of the year Queensland did not have a pre-Year 1 program in 2005. The majority of Queensland children in the LSAC sample began their first year of school in 2006 at which time they were, on average, older than those children who began school in the other states.
Overall, 14.5 per cent of school entrants in 2005 had been delayed from the previous year. The rates of delayed school entry vary markedly between states and territories. A large proportion of children from New South Wales were delayed (31.3 per cent). In Victoria 10.2 per cent of children were delayed, which is about one third of the rate in New South Wales. There are also some delayed entrants in the Australian Capital Territory (5.1 per cent). In Western Australia and Tasmania starting school in the year the child is first eligible is far more common, with an overall rate of 98.4 per cent and 97.5 per cent over the 2004–06 period. The higher on-time entry rates observed in Western Australia and Tasmania are the result of state specific early education policies. Western Australia has a universal preschool program of eleven hours per week for children who turn four by 30 June that year. This program is usually offered on the site of the local primary school (Harrington 2008). As a consequence, parents (and their children) are familiar with the school environment and many send their children to school at the first available opportunity. Tasmania has a similar policy, where eleven hours a week of preschool is offered to four year olds on the primary school grounds (who must be four years on 1 January in the year they start).
State differences in the proportion of children going to school in the first year eligible by month of birth
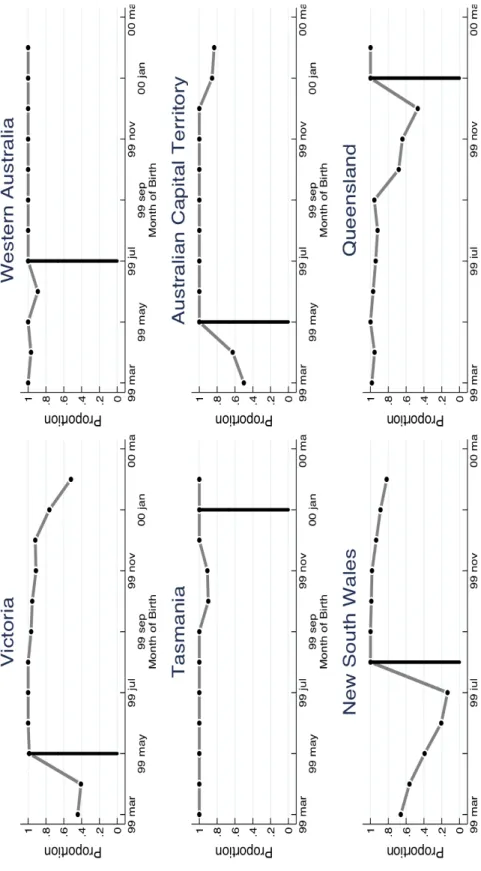
The grey line in Figure 1 shows the proportion of children going to school the year they are first eligible by month of birth for each state and territory. Children born in the dates to the left of the eligibility date, depicted by the black vertical line, are eligible to enter school in that year while those born to the right are eligible to send their child to school the year after. These estimates were calculated by pooling the 2004, 2005 and 2006 entry cohorts excluding the small number of early entrants in each state and territory.
In most states the proportion of entrants who go to school in the first year they are eligible drops for children who are born in the months of the year where they are just eligible to go to school. By just eligible we mean those children born in the three to four months immediately preceding the eligibility date, and who would be relatively young were they to enter school when first eligible. This pattern is most pronounced in New South Wales, Victoria and Queensland. In New South Wales, only 13.5 per cent of children who are born in July 1999 go to school at the first available
opportunity. The proportion of children who enter at the first eligible intake increases as we examine those birth months prior to the cut-off date. Just over 20 per cent of children born two month to the cut-off enter at the first intake compared to 39.3 per cent of those born three months before. Fifty-six per cent of children born four months before the eligibility date enter school in that year compared to 66 per cent of children born five months before. It is important to note in New South Wales that children who start school when first eligible would do so at a younger age than children in any other state born at the same time and this may explain the high rates of delayed entry. In Victoria, the pattern is less pronounced with 52 per cent of those children born in February 2000 (the month before the eligibility date) going to school in the first year they are eligible and 76.2 per cent of those children born in January 2000.
In Queensland a high proportion of children born between October and December 1999 were delayed. The other states and territories have a similar ‘dip’ in the proportion of school entrants who go in the first year eligible with children who are ‘just eligible’ (born in the last month of eligibility). These descriptive data suggest that variation in school entry-age eligibility dates across the states and territories and a child’s date of birth are significant factors in the parental decision of whether to delay their child’s entry to school. Taken together, these figures suggest that, where parents are able to exercise some choice as to the age at which their child will begin school, many seem to prefer their children to start older rather than younger. What Figure 1 is unable to tell us is whether this is because parents are concerned about the absolute age of their child when they begin school or whether they are concerned about their child’s age relative to that of their classmates.
Figure 1. Proportion o
f ch
ildren going to scho
o l in the ye ar the y are firs t eligible by mo nth of bir th a nd sta te
Factors associated with attending school the year the child is first eligible The aim of our multivariate analyses is to model the importance of child and parental characteristics within the context of state and territory school entry age regulations on parental decisions to send their child to school in the year they are first eligible. To capture how the school entry age regulations in different states and territories influence when parents can first send their children to school we construct a variable called ‘on-time entry age’. On-time entry age is the age, measured to the nearest month, that the children could start school if they went in the first year they were eligible.3 This variable is able to more precisely describe the effect of differences in entry age policies than would a state and territory indicator as on-time entry age captures the variation in on-time entry age for children with the same date of birth. This point is illustrated in Figure 2. Here we find the on-time entry age variable for a given birth date differs across states so that in New South Wales a child born in the month of May would be 4.7 years of age when entering school in 2005 while in Victoria they would be 5.7 years of age.
We use probit regression4 to estimate the probability of a child attending school in the year they are first eligible. We include in our estimation sample children resident in Victoria, Western Australia, Tasmania, New South Wales, Queensland and the Australian Capital Territory who did not change residence between the first and second wave of LSAC. If the child did not change states between the waves we can be more confident that they entered school in the state reported in the second wave at which time we are able to more accurately observe their grade progression. Children who went to school early (in the year before they were first eligible) were also excluded from the sample.
3 To construct on-time entry age we infer school starting age from information on the grade progression at Wave 2 and the school term start dates in each state and territory. From this information we can also estimate the earliest age at which the child could commence school or on-time entry age. If the age the child started school is equal to the earliest age at which they could commence school, then they would be considered to be going to school ‘on-time’. If the age the child started school is greater than the earliest age at which they could commence school they would be considered ‘delayed entrants’ and if the age the child began school is less than the earliest age they are eligible to enter school, they are ‘early entrants’.
4 Probit regression is analogous to logistic regression. The only point of difference is that probit regression specifies a normal cumulative density function for the probability of the event where logistic regression specifies a logistic cumulative density function.
Figure 2. On-time entry ages in Victoria and New South Wales by month of birth
We estimate a series of nested probit models. In Model 1 we include the child and family socio-demographic variables. In order to investigate the role of children’s cognitive ability and social and emotional outcomes Model 2 adds child receptive vocabulary ability (PPVT), school readiness (Who Am I?) and measures of pro-social behaviour, hyperactivity, emotional problems, peer problems and conduct problems prior to school entry at age four. Model 3 adds the three temperament measures of sociability, persistence and reactivity in addition to the variables in Model 2. In Model 4 we add on-time entry age. All outcome measures are standardised and represent an estimate of the association between the probability of going to school in the first year eligible and a one standard deviation increase in the score from the sample mean. Table 3 presents the marginal effects associated with each of the explanatory variables described in the previous section. These are statistical estimates of the effect of a one-unit change in the independent variable on the probability of going to school in the first year eligible while holding all other independent variables at their estimation sample means. The standard error of each marginal effect estimate is presented below in parentheses. Although there are many independent variables in Model 1 remarkably few were statistically significant. The probability of a child entering school in the first year eligible is increased by 7.3 per cent percentage points for girls compared to boys. Mother’s English proficiency was also associated with going to school in the first year eligible. Mother’s English proficiency had six categories with the comparator (the omitted variable in the probit regression) being children with mothers where English was their first language. Compared to mothers
whose first language was English, children of mothers where English was not their first language and spoke it very well and children of mothers whose first language was not English and who did not speak English well were more likely to go to school in the year they were first eligible (5.6 per cent and 16.0 per cent percentage points respectively). Children living in non-metropolitan areas were 6 percentage points less likely to go to school in the first year eligible than in metropolitan areas. Children whose fathers earn more were also less likely to attend school in the first year they were eligible.
Only one of the cognitive and social and emotional outcomes at age four years was associated with going to school in the first year eligible. Parents who rated their children as having more emotional symptoms were less likely to go to school in the first year eligible. None of the child temperament scales were statistically significant when added to the model (Model 3) while emotional symptoms ceased to be statistically significant.
In the final model, on-time entry age was statistically significant and had the largest increase in the probability of entering school in the first year eligible. A one-month increase in on-time entry age increased the probability of entering school when first eligible by 3.6 percentage points. In other words, if because of their date of birth— and the state/territory’s school age entry regulations, the earliest eligible school entry age is older, parents are more likely to send their child at the earliest opportunity. The persistence temperament scale was also statistically significant with a one-unit increase in persistence associated with a 1.1 percentage point increase in the likelihood of attending school in the first year eligible.5 Boys, children whose mother’s whose first language was English and those living in a non-metropolitan area were all less likely to go to school when first eligible. Although still statistically significant, the size of the estimates of the marginal effect were smaller than those observed for Model 1.
5 Persistence becomes statistically significant in Model 4 but is not in Model 3 due to an increase in precision in the probit estimate due to a reduction in the standard error between Models 3 and 4.
Table 3. Marginal effects and standard errors of probit models predicting school entry when first eligible
Model 1 Model 2 Model 3 Model 4 Child gender (1= girl) 0.073** 0.050** 0.049** 0.018*
(0.014) (0.016) (0.017) (0.008)
Number of siblings 0.004 -0.006 -0.011 0.007
(0.017) (0.020) (0.022) (0.010)
Number of people in the household 0.007 0.013 0.013 -0.006
(0.016) (0.018) (0.021) (0.009)
Mother’s education (less than Year 12 omitted)
Tertiary academic -0.031 -0.043 -0.033 0.006 (0.022) (0.024) (0.025) (0.011) Tertiary vocational -0.019 -0.022 -0.01 0.01 (0.022) (0.024) (0.025) (0.010) Year 12 or equivalent 0.019 0.022 0.038 0.013 (0.023) (0.025) (0.026) (0.011)
Education not reported 0.057 0.013 0.069 0.039
(0.101) (0.129) (0.112) (0.007)
Father’s education (less than Year 12 omitted)
Tertiary academic -0.008 -0.011 -0.004 -0.008 (0.025) (0.027) (0.028) (0.013) Tertiary vocational -0.016 -0.026 -0.024 -0.015 (0.023) (0.025) (0.027) (0.013) Year 12 or equivalent -0.049 -0.077* -0.077* -0.02 (0.034) (0.039) (0.041) (0.021)
Education not reported 0.005 0.003 -0.012 0.028
(0.061) (0.067) (0.074) (0.019)
Mother’s annual gross income ($100,000) 0.059 0.029 0.058 0.018
(0.035) (0.038) (0.042) (0.032)
Mother’s income missing 0.187 0.155 0.195 0.041
(0.010) (0.133) (0.020) (0.006
Father’s annual gross income ($100,000) -0.041* -0.043* 0.037 0.000
(0.018) (0.019) (0.021) (0.009)
Father’s income missing -0.764 -0.798* -0.762 -0.664
(0.098) (0.041) (0.105) (0.586)
Mother’s English proficiency (omitted English first language)
Very well 0.056* 0.051 0.063* 0.025* (0.022) (0.025) (0.027) (0.009) Well 0.049 0.039 0.038 0.015 (0.038) (0.044) (0.050) (0.018) Not well 0.160* 0.162* 0.151 0.04 (0.029) (0.033) (0.049) (0.006) Not at all -0.074 -0.122 0.011 0.037 (0.131) (0.191) (0.168) (0.014) Missing -0.082 -0.055 -0.075 -0.048 (0.121) (0.126) (0.143) (0.154)
Father’s English proficiency (omitted English first language) Very well 0.02 0.018 0.008 0.013 (0.025) (0.027) (0.030) (0.012) Well -0.008 -0.016 -0.013 -0.016 (0.053) (0.059) (0.064) (0.034) Not well 0.089 0.093 0.072 0.019 (0.069) (0.073) (0.091) (0.036) Missing -0.058 -0.059 0.028 0.017 (0.112) (0.120) (0.125) (0.053)
Two parents in the household -0.038 -0.052 0.021 0.069
(0.092) (0.094) (0.144) (0.151)
Child is Indigenous 0.071 0.072 0.097* 0.016
(0.032) (0.037) (0.037) (0.016)
Non-metropolitan residence -0.060** -0.056** -0.059** -0.031**
(0.014) (0.015) (0.016) (0.008)
Peabody Picture Vocabulary Test -0.013 -0.009 0.001
(0.009) (0.009) (0.004)
Who Am I? 0.01 0.008 0.001
(0.009) (0.010) (0.005)
Child social and emotional outcomes
Pro-social behaviour 0.007 0.006 -0.003 (0.008) (0.009) (0.004) Hyperactivity -0.016 -0.012 -0.004 (0.009) (0.010) (0.005) Emotional symptoms -0.020* -0.018 -0.002 (0.008) (0.009) (0.004) Peer problems 0.002 0.009 -0.004 (0.008) (0.009) (0.004) Conduct problems -0.001 -0.004 0.003 (0.009) (0.010) (0.005) Child temperament Sociability 0.003 0 (0.009) (0.004) Persistence 0.014 0.011* (0.010) (0.005) Reactivity 0.002 -0.002 (0.009) (0.004)
On-time entry age (months) 0.036**
(0.003)
R-square 0.031 0.033 0.032 0.577
Number of observations 3363 2964 2653 2653
Discussion
In this paper we begin to fill the gap in our understanding of the factors associated with delayed primary school entry in Australia using data from the Longitudinal Study of Australian children. We provide the first national estimates of delayed entry to primary school. We estimate that 14.5 per cent of school entrants in 2005 had been delayed from the previous year. The rates of delayed school entry vary markedly between states and territories with New South Wales having particularly high rates of delayed entry (31.3 per cent). Children in New South Wales can go to school younger than in any other state and this may explain this phenomenon.
Our multivariate analysis examined a broader range of factors than has been examined previously (Graue & DiPerna 2000; Malone et al. 2006; Zill, Loomis & West 1997); however, very few were statistically significant predictors of delayed school entry. Among the significant factors influencing parental decision making about delaying a child’s entry to school appears to be their child’s ability to persist at tasks (temperamental persistence). Consistent with previous studies (Graue & DiPerna 2000; Malone et al. 2006), we also find boys are more likely to be delayed entrants. The decision to delay a child’s entry to school is also more likely if English was the mother’s first language or if the family lives in a non-metropolitan area. However, the most important factor was the state and territory entry age policies captured by on-time entry age, the age that a child could start school if they went in the first year they were eligible. In our final and preferred model, on-time entry age was associated with the largest increase in the probability of going to school at the first available opportunity: if a child is younger at the earliest point they are eligible to attend school in their state/territory, they are more likely to be held back for one year by their parents.
What implications do these findings have for the school entry eligibility criteria in states and territories? Our findings suggest that education departments’ entry age regulations are important. To the extent that state education authorities allow parents to delay their children’s entry to school after the first eligible intake, it is those whose children would begin school prior to their fifth birthday that are the most likely to exercise this option. The bottom panel of Figure 3 shows that most parents in New South Wales who could send their children to school before they turn five delay until the next year. The grey line in the top panel shows that this practice ensures that these children are, on average, much older than they would have been had they entered school when first eligible as depicted by the black line. These results suggest that any future change to school entry policies that involves a change in the eligibility date must consider how parents will respond to the policy change. It is possible that a change in the eligibility date that markedly decreases the age when parents can first send their child to school may in fact result in an increase in the average entry age of children if parents respond with increased rates of delayed entry.
Figure 3. On-time entry age, actual entry age and proportion of children going to school in the year they are first eligible by month of birth for New South Wales
Conclusion
With recent moves by the state and territory governments to ensure that all children receive a minimum number of years of education (Council of Australian Governments 2009) in preference to minimum leaving ages, changes in school entry policies are unlikely to directly result in fewer years of education for delayed entrants that Deming and Dynarski (2008) have observed in the United States. If it is the case that Australian children who begin school when they are older receive the ‘gift of time’, and that this early advantage persists into later years, then school entry policies may indirectly influence the educational outcomes of these children.
This paper emphasises the role that parental decision making plays, within the context of school entry policies, in determining which children receive this ‘gift’. More importantly it illustrates some of the complex challenges for policy makers in this area. Any changes to school entry age policy need to carefully consider how parents might respond to the policy change. The evidence from New South Wales suggests that a policy reform that lowers the earliest eligible entry age to below five years is likely to result in a higher average entry age as parents respond by delaying their child’s entry to school. Extending the time when the children have to start school also has significant implications as this may result in increased costs of childcare (for parents and for society in the form of subsidies) or the ability of both parents to work if they choose. Any policy decisions need to consider the factors we
have identified in parental decision making to minimise the possibilities of unintended consequences of such a policy change.
ACKNOWLEDGMENTS
This paper uses unit record data from Growing Up in Australia, the Longitudinal Study of Australian Children. The study is conducted in partnership between the Department of Families, Housing, Community Services and Indigenous Affairs (FaHCSIA), the Australian Institute of Family Studies (AIFS) and Australian Bureau of Statistics (ABS). The findings and views reported in this paper are those of the author and should not be attributed to the FaHCSIA, AIFS or the ABS. The authors would like to thank Daryl Higgins and the three anonymous referees for insightful comments on earlier drafts.
REFERENCES
Australian Council for Educational Research 1999, ‘Who Am I?’, Australian Council for Educational Research, Melbourne.
Angrist, J. & Krueger A. 1991, ‘Does compulsory school attendance affect schooling and earnings?’, Quarterly Journal of Economics, vol. 106, no. 4, pp. 979–1014.
Angrist, J.D. & Krueger, A.B. 1992, ‘The effect of age at school entry on educational attainment: An application of instrumental variables with moments from two samples’,
Journal of the American Statistical Association, vol. 47, no. 418, pp. 328–336.
Alexander, R., Armstrong, M., Flutter, J., Hargreaves, L., Harrison, D., Harlen, W., Hartley-Brewer, E., Kershner, R., Macbeath, J., Mayall, B., Northern, S., Pugh, G., Richards, C. & Utting, D. 2009, Children, Their World, Their Education: Final Report and Recommendations of the Cambridge Primary Review, Routledge, London.
Atelier Learning Solutions & Access Economics 2006, Cost/Benefit Analysis Relating to the Implementation of a Common School Starting Age: Final Report, Volume 1, Report prepared for the Ministerial Council on Education, Employment, Training and Youth Affairs.
Bedard, K. & Dhuey, E. 2006, ‘The persistence of early childhood maturity: International evidence of long-run age effects’, Quarterly Journal of Economics, vol. 121, no. 4, pp. 1437–1472. Biddulph, S. 1998, Raising Boys, Finch, Sydney.
Bound, J., Jaeger, D. & Baker, R. 1995, ‘Problems with instrumental variables estimation when the correlation between the instruments and the endogenous explanatory variable is weak’, Journal of American Statistical Association, vol. 90, no. 430, pp. 443–450.
Cascio, E. & Schanzenbach, D.W. 2007, First in the class? Age and the education production function, NBER Working Paper No. 13663, National Bureau of Economic Research, Massachusetts.
Council of Australian Governments 2009, Early Childhood Development, Council of Australian Governments, Canberra [Online], Available:
http://www.coag.gov.au/coag_meeting_outcomes/2009-07-02/ [2011, Jan 31]. Deming, D. & Dynarski, S. 2008, ‘The lengthening of childhood’, Journal of Economic
Dunn, L. & Dunn, D. 1997, Peabody Picture Vocabulary Test, 3rd edn (PPVT-III) Form IIA, English edition, American Guidance Service Publishing.
Elder, T.E. & Lubotsky, D.H. 2009, ‘Kindergarten entrance age and children’s achievement: Impacts of state policies, family background, and peers’, Journal of Human Resources, vol. 44, no. 3, pp. 641–683.
Fredriksson, P. & Ockert, B. 2005, Is early learning really more productive? The effect of school starting age on school and labour market performance, Discussion Paper No. 1659, Institute for the Study of Labor (IZA), Bonn.
Goodman, R. 1997, ‘The strengths and difficulties questionnaire: A research note’, Journal of Child Psychology and Psychiatry, vol. 38, no. 5, pp. 581–586.
Graue, M.E. & DiPerna, J. 2000, ‘Redshirting and early retention: Who gets the “gift of time” and what are its outcomes?’, American Educational Research Journal, vol. 37, no. 2, pp. 509–534.
Harrington, M. 2008, Preschool education in Australia, Background Note, Parliamentary Library, Parliament of Australia [Online], Available:
http://www.aph.gov.au/library/pubs/bn/2007-08/PreschoolEdAustralia.htm [2011, Jan 17]. Leigh, A. & Ryan, C. 2008, ‘Estimating returns to education using different natural
experiment techniques’, Economics of Education Review, vol. 27, no. 2, pp. 149–160. Malone, L.M., West, J., Flanagan, K.D. & Park, J. 2006, The Early Reading and Mathematics
Achievement of Children Who Repeated Kindergarten or Who Began School a Year Late, US Department of Education, National Center for Education Statistics, Washington DC
[Online], Available: http://nces.ed.gov/pubsearch/pubsinfo.asp?pubid=2006064 [2011,
Jan 16].
Peck, B. & Trimmer, K. 1995, ‘The late birthday effect in Western Australia’, Issues in Educational Research, vol. 5, no. 1, pp. 35–52.
Sanson, A., Prior, M., Smart, D. & Oberklaid, F. 1993, ‘Gender differences in aggression in childhood: Implications for a peaceful world’, Australian Psychologist, vol. 28, no. 2, pp. 86–92. Zill, N., Loomis, L.S. & West, J. 1997, The Elementary School Performance and Adjustment of
Children Who Enter Kindergarten Late or Repeat Kindergarten: Findings from National Surveys, (NCES 98–097), US Department of Education, National Center for Education Statistics, Washington DC [Online], Available: