of Foreign Direct Investment
著者
TAMURA Akiko
出版者
Institute of Comparative Economic Studies,
Hosei University
journal or
publication title
Journal of International Economic Studies
volume
32
page range
13-23
year
2018-03
Firms’ Investment Strategies and the Choice of
Foreign Direct Investment
Akiko Tamura
Hosei University
Abstract
In this paper, I examine firms’ choice to undertake foreign direct investment (FDI) using the theoretical framework of Antràs and Helpman [2004]. I clarify that more headquarter-intensive firms choose to undertake FDI, whereas less headquarter-intensive firms choose outsourcing. I use the strategic types of Miles and Snow to examine firm heterogeneity. Using the analyses of mail surveys of Japanese manufacturing firms in Shimizu and Tamura [2010] and Shimizu and Tamura [2013], I find that prospectors are more headquarter intensive than defenders, whereas analyzers fall in between these types. Thus, prospectors may choose to undertake FDI more than do defenders. From the mail survey of Shimizu and Ando [2011], prospectors perform FDI more aggressively than defenders, which is consistent with the theoretical analysis.
Keywords: Foreign direct investment, Firm heterogeneity, Miles and Snow strategic types
JEL classification: F21, F23, O31
1. Introduction
Melitz [2003] developed the so called “new-new trade theory” regarding firm heterogeneity, which analyzed what kind of firms choose to undertake foreign direct investment (FDI) when they decide to sell their products overseas. Traditionally, many international economics textbooks (for example, see Helpman [2011]) utilized the eclectic theory of Dunning, which states that firms require ownership advantages, location advantages and internalization advantages to choose FDI. Moreover, there are traditionally two purposes of FDI: horizontal FDI aims at supplying goods to the host country, whereas vertical FDI divides a production process, such that some of it occurs overseas, and final goods are imported from an overseas affiliated firm. Recently, a third pattern of FDI, complex integration, in which the aim is to export to a third country, the export platform, has been recognized and analyzed.
In Melitz [2003], firms that differ according to productivity choose to either sell their goods only in the domestic market, export, or undertake FDI (subsidiary sales are defined as horizontal FDI). In choosing between the three potential actions, the most important point is that the fixed costs required are highest for FDI (FH), followed by exporting (FX), with the lowest fixed costs for domestic
sales (FD). On the other hand, assume that the domestic wage is higher than the foreign wage, and
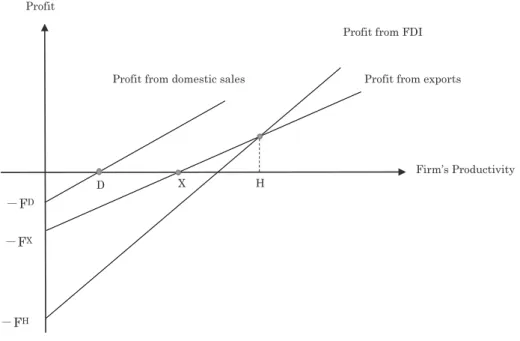
consider a trade cost such as the transport cost. In this case, the unit cost for exporting is highest, followed by domestic sales, and FDI has the lowest unit cost. Figure 1 illustrates the choice of
activity by the heterogeneous firm with regard to domestic sales, exports, or FDI. The higher fixed cost associated with FDI results in a lower intercept for the profit line (FH > FX > FD), whereas the
slope of the profit line for exporting is flatter, and the slope of the profit line for FDI is steeper.
FD FX
FH
Profit from domestic sales
Profit from FDI
Profit from exports
Firm’s Productivity Profit
D X H
Figure. 1 Firms’ choice of domestic sales, exports, and FDI
Figure 1 shows that firms with productivity lower than D will withdraw from the market, firms with productivity between D and X only sell in the domestic market, firms with productivity between X and H will sell in the domestic market and export, and finally, firms with productivity higher than H will sell in domestic markets and invest in subsidiaries overseas. These results are confirmed by many empirical studies using firm-level data, including Tomiura [2007], who found that the productivity of Japanese firms that undertake FDI is higher than that of Japanese firms that only supply to the domestic market or export.
The analysis of vertical FDI has combined the trade model with differentiated goods and the difference in factor composition (see, for example, Helpman [1984]). The production process is decomposed into manufacturing and headquarter services, such as management and research and development (R&D), and it is assumed that factor intensity differs between the two sectors. Then, firms in a capital-abundant country locate their capital-intensive headquarter service in their home country and their labor-intensive manufacturing components in labor-abundant foreign countries. This framework suggests that the FDI strategy of firms will be affected by the difference in factor composition among countries.
Therefore, firm heterogeneity, whether with regard to productivity or the factor intensity of sectors, is key to the choice regarding FDI. Rather than focusing on heterogeneity in productivity, this paper considers firm heterogeneity in terms of differences in the firms’ investment strategies or management style in adapting to changes in the business environment, such as market competitiveness,
complexity, or uncertainty. Miles and Snow [1978] consider four strategic types of firms: defenders, prospectors, analyzers, and reactors, based on the firms’ adaptive behavior in response to the business environment. I clarify the differences in investment strategies and investment management for these four strategic types, using the results of Shimizu and Tamura [2010] and Shimizu, Oura, and Tamura [2012]. Then, I analyze the attitude of the four firm types toward FDI.
I adapt the theoretical framework introduced by Antràs and Helpman [2004] that involves the firm’s organizational decision of the internalization. Antràs and Helpman [2004] assume that differentiated goods are produced by a combination of headquarter services and production sectors, and that a firm’s intensiveness of headquarter services affects its decision regarding FDI. I consider the differences in the firms’ investment strategies and management according to the strategic types of Miles and Snow and how these relate to the intensity of headquarter services. Then, I verify the theoretical results regarding firms’ FDI decisions using the survey of Japanese manufacturing firms by Shimizu and Ando [2011].
The remainder of the paper is structured as follows. In Section 2, I adapt the theoretical model by Antràs and Helpman [2004] and analyze how the share of headquarter services affects a firm’s FDI decision. In Section 3, I introduce the strategic types of Miles and Snow, who analyze the difference in firms’ adaptation behaviors in response to their business environments, as the source of firm heterogeneity. Then, I summarize the investment strategy and investment management of each of the strategic types. In Section 4, I analyze the difference in firms’ FDI decisions based on the strategic types, and verify the results using the survey of Japanese manufacturing firms by Shimizu and Ando [2011]. Finally, in Section 5, I summarize my results and present future research possibilities.
2. The FDI Decision and the Production Share of Headquarter Services
In this section, I analyze how the production share of headquarter services, which include management and R&D, affects firms’ decisions regarding FDI. The firms’ differentiated goods (i) are produced by the headquarter services (h(i)) and by the manufacturing components (m(i)). X is aggregated consumption and I assume a Cobb–Douglas production function 1:
X[ ]x i di , 0 1 1 1 1 = #
] g
a a a , 0 h i m i i x 1 1 1 1 1 =i h -h h h -h]
g
<]
g
F <]
g
Fwhere the larger parameter η indicates more headquarter-intensive goods, θ denotes a productivity parameter, and the elasticity of substitution between the two goods is 1 / (1-α).
There are home (N) and foreign (S) countries, and the headquarter services can be produced only in the home (N) country, whereas the manufactured components can be produced in both the home (N) and the foreign (S) countries with one unit of labor. The wage is higher in the home country than in the foreign country (WN > WS). Firms in the home country can choose integration or
outsourcing in the home or foreign country. Outsourcing in the foreign country refers to import
components and integration in the foreign country refers to FDI. I assume that the fixed cost of integration (fVN, fVS) is higher than the fixed cost of outsourcing (fON, fOS) and that the fixed cost of
integration or outsourcing in the foreign country is higher than these fixed costs at home. Therefore, fVS > fOS > fVN > fON. These assumptions reflect the fact that integration requires a restructuring of the
organization, which involves high management costs, and that there will also be higher R&D or monitoring and communication costs in the foreign country.
Firms pay a fixed cost in terms of domestic wages ( > > > ) and choose outsourcing or integration. The variable unit cost in the home country is higher than that in the foreign country, which reflects the difference in wages. In addition, I assume that the variable unit cost of integration is lower than that of outsourcing.
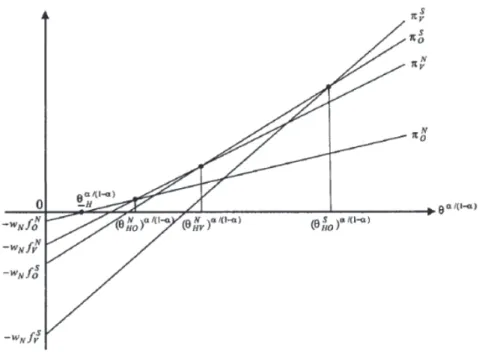
Figure 2 illustrates the equilibrium in the headquarter-intensive sector, showing the profit of each organizational form ( , , , ) as a function of the productivity parameter ( ).
Source: Antràs and Helpman [2004] p. 567.
Figure 2. Equilibrium in the headquarter-intensive sector
The intercepts of the profit lines reflect the assumptions regarding fixed costs ( > > > ), and the slopes of the profit lines reflect the assumptions regarding variable costs (slope of > slope of > slope of > slope of ). Figure 2 shows that the least productive firms exit from the market. Then, as the productivity of firms increases, they choose domestic outsourcing, followed by domestic integration, then foreign outsourcing and, finally, for the most productive firms, foreign integration (FDI).
Further, Antràs and Helpman [2004] show that firms that are more headquarter service intensive (higher η) choose FDI. This is because the gain from internalization is higher if the production share of headquarter services is high, as reflected in incomplete contracts for headquarter service. On the other hand, firms that are more intensive in relation to manufactured components (lower η) choose
outsourcing. This is because outsourcing gives more incentives to the manufactured components supplier. Therefore, in the produced-components-intensive sector, the more productive firms choose outsourcing overseas and the less productive firms choose domestic outsourcing.
3. Miles and Snow Strategic Types and Investment Management
Miles and Snow [1978] outline a theory in which each firm determines an investment strategy that involves adapting to the business environment and implementing investment management. They consider that organizations fall into four environmental adaptation types (strategic types), which they term the defender, the prospector, the analyzer, and the reactor.
The first type, the defender, limits its operational area to a relatively narrow product market and establishes its solid status, with the improvement of efficiency and cost competitiveness as its most important goals. In contrast, the prospector constantly searches for market opportunities to obtain profits, aggressively creates change and uncertainty, and develops new products and markets. The third type, the analyzer, establishes its solid status in existing product markets but also searches for market opportunities that it can pursue using its existing technology and it rapidly seizes these if they appear promising. The final type, the reactor, cannot adapt to the business environment; rather, it merely reacts to environmental change and lacks consistent organizational activity. The reactor strategy results in firms failing to function properly.
Shimizu and Tamura [2009] research the investment processes and management of each strategic type using a mail survey of Japanese firms, which was conducted in 2009. The mail survey, sent to a sample of Japanese manufacturing firms, requested the firms to respond concerning capital investment for their main product. The questionnaires were mainly addressed to the management planning sections of 853 Japanese manufacturing firms listed on the First Section of the Tokyo Stock Exchange. The response rate to the survey was 11.72% (100 of the 853 companies). Using a chi-squared test, Shimizu and Tamura [2009] confirm that the respondent firms’ distribution by industry is comparable to all manufacturing firms listed on the First Section of the Tokyo Stock Exchange. In addition, firm scale (total assets and capital stock) is compared across respondent and non-respondent firms, and no significant difference is found.
To classify the respondent firms into four strategic types, I adopt the measurement of strategic types by DeSalbo et al. [2005], described below. To begin, we prepared 11 questions that expanded on Miles and Snow’s [1978] adaptive-cycle model. Then, we constructed four distinct response options characterizing the four possible strategic types (defender, prospector, analyzer, and reactor) for each of the 11 questions. Next, as a basic rule, the sample firms were classified into one of the four strategic types depending on the response option selected most often. For instance, we classified the firm as a defender if it most often chose defender response options. However, if the number of response options was tied between defender, prospector, and/or analyzer response options, the firm was classified as an analyzer, whereas if there was a tie involving reactor response options, the firm was classified as a reactor.
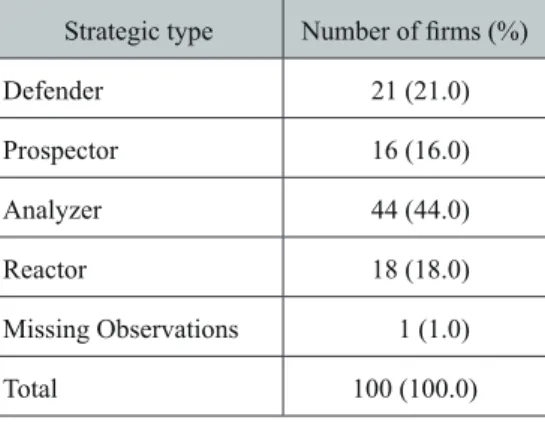
Table 1 provides the results of the classification of the respondent firms using the procedure described. As shown in Table 2, the largest number of firms are analyzers, followed by defenders, and then prospectors 2.
2 We were unable to classify one firm because it did not respond to all of the questions in the survey. This reduced our sample size to 99 firms.
Table 1. Results of the classification of strategic firm types using the mail survey conducted in 2009
Strategic type Number of firms (%) Defender 21 (21.0) Prospector 16 (16.0) Analyzer 44 (44.0) Reactor 18 (18.0) Missing Observations 1 (1.0) Total 100 (100.0)
Source: Shimizu and Tamura [2010].
Shimizu and Tamura [2010] and Shimizu and Tamura [2013] summarized the differences in investment processes for each strategic type as follows3. The defenders focus on efficiency and
improving cost competitiveness to maintain a stable status in their domain. They conduct plant investment as operational investments in that context. Therefore, defenders seldom enter new business areas via strategic investment but only repeat their operational investments. The prospector always searches for new business opportunities and pioneers entry to a business area, selected because it is expected to yield large profits. Thus, prospectors are always considering strategic investments and carefully compare the alternative projects available. As they consider entering new businesses as pioneers, they make new business investments. The analyzers succeed in strategic investment across multiple business domains, and repeat operational investments. They may obtain some of their business by imitating the actions of prospectors or through mergers and acquisitions. They search for a business area that they can enter by combining it with the technology of the existing business. Therefore, the analyzers deliberate carefully and invest in determining the optimum timing to seize market opportunities using their existing technology.
Shimizu, Oura, and Tamura [2015] investigate how the consistency between a firm’s business strategy and its investment management efforts affects business performance, controlling for market environment factors such as complexity, competition, and uncertainty. Again, this study uses the mail survey conducted in 2009, but it measures the intensity of the strategic type for each respondent firm by counting the responses for each strategic type, rather than classifying the firms into the four strategic types. For instance, if a firm responds to the 11 questions of DeSalbo et al. [2005], and chooses six defender response options, four analyzer response options and one prospector response option, then the firm is considered to have defender tendencies (= 6), analyzer tendencies (= 4), and prospector tendencies (= 1). We measure business performance using the five-year average return on total assets (ROA) from 2005 to 2009.
Table 2. The regression results for the interaction between strategic type and investment management
Note: Figures in parentheses are t-statistics. The symbols *, **, and *** indicate significance at the 10%, 5%, and 1% levels, respectively. The dependent variable is the five-year average return on total assets (ROA) from 2005 to 2009.
Source: Shimizu, Oura,, and Tamura [2015].
7.02 ** 5.41 7.16 ** 5.91 (1.924) (1.442) (2.031) (1.589) 2.27 *** 2.29 2.38 *** 2.27 (3.2) (3.083) (3.356) (3.018) -1.36 ** -1.24 -1.49 ** -1.27 (-2.351) (-2.103) (-2.58) (-2.134) -0.62 -0.57 -0.73 -0.67 (-1.182) (-1.077) (-1.382) (-1.233) -0.13 0.02 -0.09 0.00 (-0.423) (0.053) (-0.297) (-0.014) -0.33 -0.41 -0.49 -0.21 (-0.756) (-0.9) (-0.759) (-0.317) -0.14 0.05 (-0.536) (0.184) 0.66 ** 1.25 *** (2.393) (3.109) 0.09 0.10 (0.391) (0.455) -0.31 -0.68 * (-1.227) (-1.689) Adjusted R2 0.138 0.092 Adjusted R2 0.168 0.102 Uncertainty Prospector tendency Constant Complexity Competition Uncertainty Defender tendency
(Link with medium/long-term plan) * (Defender tendency)
Prospector tendency
(Investment timing) * (Prospector tendency)
Defender tendency
**
(Link w medium/long-term plan) * (Prospector tendency)
***
Link with medium / long-term plan Industry average of ROA ** *** Industry average of ROA Investment timing (Investment timing) * (Defender tendency) Constant Complexity Competition 7.70 ** 7.64 7.34 ** 7.98 (2.098) (2.056) (2.024) (2.228) 2.17 *** 1.87 2.27 *** 2.40 (3.029) (2.564) (3.151) (3.36) -1.55 ** -1.29 -1.45 ** -1.59 (-2.629) (-2.205) (-2.512) (-2.825) -0.67 -0.65 -0.73 -0.82 (-1.26) (-1.228) (-1.372) (-1.594) -0.08 -0.07 -0.09 -0.15 (-0.256) (-0.245) (-0.279) (-0.505) 0.49 0.42 -0.55 -0.59 (0.755) (0.655) (-1.241) (-1.381) -0.05 -0.11 (-0.191) (-0.42) 0.83 * 0.55 * (1.901) (1.959) 0.15 -0.08 (0.673) (-0.355) -0.84 -0.78 (-2.116) (-3.19) Adjusted R2 0.117 0.122 Adjusted R2 0.124 0.175 Constant Complexity Competition Uncertainty Complexity Constant Industry average of ROA Prior profitability check
(Prior profitability check) * (Defender tendency)
(Prior profitability check) * (Prospector tendency) Defender tendency Prospector tendency *** *** *** ** ** ** ** ** Industry average of ROA Post-investment profitability check
(Post profitability check) * (Defender tendency)
(Post profitability check) * (Prospector tendency)
Defender tendency
Prospector tendency Uncertainty Competition
Table 2 shows the regression results investigating the interaction effect between strategic type and investment management. I found that a prior and post profitability check and setting and the timing in the investment plan have a positive effect on ROA for defender firms. Conversely, a prior and post profitability check and timing in the investment plan have a negative effect on ROA for prospector firms. Thus, investment management involving planning and control works well for defenders, but not for prospectors. This may be because a “thinking while running” type of planning is suitable for prospector firms, whereas planning and control management methods may harm their performance.
4. The Strategic Types and Choice of FDI
How do the differences in the firms’ investment process and management, based on the strategic types of Miles and Snow, affect firms’ decisions to implement FDI? According to Antràs and Helpman [2004], the intensiveness of headquarter services relative to the production components has an important role in the selection of FDI. Thus, I will consider the difference in the headquarter services of three of the strategic types of Miles and Snow, the defenders, prospectors, and analyzers.
As noted above, the defenders focus on efficiency and improving cost competitiveness to maintain a stable status, and seldom enter new business arenas via strategic investment, preferring to repeat operational investments. Therefore, in their businesses, they will place only a small weight on headquarter services that involve R&D or monitoring costs to develop new markets. In contrast, prospectors are always searching for new business opportunities and making new business investments. Thus, they will spend a great deal on R&D to develop new products or new business opportunities. In addition, they are likely to consider investment management highly important as they carefully compare alternative projects available. The third strategic type, analyzers, may obtain some new businesses through mergers and acquisitions or by imitating the actions of prospectors. They search for business areas to enter by combining them with the technology used in the existing business, and invest in determining the optimum timing to seize market opportunities using their existing technology. Therefore, they do place weight on R&D and incur management costs, but less so than prospectors, who are pioneers.
Thus, the prospectors will have the highest share of headquarter services, defenders will have the lowest, and analyzers will fall in between. In terms of the model presented in Section 2, η(the Prospector) >η(the Analyzer) >η(the Defender). According to the theoretical results of Antràs and Helpman [2004], more headquarter services-intensive firms perform more FDI, indicating that the prospectors choose to undertake more FDI, whereas the defenders choose the lowest levels of FDI, and the analyzer’s levels of FDI will fall in between these extremes.
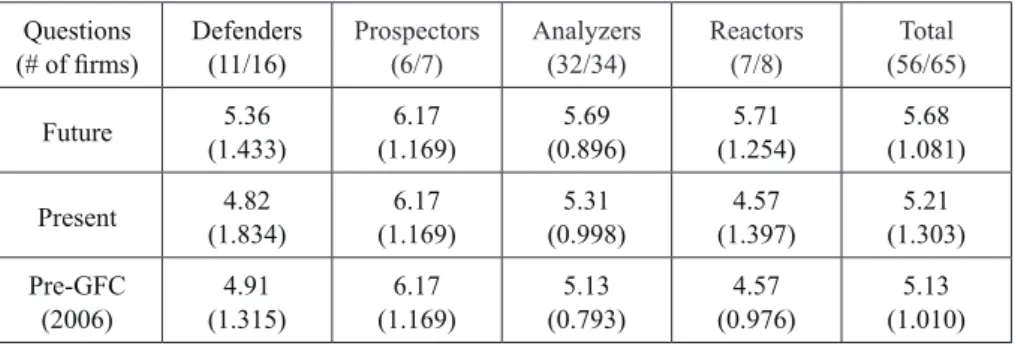
Shimizu and Ando [2011] sent a mail survey to 853 Japanese manufacturing firms listed on the First Section of the Tokyo Stock Exchange in 2011, asking them their attitude toward and the purpose of their FDI, as well as asking the 11 questions by DeSalbo et al. [2005] to classify the firms into four strategic types. A total of 65 firms responded to their survey in 2011. Using the method of DeSalbo et al. [2005], they classified 16 of the firms as defenders, 7 as prospectors, 34 as analyzers, and 8 as reactors. In total, 56 firms carried out FDI and nine firms produced only in Japan. Table 3 compares the respondent firms’ attitudes toward FDI in three periods: the present, the future, and in 2006, prior to the global financial crisis, by the firms’ strategic types. Their attitudes to FDI are measured on a seven-point Likert scale (where 1 = withhold investment and 7 = invest aggressively). Thus, a higher number means that the firm aggressively pursues and performs more FDI.
Table 3. Firms’ attitudes toward FDI: Average for the strategic type Questions
(# of firms) Defenders(11/16) Prospectors(6/7) Analyzers(32/34) Reactors(7/8) (56/65)Total Future (1.433)5.36 (1.169)6.17 (0.896)5.69 (1.254)5.71 (1.081)5.68 Present (1.834)4.82 (1.169)6.17 (0.998)5.31 (1.397)4.57 (1.303)5.21 Pre-GFC
(2006) (1.315)4.91 (1.169)6.17 (0.793)5.13 (0.976)4.57 (1.010)5.13 Note: Figures in parentheses are standard errors.
Pre-GFC: prior to the global financial crisis Source: Shimizu and Ando [2011] mail survey.
Table 3 shows that the prospectors more aggressively perform FDI compared with the analyzers, and that the defenders have quite a negative attitude toward FDI. The prospectors’ attitudes toward FDI are the same for the present, future, and past (2006), whereas the defender and the analyzer indicate that they would consider more FDI in the future. These results, indicating that the prospectors perform more FDI than do the defenders and that the analyzers are in between, are consistent with the implications of the theoretical results of Antràs and Helpman [2004].
The firms were also asked about the purposes of their FDI, again using a seven-point Likert scale, where a higher number indicates that firms put more weight on the specified purpose for FDI (1 = do not agree at all, 5 = strongly agree).
Table 4. The purposes of FDI: Average for the strategic type
Questions Defenders(11/16) Prospectors(6/7) Analyzers(32/34) Reactors(7/8) (56/65)Total Production base:
Sell in host country (1.362)5.36 (2.041)5.83 (1.388)5.59 (2.225)4.43 (1.582)5.43 Production base:
Export to third country (1.375)3.91 (1.602)5.17 (1.685)4.00 (1.902)3.57 (1.656)4.05 Production base:
Export to Japan (1.368)2.55 (1.095)5.00 (1.785)2.91 (1.254)3.29 (1.702)3.11 R&D base (1.272)2.00 (2.483)3.83 (1.745)2.39 (1.604)2.71 (1.773)2.51 Sales base (1.272)4.27 (2.074)4.50 (1.814)4.50 (1.574)4.14 (1.682)4.41 Note: Figures in parentheses are standard errors.
Source: Shimizu and Ando [2011] mail survey.
Table 4 presents the firms’ perceptions of the purpose of FDI based on each strategic type. In the table, “production base: sell in host country” and “sales base” refer to horizontal FDI, “production base: export to Japan” refers to vertical FDI, and “production base: export to third country” refers to complex integration. “R&D base” indicates FDI in the headquarter services.
purposes relating to “production base: sell in host country” and “sales base”, indicating that more firms perform horizontal FDI. After horizontal FDI, the next most common purpose is “production base: export to third country”. A smaller number of firms chose the purpose “production base: export to Japan” and very few firms chose “R&D base”, which is in line with the predictions of the theoretical model.
The prospectors responded with higher numbers for every FDI purpose, and even gave high numbers on the Likert scale to “production base: export to third country” and “production base: export to Japan”. The defenders responded with lower numbers, although they did respond with a relatively high number for horizontal FDI, that is, for the purpose categories of “production base: sell in host country” and “sales base”. The analyzers’ responses were in between those of the prospectors and the defenders for every specified purpose of FDI.
5. Conclusion
In this paper, I examine firms’ choices regarding FDI, using the framework of the Miles and Snow strategic types to represent firm heterogeneity. Using the theoretical framework of Antràs and Helpman [2004], I clarify that more headquarter-intensive firms choose to undertake FDI, whereas firms that are less headquarter intensive choose outsourcing rather than FDI. Based on the analyses of mail survey data on Japanese manufacturing firms in Shimizu and Tamura [2010] and Shimizu and Tamura [2013], I find that prospectors are more headquarter intensive than defenders, and that analyzers fall in between. Thus, prospectors may choose to undertake FDI more compared with defenders. Based on the mail survey of Shimizu and Ando [2011], I find that prospectors perform FDI more aggressively than defenders, which is consistent with the theoretical analysis.
Finally, I identify a number of possible future research topics. Although many Japanese firms are classified as analyzers, I was unable to extract the investment strategies for analyzer firms. This is because the characteristics of analyzer firms are a mix of two different strategic types, namely the defender and the prospector. In future research, we aim to construct precise concepts concerning the analyzers.
Shimizu, Oura, and Tamura [2015] revealed that the management style that many firms adopt is not necessarily appropriate for improving their performance and, in fact, may harm performance. Another interesting topic for the future is to investigate how firms’ FDI strategies improve their competitiveness.
Further, my study has limitations in that the analysis of the Miles and Snow strategic types uses survey data. In future research, it will be important to attempt the classification of firm strategic types using financial data.
Acknowledgment
This paper is supported by JSPS Grants-in-Aid for Scientific Research (KAKENHI) Grant Numbers 16K03668 and 17H04550.
References
Antràs and Helpman [2004] “Global Sourcing”, Journal of Political Economy, 112: 552-580 Conant, Mokwa, and Varadarajan [1990] ”Strategic Types, Distinctive Marketing Competencies and
Organizational Performance: A Multiple Measures Based Study”, Strategic Management Journal, Vol. 11, No. 5: 365-383.
DeSarbo, Benedetto, Song and Sinha [2005] “Revisiting The Miles and Snow Strategic Framework: Uncovering Interrelationships between Strategic Types, Capabilities, Environmental Uncertainty, and Firm Performance”, Strategic Management Journal, Vol. 25, No. 1: 47-74 Grossman, Helpman and Szeidl [2006], “Optimal Integration Strategies for the Multinational Firm”,
Journal of International Economics, 70 : 216-238
Helpman [1984]“A Simple Theory of International Trade with Multinational Corporations”, Journal of Political Economy 92 : 451-471
Helpman [2011] Understanding Global Trade, Belknap Press
Melitz [2003] “The Impact of Trade on Intra-Industry Reallocations and Aggregate Industry Productivity”, Econometrica, 71 : 295-316
Miles and Snow [1978] Organizational Strategy, Structure and Process, McGrow-Hill
Shimizu and Ando [2011] “Setsubi-Toshi Management no Jittai Chosa (Survey of Investment Management)” in Japanese, Waseda University and Develop Bank of Japan.
Shimizu, Oura, and Tamura [2015] “Capital Investment Management, Business Strategy, and Firm Performance”, Proceedings in 8th Conference on Performance Measurement and Management Control, Vol. 8: 1-20
Shimizu and Tamura [2013] “Business Strategy and the Management Control Process in Capital Budgeting”, Proceedings in 7th Conference on Performance Measurement and Management Control, Vol. 7: 1-24
Shimizu and Tamura [2010] “Nihon Kigyo no Setsubi-Toshi Management (Investment Management of Japanese Firms)” in Japanese, Kigyo-Kaikei (Coorporate Accounting), 62, No. 8, 9, 10, 11. Tomiura [2007] “Foreign Outsourcing, Exporting, and FDI: A Productivity Comparison at Firm