E M P L O Y M E N T
M. GRAY, B. HUNTER AND N. BIDDLE
Centre for
Aboriginal Economic
Policy Research
ANU College of
Arts & Social
The Centre for Aboriginal Economic Policy Research (CAEPR) undertakes high-quality, independent research to further the social and economic development and empowerment of Indigenous people throughout Australia. For over 20 years CAEPR has aimed to combine academic and teaching excellence on Indigenous economic and social development and public policy with realism, objectivity and relevance.
CAEPR is located within the Research School of Social Sciences in the College of Arts & Social Sciences, at The Australian National University (ANU). The Centre is funded from a range of sources including the ANU, the Australian Research Council, industry and philanthropic partners, and Australian, State and Territory government departments.
CAEPR maintains a substantial publications program. The Topical Issues series presents brief items from CAEPR staff relating to contemporary issues and debates in Indigenous affairs. They are available in electronic format only for free download from CAEPR’s website:
caepr.anu.edu.au
As with all CAEPR publications, the views expressed in this Topical Issue are those of the author(s) and do not reflect any official CAEPR position.
Professor Matthew Gray Director, CAEPR Research School of Social Sciences College of Arts & Social Sciences The Australian National University August 2014
The economic and social
benefits of increasing
Indigenous employment
M. Gray, B. Hunter and N. Biddle
Matthew Gray is Director, Boyd Hunter is a Senior Fellow and Nicholas Biddle is a Fellow, Centre for Aboriginal Economic Policy Research;
e-mail: matthew.gray@anu.edu.au
Topical Issue No. 1/2014
An electronic publication downloaded from <caepr.anu.edu.au>.
For a complete list of CAEPR Topical Issues, see
<caepr.anu.edu.au/publications/ topical.php>.
Centre for Aboriginal Economic Policy Research
Research School of Social Sciences College of Arts & Social Sciences The Australian National University
Acknowledgments
This paper was produced as part of a research program funded by the Australian Government Department of the Prime Minister and Cabinet. The views expressed in this paper are those of the authors and may not reflect those of the Department of the Prime Minister and Cabinet or the Australian Government. Research assistance was provided by Monica Howlett. The authors are grateful to Andrew Podger, John Taylor and Mandy Yap for comments on an earlier version of this paper.
Acronyms
ANU The Australian National University
CAEPR Centre for Aboriginal Economic Policy Research
CDEP Community Development Employment Projects
HILDA Household, Income and Labour Dynamics in Australia
Introduction
R
elatively low rates of employment are one of the reasons for many of the poor economic and social outcomes experienced by Indigenous Australians. Increases in the rate of Indigenous employment would result in significant economic gains to the individuals who move into employment, and their families and communities, to the government who would receive higher tax revenues and have lower social security outlays, and the economy as a whole via the increases in the effective labour supply. The existing research also finds that there are health and social benefits that flow from paid employment (e.g. Biddle 2011; Hunter & Gray 2013).This paper, using the latest available data and research, provides estimates of the likely economic and social benefits of increasing Indigenous employment to the same level as in the non-Indigenous population (i.e. closing the employment gap).1 It was commissioned by
the Department of the Prime Minister and Cabinet to help inform the work of the Indigenous Jobs and Training Review chaired by Andrew Forrest.
Benefits of employment
The benefits from employment can be characterised as the direct economic benefits to the person who is employed (and other members of their household) and the flow-on (‘second round’) economic, health and social benefits. Second-round benefits include improved mental and physical health, improved children’s developmental outcomes, higher rates of home ownership, higher-quality housing, lower rates of arrest and incarceration, and lower likelihood of being a victim of crime (e.g. Biddle 2011; Hunter & Gray 2013). They also include economic
benefits to government in the form of higher taxation revenues, lower social security outlays, reduced expenditure on labour market programs and reduced expenditures related to the health system, criminal justice, housing and a range of other social programs. There would also be benefits to the national economy resulting from an increase in labour supply.2
The benefits of employment are very extensive and broad based; however, it is not possible to comprehensively quantify them with existing data. One of the challenges is that, while it is relatively easy to establish the association between employment and a range of health and social outcomes, identifying the causal impact is much harder. For example, we know that those in employment are less likely to have been arrested or incarcerated than those who are unemployed (Hunter & Gray 2013). However, it is difficult to estimate the extent to which this is because employment causally reduces the likelihood of criminality, or because lower levels of criminality causally increase the likelihood of being in employment.
In the absence of longitudinal data, the most commonly used approach for establishing association is regression modelling to estimate the impact of employment on health and social outcomes, while holding constant the impact of other variables such as age, sex, geographic location and educational attainment. This is the approach used in this paper.
Size of the employment gap
The employment rate of the working age (15–64-year-old) Indigenous population in 2011 was 43.6 per cent (Table 1). This is much lower than the employment rate for the non-Indigenous population, which was 72.1 per cent. Based on the 2011 population, closing the employment
TABLE 1.
Indigenous labour force status and the gap between Indigenous and non-Indigenous
employment, 2011 (%)
Males Females Total
Indigenous employment 46.3 41.1 43.6
Indigenous unemployment 14.3 10.0 12.3
Indigenous NILF 39.3 48.9 44.1
Gap between Indigenous and non-Indigenous employment 31.2 26.0 28.5
Proportion of gap that can be filled by existing unemployed job seekers 45.9 38.6 43.1
Proportion of NILF that need to move to employment 43.0 32.6 36.8
NILF = not in the labour force
Notes: Table refers to the population aged 15–64 years. Community Development Employment Projects (CDEP) program participants are classified as being not employed.
gap (so that the Indigenous employment rate is equal to that of the non-Indigenous population) would mean that an additional 116,000 Indigenous people would have to move into employment.
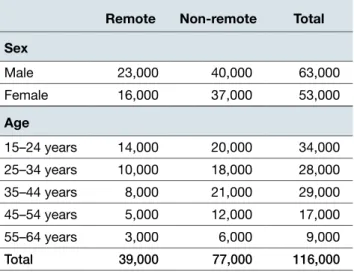
This would require both the unemployed (those who are not employed and actively looking for work) finding employment, and people who are currently not in the labour force (those who are not working and not actively seeking work) moving into the labour force and finding employment. One way of understanding this is to conduct the following thought experiment—if all the unemployed people found employment, this would close 43.1 per cent of the employment gap; the remaining gap would then need to be closed by 36.8 per cent of those who are currently not in the labour force moving into employment. Clearly, closing the employment gap cannot be achieved by focusing only on the unemployed, it also requires a significant focus on people who are not in the labour force, with potentially very different policy approaches. Table 2 shows the number of additional jobs required to close the employment gap in 2011. The total of 116,000 Indigenous people is in addition to the 177,000 employed Indigenous Australians who would need to remain in employment. There is a gap in employment rates for both Indigenous men and women—to close these employment gaps, an additional 63,000 men and 53,000 women would need to move into employment.
Assuming the employment gap is closed across the age distribution, the largest number of additional employed people required is for the 15–24 years age group (increase in employment of 34,000). This is in part because the employment rates are particularly low for the Indigenous population aged 15–24 years, and partly because this is the largest working age group for the Indigenous population. The smallest number of additional jobs required is for the 55–64 years age group (increase in employment of 9,000). This age group is much smaller for the Indigenous than the non-Indigenous population. Assuming the employment gap is closed across categories of geographic remoteness, an additional 77,000 people in non-remote areas and 39,000 in remote areas would require employment. This reflects a combination of the population distribution and relative employment rates in remote and non-remote areas. To estimate the benefits of closing the employment gap, it is important to be clear about exactly which ‘gaps’ are being closed. In this paper, the following assumptions are made:
• The benchmark non-Indigenous employment rate is set to its 2011 Census level.3
• The additional jobs gained by Indigenous people have the same average number of hours worked as are currently worked by employed Indigenous people.4
• The additional employed Indigenous people have the same average income as the currently employed Indigenous population. This means that the estimates in this paper assume that the labour market income gap (conditional on being employed) is not closed.5
Income benefits of closing
the employment gap
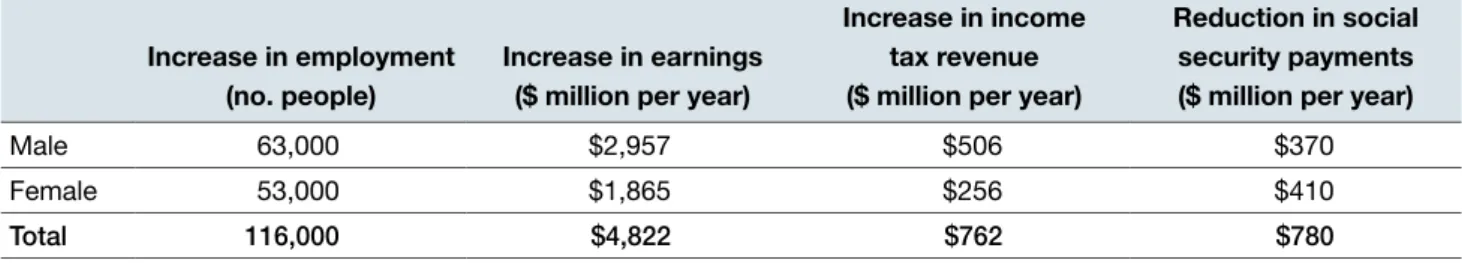
This section estimates the additional labour market income that would result if the employment rate of the Indigenous population increased to be equal to that of the non-Indigenous population. These are the direct economic benefits. In total, closing the Indigenous employment gap is estimated to result in additional labour market earnings per year for the Indigenous population of $4,821m in 2011 dollars, and total additional income tax paid of $762m (Table 3).
Although the increases in employment will substantially reduce social security outlays, many employed people would continue to receive social security benefits (as is the case for the non-Indigenous population), including
TABLE 2 .
Number of additional jobs required to
close the employment gap, 2011
Remote Non-remote Total Sex Male 23,000 40,000 63,000 Female 16,000 37,000 53,000 Age 15–24 years 14,000 20,000 34,000 25–34 years 10,000 18,000 28,000 35–44 years 8,000 21,000 29,000 45–54 years 5,000 12,000 17,000 55–64 years 3,000 6,000 9,000 Total 39,000 77,000 116,000
Notes: The calculations in this table are based on the 2011 population and employment rates, rounded to the nearest thousand. Community Development Employment Projects (CDEP) program participants are classified as being not employed. Appendix A provides information about the methodology used to derive the figures in this table.
Sources: 2011 Census and CDEP program data (see Gray, Howlett & Hunter 2013: Table 1)
the Family Tax Benefit payment, part-rate unemployment, or parenting and carer payments. We estimate that the increased labour market earnings reduce social security payments by $780m per year.
Impacts of demographic change
and population growth
The estimates presented above are based on the 2011 Indigenous population. However, like the rest of the population, the Indigenous population is growing and changing through time and, in future years, the economic and social costs of ongoing employment disparities are likely to increase. Furthermore, as the Indigenous population is likely to grow at a much faster rate than the non-Indigenous population, the increase may be faster than the rate of growth in the economy, leading to an increase in costs as a percentage of GDP or government expenditure.
This increase is suggested in Fig. 1, which gives the projected total number of jobs required to close the gap between Indigenous and non-Indigenous employment in 2011 and every five years until 2031. These estimates are based on projections created by CAEPR for the Australian Government Department of the Prime Minister and Cabinet (see Biddle 2013) and assume no change in the rate of employment over the period. Results are presented separately for males and females.
It is projected that, if there is no change in the rate of Indigenous or non-Indigenous employment between 2011 and 2031, the number of jobs required to close the gap between the two populations will increase from 63,000 to 98,000 for males, and 53,000 to 82,000 for females. This represents growth of 56 per cent for males and 55 per cent for females over the period—much faster than the projected rate of growth of the total population of 21.2 per cent.
TABLE 3 .
Labour market earnings and tax impacts of closing the Indigenous employment gap, 2011
Increase in employment (no. people)
Increase in earnings ($ million per year)
Increase in income tax revenue ($ million per year)
Reduction in social security payments ($ million per year)
Male 63,000 $2,957 $506 $370
Female 53,000 $1,865 $256 $410
Total 116,000 $4,822 $762 $780
Note: Appendix A provides information about the methodology used to derive the figures in this table.
FIG . 1.
Total number of jobs required to close the gap between Indigenous and non-Indigenous
employment
50,000 55,000 60,000 65,000 70,000 75,000 80,000 85,000 90,000 95,000 100,000 Females Males 2031 2026 2021 2016 2011 Number of jobs r equir ed to close the gap
Notes: The population projections used are the Estimated Residential Population projections produced by Biddle (2013) and assume that there is no change in Indigenous identification. Details of the methodology for producing the population projections are described in Biddle (2013).
Perhaps the most important implication of the likely rapid growth of the Indigenous population is that there will be large cohorts of young Indigenous people entering the labour market over the next two to three decades. Closing employment gaps will require these cohorts of young people to possess the skills and attitudes needed to succeed in the labour market and in business.
While the Indigenous population is expected to increase both in absolute size and relative to the non-Indigenous population, it will remain only a small proportion of the Australian population. Rather than the size of the Indigenous population, the key factors affecting the ability to close the employment gap are likely to be:
• the skills of the Indigenous population
• the extent to which the Indigenous population is increasingly living in urban areas and regional centres with better labour market opportunities
• the health of the macroeconomy, which will drive labour demand.
Second-round economic, health and
social impacts of employment
This section provides estimates of the second-round effects of employment. In practical terms, estimates of the impact of employment on second-round health and social outcomes is limited to data collected in existing surveys. The main potential sources of data are the National Aboriginal and Torres Strait Islander Social Survey (NATSISS) 2008 and the National Aboriginal and Torres Strait Islander Health Survey (NATSIHS). As the type of individual-level data required for the analysis used in this paper was not available from the 2012–13 NATSIHS, we used data from the NATSISS 2008 to estimate the health and social benefits of employment for Indigenous Australians.
In this paper, the second-round outcome measures examined are:
• having been arrested in the last five years • having been incarcerated in the last five years • having fair or poor health
• being a home owner • living in public housing.
In addition, data are available on a range of measures of subjective wellbeing. In this paper, the potential impacts
of increasing levels of Indigenous employment on four measures are considered:
• happiness—feeling happy in the past four weeks all or most of the time
• sadness—feeling so sad that nothing could cheer you up at least a little bit of the time in the past four weeks • having a say—feeling that you are able to have a say
within the community on important issues all or most of the time
• discrimination—reporting that in the past 12 months you were treated unfairly because you are Indigenous. The benefits of moving from being not employed to being in employment differ (for at least some of the outcome measures), depending on whether the person has moved from unemployment or from being not in the labour force.6 In addition, for the Indigenous population, it is
important to distinguish between those who were working in the Community Development Employment Projects (CDEP) program at the time of the NATSISS and those who were unemployed, because the CDEP program had some of the benefits of standard employment, but not the full benefits (see Biddle 2011; Hunter & Gray 2013). Table 4 shows the difference in a range of social outcomes for employed people compared with people who are unemployed, people in the CDEP program and people who are not in the labour force. The flow-on social impacts of employment are very substantial. For example, the likelihood of being arrested for people who are employed is 10.4 per cent lower than the CDEP employed, 14.7 per cent lower than the unemployed and 7.3 per cent lower than people who are not in the labour force. If 116,000 extra Indigenous jobs were created to close the employment gap, then around 12,000 fewer arrests of Indigenous people would occur over a five-year period.
The likelihood of being incarcerated for people who are employed is 3.3 per cent lower than the CDEP employed, 7.6 per cent lower than the unemployed and 4.9 per cent lower than people who are not in the labour force. Being employed is also estimated to result in substantially better self-reported health outcomes and home ownership rates, and lower levels of living in public housing.
The positive impact of employment on these health and social outcomes would generate substantial savings to the government. Although it is very difficult to accurately estimate the cost saving, some examples provide an indication of the scale of savings.
The reduction in the incarceration rate indicated above translates to about 7,000 fewer Indigenous people being incarcerated over a five-year period as an indirect benefit of closing the employment gap. The average cost per prisoner per day in 2012–13 is estimated to be $315 (Deloitte Access Economics 2013). The median sentence length for sentenced Indigenous prisoners was 24 months (ABS 2011).
Making the conservative assumptions that a person is only incarcerated once over a five-year period, and that the average sentence length of those who become employed and, as a result, are no longer incarcerated is the same as the overall average sentence length, this results in a saving of $229,950 per person and a national associated public benefit of $1.6b.
Given the high rate of recidivism for Indigenous offenders (Weatherburn 2014), this estimate is likely to be a lower-bound estimate of the cost savings. It is also important to note that these estimates do not include other criminal justice system costs or the costs borne by the victims of crime.
The Steering Committee for the Review of Government Service Provision estimates that the net cost per dwelling of providing public housing (including the recurrent cost and user cost of capital) is $29,527 (SCRGSP 2013).7 It is
difficult to translate the estimated impact of employment at an individual level to the prospect of living in public housing because dwellings generally have multiple people living in them (changes of the situation of any of whom could change the household’s eligibility for public housing). Notwithstanding, in approximate terms, we estimate that generating 116,000 additional Indigenous jobs will reduce individuals’ demand for public housing by up to 30,000 places. The associated cost savings to government could be as much as $0.8b.
The improvements in health will also substantially reduce health system costs; however, this is much harder to quantify and we do not attempt it in this paper. Employment is also associated with substantial improvements in subjective wellbeing (Table 5). These improvements might be direct (through the impact on a person’s sense of self-worth and job satisfaction) or indirect (through the effect on income presented above).
TABLE 4 .
Percentage difference in health and social outcomes for employed Indigenous people
compared with other labour force categories
CDEP Unemployed Not in the labour force
Arrested 10.4% lower 14.7% lower 7.3% lower
Incarcerated 3.3% lower 7.6% lower 4.9% lower
Fair or poor health 3.1% lower 6.3% lower 8.3% lower
Home owner 15.5% higher 12.6% higher 13.7 higher
Public housing 39.7% lower 25.0% lower 26.5% lower
CDEP = Community Development Employment Projects program
Notes: Estimates in this table are presented as the predicted probability for someone in the given labour market category minus the predicted probability for those employed. They are derived from Hunter & Gray (2013: Table 6). For all variables, the results are derived from logistic regression models and the predicted probabilities are calculated for a hypothetical person with average characteristics.
Source: Estimates made using National Aboriginal and Torres Strait Islander Social Survey 2008
TABLE 5 .
Percentage difference in subjective wellbeing for employed Indigenous people compared
with other labour force categories
CDEP Unemployed Not in the labour force
Happiness 0.3% lower 12.6% higher 13.0% higher
Sadness 10.0% lower 20.1% lower 14.2% lower
Having a say 2.8% lower 7.3% higher 8.9% higher
Discrimination 3.7% lower 2.9% lower 15.4% lower
CDEP = Community Development Employment Projects program
Notes: Estimates in the table are presented as the predicted probability for someone in the given labour market category minus the predicted probability for those employed. They are derived from Biddle (2011). For all variables, the results are derived from probit models and the predicted probabilities are calculated for a hypothetical person with average characteristics.
Either way, improved employment is likely to significantly increase the subjective wellbeing of the Indigenous population.
Compared with the unemployed and those not in the labour force, those in non-CDEP employment were more likely to have felt happy all or most of the time over the previous four weeks, and less likely to have felt so sad that nothing could cheer them up. These are both standard measures of emotional wellbeing and show the potential for employment to raise the overall wellbeing of the Indigenous population. Those in non-CDEP employment were also more likely to feel they had a say within the community, and less likely to feel they were discriminated against compared with those who were not employed.
There were some differences between those in CDEP and non-CDEP employment, though they were less consistent. Those in CDEP employment were more likely to have experienced extreme sadness over the preceding four weeks than those in non-CDEP employment.
However, there were no statistically significant differences in the other three wellbeing measures.
Concluding comment
The estimates presented in this paper show that increasing Indigenous employment rates to the level of the non-Indigenous population would result in extensive economic, health and social gains to Indigenous people, communities and the government. When using these estimates, it is important to recognise that there are a number of benefits from paid employment that were not examined in this paper. Consequently, the estimates are extremely conservative and the actual benefits of improving Indigenous employment are likely to be substantially higher than indicated in this paper. The estimates of the benefits reported in this paper are for a single year (2011), and a sustained increase in Indigenous employment would mean that the benefits would continue to be enjoyed for many years.
Of course, when assessing the effectiveness of different approaches and policies to closing the employment gap, it is necessary to consider the costs as well as the benefits. These include the direct costs of the policies, programs and services, and also the potential impacts on non-Indigenous employment. If closing the employment gap is achieved by a reduction in non-Indigenous employment, the benefits to the Indigenous population and the reductions in government expenditure would need to be offset against the costs to the non-Indigenous
community and government outlays. These potential effects are often termed displacement or substitution effects (see Hunter, Gray & Chapman 2000), and the indirect costs can be thought of as macroeconomic or economy-wide effects.
The goal of closing the gap in employment may involve an economic redistribution towards the Indigenous population; however, effective macroeconomic policy can facilitate national growth so that extra jobs for Indigenous people can be generated without any net effect on the employment outcomes for non-Indigenous Australians. This paper demonstrates that the benefits of closing the employment gap are substantial. The challenge for policy makers is to devise a strategy for improving Indigenous employment as efficiently as possible, which minimises expenditure in the form of labour market assistance on people who would have found a job anyway.
Appendix A
Data sources
• Employment rates estimated from 2011 Census and administrative data on the number of CDEP program participants. Gray, Howlett and Hunter (2013) provide details of the estimation of non-CDEP indigenous employment rates.
• Population projections based on census data.
• Income by source of income and taxes paid estimated from wave 11 of the Household, Income and Labour Dynamics in Australia (HILDA) survey.
• Social and health outcomes estimated using the NATSISS 2008.
Key assumptions and methodological issues
The number of jobs required to close the gaps in employment, reported in Table 2 in this paper, are estimated using the employment to population ratio by sex, age and geographic remoteness reported in Gray, Howlett and Hunter (2013: Table 2) and based on Census data and administrative data on the number of CDEP participants.
The residential populations provided in Biddle (2013) are used to ensure that these disparate data sources are comparable and relate to the same underlying population (i.e. the populations for the respective data sources add up to the best available estimate of the Indigenous population).
The estimated number of jobs is 6 per cent higher when using gaps disaggregated by remoteness than when using the national gap. This discrepancy results from the assumptions required to obtain estimates of non-CDEP employment by remoteness. We use the more robust estimates of the number of jobs required based on the national level estimate and adjust the number of jobs required by remoteness to match the national estimate (reported in Fig. 1).
The non-CDEP employment rates are measured with some ‘non-sampling error’ or analytical error driven by the complexity of the calculations (e.g. remoteness identified by Australian Bureau of Statistics geographic concordances provided to authors).
Labour market income, income tax and social security benefits are estimated from around 300 Indigenous respondents in wave 11 of the HILDA survey.
Estimates of number of jobs, income, taxes and social security benefits are for the 2010–11 financial year. Impact on social security outlays is estimated by calculating the difference in social security benefits received by employed Indigenous and unemployed Indigenous and between employed Indigenous and Indigenous not in the labour force. There are differences in the amounts of benefits received (on average) by unemployed people and people who are not in the labour force, reflecting differences in average family structure and number of dependents (and other factors). It is assumed that the unemployed all find jobs and the remainder of the required jobs are from people who are not in the labour force (as per Table 1).
Labour market income of employed Indigenous people is assumed to be the same in remote and non-remote areas of Australia. This assumption is required because the initial sample for the HILDA survey excluded remote areas of Australia; therefore, data on income by source of income is not available for remote areas.
For the estimates of the impact of closing the
employment gap on social security benefit outlays and the second-round impacts for which national estimates are produced (incarceration and public housing), it is assumed that the currently unemployed all find employment and that the rest of the required jobs are filled by those currently not in the labour force.
Estimates of the number of additional employed needed over the period 2011 to 2031 to close the employment gap and keep it closed assume that the non-Indigenous employment rate does not change over this period.
Appendix B
TABLE B1.
Average number of hours worked per week for employed people by Indigenous status, sex
and remoteness, 2011
Indigenous male Indigenous female Non-Indigenous male Non-Indigenous female
Non-remote 39.7 31.8 40.7 31.6
Remote 42.0 34.6 51.0 37.5
All employed 40.1 32.2 40.9 31.7
Note: This table excludes those who identified as participating in the Community Development Employment Projects (CDEP) program in census data. Some people working in the CDEP may be included in this table, but are a minority of CDEP participants.
Source: 2011 Census Table Builder
TABLE B2 .
Gaps in employment of Indigenous and non-Indigenous outcomes by age, sex and
remoteness (%)
Male Female
Age (years) Non-remote Remote Non-remote Remote
15–24 18.8 54.4 22.8 49.9
25–34 27.2 53.4 27.6 41.7
35–44 27.9 48.5 18.0 42.4
45–54 28.7 37.0 20.7 37.6
55–64 26.5 31.3 19.5 35.8
Note: Remoteness areas are defined according to 2006 remoteness categories (calculated using ABS 2011 SA1 to 2006 Remoteness concordance).
Notes
1. This paper extends upon earlier studies including Taylor and Altman (1997) and Taylor and Hunter (1998). These studies used data for the first half of the 1990s to provide estimates of the number of jobs required, at that time, to close the Indigenous – non-Indigenous employment gap and to estimate the opportunity cost to the government budget of not closing the employment gap. This earlier work considered only the costs associated with social security system and foregone taxation. Taylor et al. (2012) provide estimates of the potential economic impact of increases in education attainment and occupational status of the Indigenous population.
2. Although the focus of this paper is on the benefits of employment, it is important to recognise that employment can also have negative impacts, particularly where the work is very unsatisfactory or where the fit between the employee and the job is very poor (Butterworth et al. 2012). The evidence, however, is that those in paid employment have much better economic, health and social outcomes overall than the unemployed.
3. The Australian employment rate has changed little between 2011 and 2014.
4. The empirical evidence suggests that the average working hours of Indigenous and non-Indigenous employed are similar (see Appendix B, Table A1). The only exception is for men in remote areas, where the average hours worked by Indigenous employed people is 42 hours per week, compared with 51 hours per week for non-Indigenous men. Details of the average hours worked by Indigenous and non-Indigenous are provided at Appendix B.
5. Data from the HILDA survey show that Indigenous hourly wage rates are substantially lower than non-Indigenous hourly wage rates.
6. Some other relatively small groups are also classified as being not in the labour force.
7. This figure is for all public housing, not just the public housing used by Indigenous people.
References
Australian Bureau of Statistics (ABS) 2011. Prisoners in Australia, 2011, cat. no. 4517.0, ABS, Canberra. — 2013. Estimates of Aboriginal and Torres Strait
Islander Australians, June 2011, cat. no. 3238.0.55.001, ABS, Canberra.
Biddle, N. 2011. Wellbeing Lecture Series, CAEPR, ANU, Canberra, available at <http://caepr.anu.edu.au/ population/lectures2011.php>.
— 2013. ‘Population projections’, CAEPR Indigenous Population Project: 2011 Census Paper 14/2013, CAEPR, ANU, Canberra.
Butterworth, P., Leach, L., McManus, S. and Stansfeld, S. 2012. ‘Common mental disorders, unemployment and psychosocial job quality: Is a poor job better than no job at all?’, Psychological Medicine, 43 (8): 1763–72.
Deloitte Access Economics 2013. ‘An economic
analysis for Aboriginal and Torres Strait Islander offenders: Prison versus residential treatment’,
Australian National Council on Drugs Research Paper 24, Australian National Council on Drugs, Canberra, available at <http://www.deloitte. com/assets/Dcom-Australia/Local%20Assets/ Documents/Services/Corporate%20Finance/ Access%20Economics/Deloitte_Prison_vs_ Residential_Treatment.pdf>.
Gray, M., Howlett M. and Hunter B. 2013. ‘Labour market outcomes’, CAEPR Indigenous Population Project: 2011 Census Paper No. 10, CAEPR, ANU, Canberra.
Hunter, B.H., Gray, M.C. and Chapman, B. 2000.
An Analysis of Data from the Longitudinal Survey of ATSI Job Seekers: Labour Market Programs and Indigenous Australians, Report to the Department of Employment, Workplace Relations and Small Business, CAEPR, ANU, Canberra, archived at <http://pandora.nla.gov.au/ tep/39723>.
— and Gray, M. 2013. ‘Continuity and change in the Community Development Employment Projects scheme (CDEP)’, Australian Journal of Social Issues, 48 (1): 35–56.
SCRGSP (Steering Committee for the Review of Government Service Provision) 2013. Report on Government Services 2013, Productivity Commission, Canberra.
—, Gray, M., Hunter, B., Yap, M. and Lahn, J. 2012. ‘Higher education and the growth of Indigenous participation in professional and managerial occupations’, Working Paper No. 81, CAEPR, ANU, Canberra.
Taylor, J. and Altman, J.C. 1997. The Job Ahead: Escalating Economic Costs of Indigenous Employment Disparity, Office of Public Affairs, Aboriginal and Torres Strait Islander Commission, Canberra.
— and Hunter, B.H. 1998. The Job Still Ahead: Economic Costs of Continuing Indigenous Employment Disparity, Aboriginal and Torres Strait Islander Commission, Canberra.
Weatherburn, D. 2014. Arresting Incarceration: Pathways Out of Indigenous Imprisonment, Aboriginal Studies Press, Canberra.