Optimal Capital Structure Based on Market Performance of
Different Industry Sectors of Listed Companies at Indonesia
Stock Exchange
M. Rustam
Airlangga University, Faculty of Economics and Business E-mail: [email protected]
Abstract
The purpose of this study is to determine the optimal capital structure based on static trade-off models and to analyze the differences in the capital structure of each industry sector based on Jakarta Stock Industrial Classification (JASICA) of public companies listed in the Indonesia Stock Exchange. Capital structure is very important for a company, especially in determining financial policy that will have impact on the long-term viability of the company. However until now there is no single theory that satisfactorily leads to an optimal capital structure concept. Unbalanced panel data from 302 companies in the period from 2000 to 2010 creates 1,955 year company observations. Pooled nonlinear regression is performed on company’s market performance variable towards capital structure to find the optimal capital structure for each industry sector. Furthermore, Monte Carlo techniques are used by resampling each industry sector 1,000 times to gain a more refined estimate. The study shows that the real use of long-term debt for nonfinancial corporate sector in Indonesia is lower than the use of equity. Capital structure by industry sector is still not optimal and still has a positive debt capacity. There are 5 of 8 industrial sectors in which the capital structure reach optimal when the amount of long-term debt is equal with the total equity.
Keywords: optimal capital structure, company's market performance, long term debt to equity, the classification of industries.
1. Introduction
Searching for optimal capital structure has long become dominant thought for both practitioners and academia. It started from the idea of Modigliani and Miller (1958). At first, Modigliani and Miller (abbreviated MM) state that the debt ratio is irrelevant and there is no optimal capital structure. Value of the company depends on the cash flows that will be generated and not on the ratio of debt and equity. Furthermore when corporate taxes are taken into account, according to the MM theory, optimal value of a company is reached whenever the company is using 100 percent of its debt, because of the tax savings on debt interest. Until now the thought still lingers in the minds of academia and practitioners.
Subsequent capital structure theory is the static trade-off theory. Based on the static trade-off theory, a company can achieve optimal debt level by balancing the tax benefits of debt (since interest as a tax deduction) and the potential financial distress costs that increase with the debt. However, static trade-off theory fails to explain several empirical studies, such as the negative correlation between leverage and return on assets (ROA), as well as between leverage and market to book ratio. There are also significant different levels of debt for similar companies, so the findings do not support this theory. This inconsistency encourages the development of alternative theories of capital structure e.g. the pecking order theory.
According to the pecking order theory, in the condition of information asymmetry, some companies prefer to use internal funds (retained earnings and other reserves). If the source internal funds is no longer sufficient, the company uses debt without risk, and then increases use of risky debt, while the use of equity as a last option. However, the pecking order theory is not the only way to overcome the weaknesses of the static trade-off theory. Some puzzles can be answered by making adjustments to the recapitalization costs that arises due to information asymmetry and agency problems. This has prompted the emergence of a dynamic trade-off theory that tests capital structure decisions in the form of multi-period expectations and consideration for providing recapitalization costs. In particular, the transaction costs arising from the issuance of debt and equity force the company to make less frequent adjustment in their capital structure to achieve an optimal level of debt. It encourages companies to target optimal debt within a certain interval compared rather than at specific point. Adjustment of capital structure of the company is only made if the debt level is outside the interval (Fischer and Zechner, 1989).
Several comparative studies on the optimal capital structure of various companies show inconsistent results. For example, a study by Babenko (2003) who examines companies in America, using a static model and considering financial distress. The use of leverage as the ratio between total debt and total assets, generate leverage optimal estimates by 38 percent, while the conventional model produces optimal leverage by 73 percent. Binsbergen et als. (2011), examines the optimal debt to several companies in America. The intensity of
debt is expressed in the ratio between the interest of debt and the book value of total assets . The model used is a balance between the marginal cost of debt and marginal benefit. The model calculates the costs and benefits of the use of debt. The results show different optimal debt because the companies have different characteristics. In addition to difference between companies, the optimal debt is also differs for the same company but in different years due to different tax effects. The use of the model in determining the optimal capital structure seems to be more complex. This is due to the factors being considered in determining the optimal capital structure is not always the same, in addition to the factors that determine the relationship of capital structure which is not linear. Some authors use the approach of the complex integral differential model such as in the article writen by Kane et al. (1985).
Unlike before, this study is intended to contribute to the existing literature by modeling the optimal capital structure prediction using simulation models and panel data (combined cross section and time series) of listed companies in Indonesia. This study tries to find the optimal capital structure of each industry sector indices based on Jakarta Stock Industrial Classification (JASICA). This method requires the help of a computer program for finding the functions of relationship of optimal capital structure and maximum corporate markets performance. The benefit of this method is that it is able to find optimal capital structure but are less so in explaining the factors that influence it explicitly, mainly because of all the factors considered have been accommodated in the optimal capital structure of the model equations.
This study was divided into several sections. The first section describes the background, Section 2 contains review of literature, Section 3 describes data and research methods , Section 4 analysis of data, and Section 5 contains the conclusions and discussion.
2. Literature Review
Many studies and researches explained the impact of capital structure on company performance, but some studies found negative relationship between capital structure and company performance (Booth et al. , 2001; Deesomask et al., 2004; Huang and Song, 2006; Karadeniz et al., 2009; Chakraborty, 2010). Several other studies showed positive relationship between company performance and financing options (Ghosh et al. 2000; Hadlock and James, 2002; Frank and Goyal, 2003; and Berger and Bonaccorsi, 2006). Subsequently a number of studies found no significant results on the relationship between debt levels and company performance (Tang and Jang, 2007; Ebaid, 2009). Nevertheless, all of the results of those studies still cannot explain how managers choose source of capital between debt financing and equity. Harris and Raviv (1991) and Hovakimian et al. (2001) have tested the hypothesis that companys tended towards a target ratio when they raise new capital or suspend or revoke existing capital. They found that companies will relatively use more debt to finance their activities instead of current assets and relatively use most equity to fund future growth opportunities.
Literature on the relationship between company performance and capital structure has provided combined results. Abor (2005) reported that there is positive relationship between capital structure as measured by short-term debt and total debt, and the company's performance during the period of 1998-2002 in Ghana. Arbiyan and Safari (2009) examined the effect of capital structure on profitability by using 100 public companies in Iran from 2001 to 2007. The findings showed that short-term debt and total debts are positively related to profitability (ROE) and negative relationship between long-term debts and ROE. Huang and Song (2006) found a negative relationship between leverage and company performance (earnings before interest and tax to total assets) in the Chinese company. Chakraborty (2010) use two performance measures, including the ratio of profit before interest, tax, and depreciation to total assets and the ratio of cash flows to total assets, as well as two leverage measures, including the ratio of total borrowing to assets and liabilities to equity ratio, and produces a negative relationship. Ebaid (2009) examines the impact of capital structure on the performance of the selection of 64 companies from 1997 to 2005 in the Egyptian capital market. Ebaid using three accounting-based measures including ROA, ROE, and gross profit margin, concluded that selection of capital structure in general has weak influence on company performance.
A study by Saeedi and Mahmoodi (2011) examined the relationship between capital structure and company performance using a sample of 320 companies listed in Tehran stock exchange during the period 2002 to 2009. All are financial companies and banks. The research uses four performance measures (including ROA, ROE, EPS, and Q ratio) as the dependent variable and the three capital structure (including the ratio of long-term debt, short-term debt, and total debt) as independent variables. The results of the study showed that the performance of the company as measured by the EPS and the Q ratio were significantly and positively related to capital structure; the capital structure and ROA have negative relationships, and between ROE and capital structure there was no significant relationship.
A study by Pratheepkanth (2011) analyzed the capital structure and its impact on financial performance capacity during the years of 2005 to 2009 of the companies in Sri Lanka. The results show that the relationship between capital structure and financial performance is negatif. Zeitun and Tian (2007) examined the effect of capital structure on company performance using panel data sample of 167 companies in Jordan for the year 1989
to 2003. The results show that the capital structure of the companies has significant negative impact on corporate performance, either by size or by the size of the market accounting.
Rub (2012) conducted a study on the effect of capital structure on company performance. His research uses five performance measures (including return on equity, return on assets, earnings per share, market value of equity to the book value of equity and the Q ratio) as the dependent variable and the four measures of capital structure (including short-term debt to total assets, long-term debt to total assets, total debt to total assets, and total debt to total equity) as independent variable. The study was conducted using a sample of 28 companies listed on the stock exchange of Palestine during the period 2006 to 2010. The results of his study show that the capital structure of the company has positive impact on company performance as measured by accounting and market base. Statistically, corporate performance is significant on total debt to total assets. Market value of equity to book value of equity is significantly to the total debt to total assets and the short-term debt to total assets. The study found the equation to determine the impact of a variety of debt on company performance.
Another test of the hypothesis of an optimal capital structure is to examine the stock price reaction to the actions taken by both companies to increase or decrease leverage. There must be some assumptions about the motivations of companies that make capital structure changes in response to evaluate the price. If it is assumed that companys rationally and make changes to their approach to the optimal capital structure, either a debt increase or decrease debt, must be accompanied by a positive excess return, at least in the average. Smith (1986) showed that there is no evidence consistent with the hypothesis that the optimal capital structure. Action increases leverage seems to be accompanied by a positive excess return, while the action was followed by a decrease in leverage seems negative returns. The reason given related to the optimal capital structure is to assume managerial incentives (the desire for stability and flexibility) maintain leverage below the optimum for most companies, and actions by the company to reduce leverage is seen as a more fulfilling managerial interests rather than the interests of the shareholders. Furthermore, Chang and Dasgupta (2011) examines the capital structure using Monte Carlo simulations for reason they concluded that the data used in the study of capital structure to explain managerial behavior is not standard . This has caused problems in statistical inference in empirical studies of capital structure.
In one industry it is possible to find different capital structures, as well as in each of the other industries. This is because the characteristics of the company affect its capital structure. Like the view of Harris and Raviv (1991), the determinants of capital structure that has become the consensus of the experts include the amount of tangible fixed assets that can be pledged as security (collateral), non-debt tax shield that is the cost that brings tax savings for the company in addition to interest cost, the amount of investment opportunities or growth rate, the size of the company, the level of profitability, volatility of earnings, the amount of advertisement expenses, and the uniqueness of the products produced by the company.
Binsbergen et al. (2011) estimate the cost and benefit functions of debt. Benefit function has a decreasing slope reflecting that the added value of debt decreases in line with increasing use of debt. Cost function has an ascending slope reflecting increase in costs incurred to the use of more debt. Cost function varies between companies reflecting company characteristics such as asset collateral and asset size, market to book ratio, profitability, and dividend policy. Cost and benefit functions are used to generate the optimal amount of debt that otherwise should be used by the company. Optimal capital structure occurs when the marginal benefits equal the marginal cost of debt. They produce a formula that can be used to determine the optimal debt for a company.
Ju et al. (2002) examines the optimal capital structure for companiess that go public by using dynamic models, found that the optimal debt ratio forecast to total capital was 14.42 percent at maximum stock price for a company as measured by the median value of Standard and Poors' Computstat database, while based on the sample data, the median value is different namely 22.6 percent; and the predicted value is below the sample value. The model shows most of these companies seem to use excessive debt when only taxes and bankruptcy costs are taken into account. Also in the study company cost adjusted to its capital structure when it deviates from the optimum point, and the value result is only 0.5 percent.
Other capital structure research was conducted by Ozkan (2001). This study examines the determinants of the target capital structure (debt ratio) and the company's role in the adjustment process. The study was conducted by using unbalanced panel data on the 390 companies in the UK, the period from 1984 to 1996 using a dynamic model, the partial adjustment models, and the estimation methods of Generalized Method of Moments (GMM). The results show that profitability, liquidity, and growth opportunities negatively affect the company's capital structure. This is consistent with theoretical predictions about the opposite relationship between non-debt tax shields and debt ratio of the company. There are also positive effects derived from the size of the company's capital structure.
There is a diversity of research results on capital structure used by the company. This is due to differences in the characteristics of the company. According to Harris and Raviv (1991), the determinants of capital structure that has become the consensus of experts includes the amount of fixed tangible assets that can be pledged as security (collateral), non-debt tax shield that is the cost that brings tax savings to the company in addition to
interest charges, the amount of investment opportunities or growth rate, the size of the company, the level of profitability, volatility of earnings, the amount of advertisement expenses, and the uniqueness of the products produced by the company.
3. Data and Methods 3.1. Data dan Sample
The sources of data are official organizations, firstly from the Indonesia Stock Exchange, in the form of annual statement of financial position of public enterprises in Indonesia. The data include the company's stock price, long-term debt, equity, and total aset. The time frame of the data starts from 2000 to 2010 as detailed in Table 1. Data collected by industrial sector are retrieved from Jakarta Stock Industrial Classification. The number of industrial sectors found in Indonesia are nine, but only one sector is not examined namely the financial and investment sector. Companies engaged in the financial sector are not sampled because of the financial statements and capital structure is very different from nonfinancial companies. Financial sector and financial investments have different composition compared to non-financial sectors, especially the use of the composition of debt is greater than the non-financial sector. In addition, the regulation in the financial sector is more stringent than that of non-financial sector, so there is a regulatory influence on the structure of the capital. The study uses unbalanced panel data, consisted of 302 companies selected based on purposive sampling technique. Companies for which data are not processed in this study are those who do not have long-term debt, those who have negative equity, and those with the value of the capital structure ratio as well as market performance above 3.
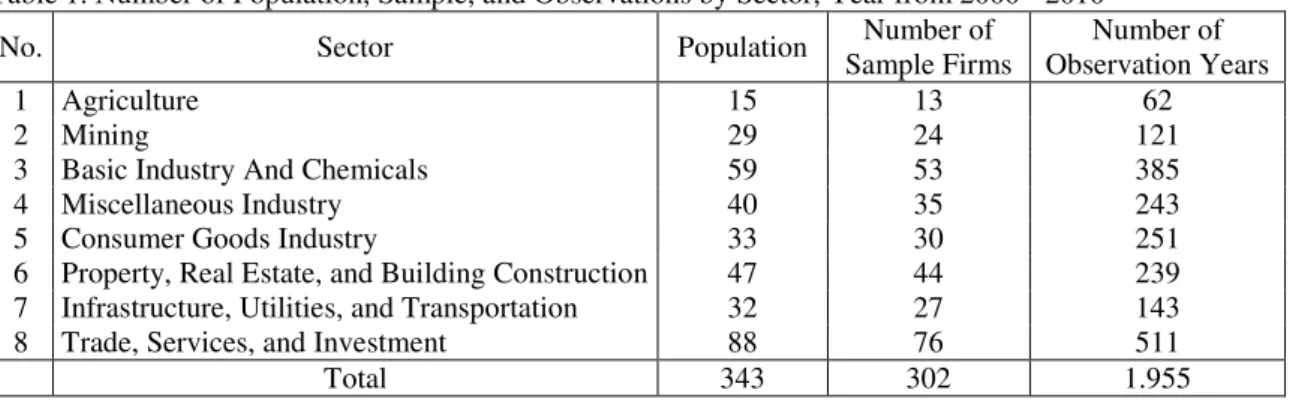
Table 1. Number of Population, Sample, and Observations by Sector, Year from 2000 - 2010
No. Sector Population Number of
Sample Firms
Number of Observation Years
1 Agriculture 15 13 62
2 Mining 29 24 121
3 Basic Industry And Chemicals 59 53 385
4 Miscellaneous Industry 40 35 243
5 Consumer Goods Industry 33 30 251
6 Property, Real Estate, and Building Construction 47 44 239 7 Infrastructure, Utilities, and Transportation 32 27 143
8 Trade, Services, and Investment 88 76 511
Total 343 302 1.955
3.2. Research Variables
The variables used in this study are capital structure and company's market performance. The capital structure is the ratio of long-term debt and equity, while the formula to be used for the company's market performance is the Tobin's Q (Q ratio) which has been simplified by Klapper and Love (2002) as follows:
BVA - BVE + MVE Tobin's Q =
BVA
where:
BVA = book value of assets
BVE = book value of equity
MVE = market value of equity
Market value of equity is calculated using the stock price data of the average of two consecutive years. The data is annual data sourced from company's financial statements.
3.3. Data Analysis Techniques
Determination of the optimal capital structure is preceded with the search for convex function form using panel data, used to describe the relationship between capital structure and company's market performance with the help of Table Curve 2D software. The convex form function has a point of extreme value namely the maximum value of market performance. The search form nonlinear regression functions is performed on each of the eight industry sectors. The function to be selected is the best based on statistical considerations, namely the coefficient of determination, and the value of F and t statistics. The form of convex functions that has been obtained which describes the relationship between capital structure (variable x) and market performance (variable y) can be seen in Table 2. Having found the best function then resampling is done using Monte Carlo techniques up to 1,000 times. This result is done in order to obtain a more refined estimation.
Table 2. Nonlinear Regression Function (Convex Shape)
No. Sector Nonlinear Regression Function (Convex Form)
1 Agriculture y = a + b (ln x)2 2 Mining
(
)
2 2 ln ln x y a b x c x = + +3 Basic Industry And Chemicals y = a + b (ln x)2
4 Miscellaneous Industry
(
)
(
)
2 4 2 4 1 a cx ex y bx dx + + = + +5 Consumer Goods Industry
(
)
(
)
0,5 1,5 2 0,5 1,5 2 1 a cx ex gx ix y bx dx fx hx + + + + = + + + +6 Property, Real Estate, and Building Construction y = a + b (ln x)2
7 Infrastructure, Utilities, and Transportation
(
)
(
)
4 exp x c 1 exp x c y a b d d − − = + − − −
8 Trade, Services, and Investment y = a + b (ln x)2 4. Results of Analysis
4.1. Descriptive Analysis of Market Performance by Sector
Based on Table 3, the sectors which have high average market performance are Infrastructure, Utilities, and Transportation, Agriculture, and Consumer Goods Industry with values above 1.25, while the sectors which have the lowest average company's market performance is the Miscellaneous Industries with a value of less than 1.
Table 3. Average Company's Market Performance by Sector Before and After Simulation
No. Sector Min Max Before Simulation After Simulation
Mean Std Dev Mean Std Dev
1 Agriculture 0.5312 2.3345 1.2700 0.4999 1.2365 0.4848
2 Mining 0.2198 2.8036 1.2285 0.5505 1.2207 0.5453
3 Basic Industry And Chemicals 0.2173 2.9731 1.0121 0.4275 1.0188 0.4403 4 Miscellaneous Industry 0.3906 2.9875 0.9710 0.3492 0.9765 0.3608 5 Consumer Goods Industry 0.3804 2.8103 1.2578 0.5819 1.2313 0.5702 6 Property, Real Estate, and Building
Construction 0.2404 2.7616 1.0395 0.4299 1.0321 0.4183
7 Infrastructure, Utilities, and Transportation 0.4179 2.9474 1.2816 0.5644 1.2671 0.5498 8 Trade, Services, and Investment 0.0724 2.9574 1.1953 0.5221 1.2102 0.5411 4.2. Descriptive Analysis of Capital Structure by Sector
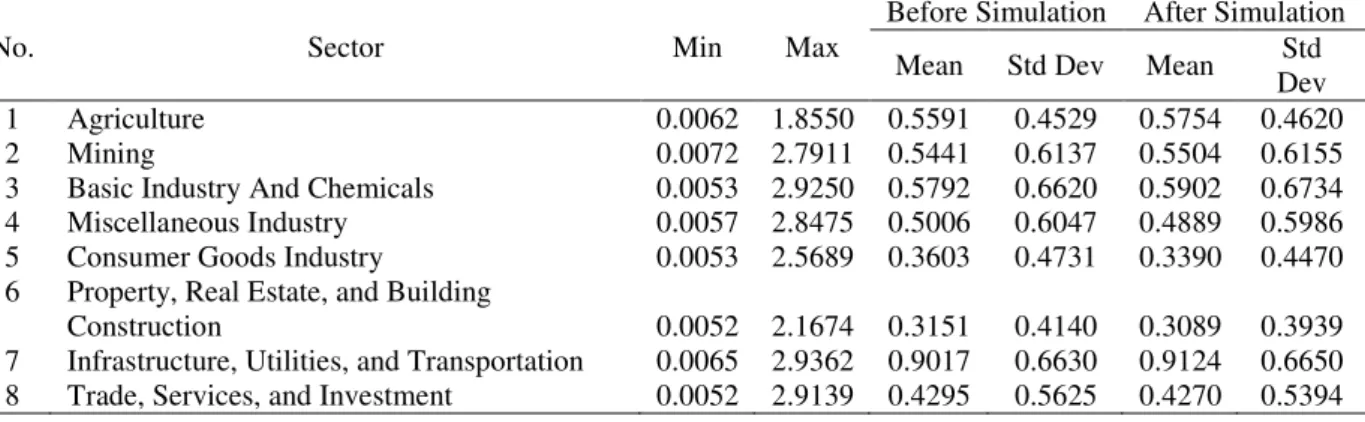
Based on Table 4, the industrial sector had an average capital structure is very large Infrastructure Sector, Utilities, and Transportation, while those with an average low capital structure is the Property, Real Estate, and Building Construction Sector, Consumer Goods Industry Sector, and Trade and Services Sector with a value below 0.5.
Table 4. Average Capital Structure by Sector Before and After Simulation
No. Sector Min Max
Before Simulation After Simulation Mean Std Dev Mean Std
Dev
1 Agriculture 0.0062 1.8550 0.5591 0.4529 0.5754 0.4620
2 Mining 0.0072 2.7911 0.5441 0.6137 0.5504 0.6155
3 Basic Industry And Chemicals 0.0053 2.9250 0.5792 0.6620 0.5902 0.6734 4 Miscellaneous Industry 0.0057 2.8475 0.5006 0.6047 0.4889 0.5986 5 Consumer Goods Industry 0.0053 2.5689 0.3603 0.4731 0.3390 0.4470 6 Property, Real Estate, and Building
Construction 0.0052 2.1674 0.3151 0.4140 0.3089 0.3939
7 Infrastructure, Utilities, and Transportation 0.0065 2.9362 0.9017 0.6630 0.9124 0.6650 8 Trade, Services, and Investment 0.0052 2.9139 0.4295 0.5625 0.4270 0.5394
4.3. Estimation of Optimal Capital Structure Per Sector
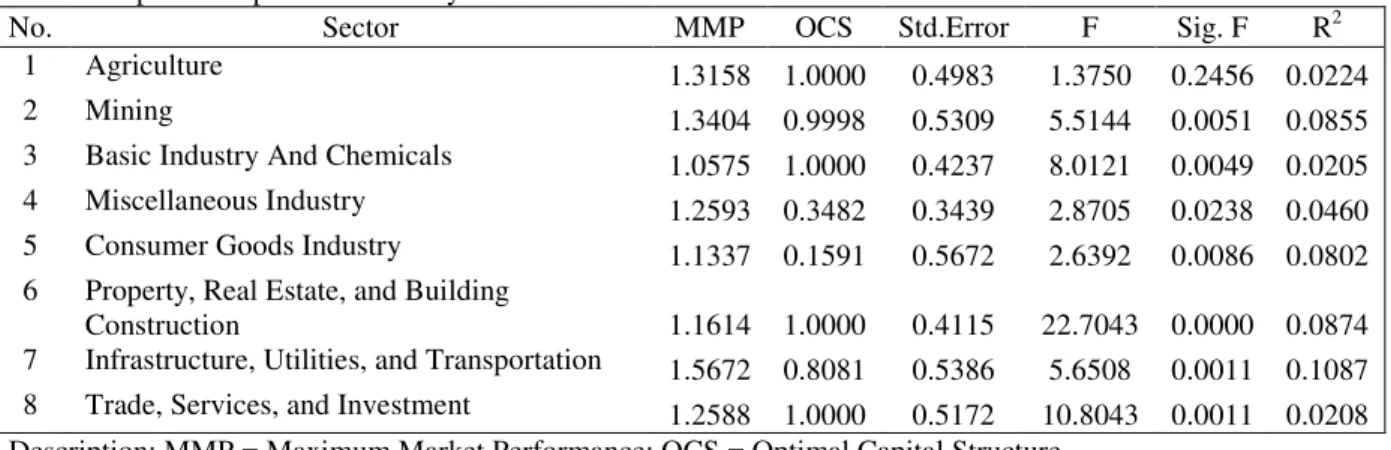
The search for the optimal capital structure is conducted performing a two-stage calculation. The first is the search for optimal capital structure using the original data as shown in Table 5, while the second is the search for optimal capital structure by way of simulation with results as shown in Table 6. Table 5 shows that the estimation of optimal capital structure on average still produces low F values, whereas in Table 6, the value in general has increased and the significance values are more realistic at 0.0000. Similarly, the R2 values in Table 6 are generally larger than Table 5. This values show that the simulation result is better than before simulation. There are interesting findings of this study as shown in Tables 5 and 6. There are five sectors which show the optimal capital structure occurs when the amount of long-term debt equals the amount of use of equity. The sectors are Agriculture, Mining, Basic and Chemical Industry, Property, Real Estate and Building Construction, as well as Trading and Services, while Infrastructure Sector, Utilities, and Transportation show capital structure that is approaching the optimal point.
Table 5. Optimal Capital Structure by Sector Before Simulation
No. Sector MMP OCS Std.Error F Sig. F R2
1 Agriculture 1.3158 1.0000 0.4983 1.3750 0.2456 0.0224
2 Mining 1.3404 0.9998 0.5309 5.5144 0.0051 0.0855
3 Basic Industry And Chemicals 1.0575 1.0000 0.4237 8.0121 0.0049 0.0205 4 Miscellaneous Industry 1.2593 0.3482 0.3439 2.8705 0.0238 0.0460 5 Consumer Goods Industry 1.1337 0.1591 0.5672 2.6392 0.0086 0.0802 6 Property, Real Estate, and Building
Construction 1.1614 1.0000 0.4115 22.7043 0.0000 0.0874
7 Infrastructure, Utilities, and Transportation 1.5672 0.8081 0.5386 5.6508 0.0011 0.1087 8 Trade, Services, and Investment 1.2588 1.0000 0.5172 10.8043 0.0011 0.0208 Description: MMP = Maximum Market Performance; OCS = Optimal Capital Structure.
Table 6. Optimal Capital Structure by Sector After Simulation
No. Sector MMP OCS Std.Error F Sig. F R2
1 Agriculture 1.2781 1.0000 0.4798 21.6908 0.0000 0.0213
2 Mining 1.3329 0.9998 0.5151 61.2801 0.0000 0.1095
3 Basic Industry And Chemicals 1.0717 1.0000 0.4345 27.8721 0.0000 0.0272 4 Miscellaneous Industry 1.1125 0.3929 0.3579 5.1578 0.0004 0.0203 5 Consumer Goods Industry 1.5583 0.5413 0.5331 19.0125 0.0000 0.1331 6 Property, Real Estate, and Building
Construction 1.1428 1.0000 0.4021 83.3032 0.0000 0.0770
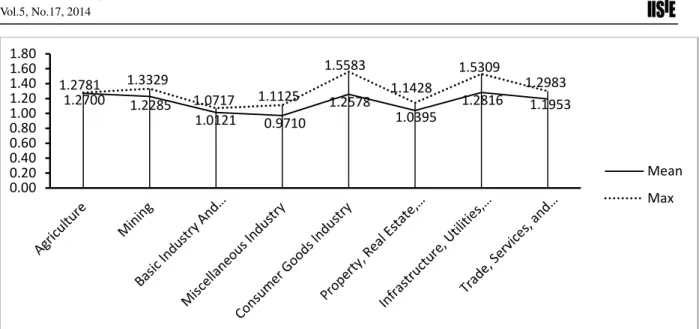
7 Infrastructure, Utilities, and Transportation 1.5309 0.8635 0.5179 43.2208 0.0000 0.1152 8 Trade, Services, and Investment 1.2983 1.0000 0.5308 39.9955 0.0000 0.0385 The difference between the actual company's market performance and the estimated company's maximum market performance can be seen in Figure 1. All sectors have performed below the maximum, except for the Agricultural Sector which have the average market performance is nearing maximum. It appears that the differences in the market performance is very thin.
Figure 1. Comparison between the Actual Average Company's Market Performance and the Estimated Maximum Company's Market Performance by Sector
Further comparison between the average actual capital structure and the estimatied optimal capital structure can be seen in Figure 2.
Figure 2. Comparison between average Actual Capital Structure and Estimated Optimal Capital Structure by Sector
Figure 2 shows a considerable gap difference, except Miscellaneous Industry Sector and Infrastructure, Utilities, and Transportation Sector.
5. Conclusions and Discussion
In general, the average of the actual company's market performance per sector is overvalued because they are above 1, except Miscellaneous Industry Sector is undervalued because its average value is below 1, as can be seen in Table 3. Comparison between the average actual capital structure in Table 3 and the estimated optimal capital structure in Table 6 describes the following matters. The actual amount of long-term debt used by companies on average is lower than equity. Based on the analysis by industry sector, companies in Indonesia in general do not reach the optimal capital structure and still have positive debt capacity which means that uses of long-term debt is low. As can be seen in Figure 2, the sectors that have positive debt capacity are Agriculture, Mining and Chemical Industry, Consumer Goods Manufacturing Sector, Property Sector, Real Estate and Building Construction, as well as Trading and Services. Sectors that have negative debt capacity are Miscellaneous Industry Sector and Infrastructure Sector, Utilities and Transportation. However, from the estimation model, capital structure can only explain small part of variations in market performance as shown in the coefficient of determination (R2). After exceeding the optimal capital structure, the slope of market performance does not decline sharply. This means that in nonlinear models, the addition of the use of long-term
1.2700 1.2285 1.0121 0.9710 1.2578 1.0395 1.2816 1.1953 1.2781 1.3329 1.0717 1.1125 1.5583 1.1428 1.5309 1.2983 0.00 0.20 0.40 0.60 0.80 1.00 1.20 1.40 1.60 1.80 Mean Max 0.5591 0.5441 0.5792 0.5006 0.3603 0.3151 0.9017 0.4295 1.0000 0.9998 1.0000 0.3929 0.5413 1.0000 0.8635 1.0000 0.00 0.20 0.40 0.60 0.80 1.00 1.20 Mean OCS
debt after the optimum point has less substantial effect on market performance degradation. One reason is that under the terms of the exchange, stock prices in Indonesia have the lowest price limit.
As general conclusions we find that on average nonfinancial corporate capital structure in Indonesia appeared to be not optimal. The less optimal capital structure can be caused by company management who as important agent has not considered the importance of optimal capital structure for the company. The management still applies the precautionary principle in the use of excessive long-term debt because of concerns over the risk of financial distress and bankruptcy costs. Besides, the unoptimal capital structure can also be caused by caution on the part of the creditor or debt investors as long-term funding agent from outside the company. Whereas if the management company can implement an optimal capital structure, it will be a huge impact on the development of a sustainable company. Companies can work more efficiently, able to compete, obtain high profitability, optimum tax savings, increase company's credibility, and provide high return to shareholders.
References
Abor, J. (2005). The Effect of Capital Structure on Profitability: An Empirical Analysis of Listed Firms in Ghana, Journal of Risk Finance, 6, 438-447.
Arbiyan, A. A. and Safari, M. (2009). The Effects of Capital Structure and Profitability in the Listed Firms in Tehran Stock Exchange, Journal of Management Perspective, 33, 159-175.
Babenko, Ilona, (2003). Optimal Capital Structure of the Firm in the Presence of Costs of Financial Distress,
Working Paper, Haas School of Business, University of California, Berkeley, 5179, 1-44.
Berger, A. and Bonaccorsi di Patti, E. (2006). Capital Structure and Firm Performance: A New Approach to Testing Agency Theory and An Application to the Banking Industry, Journal of Banking and Finance, 30, 1065-1102.
Binsbergen, J. H. van, Graham, J. R., and Yang, J. (2011). Optimal Capital Structure, Journal of Applied Corporate Finance, 23, 4, 34-59.
Booth, L., Aivazian, V., Demirguc-Kunt, A., and Maksimovic, V. (2001). Capital Structure in Developing Countries, The Journal of Finance, 56, 87-130.
Chakraborty, I. (2010). Capital Structure in An Emerging Stock Market: The Case of India, Research in International Business and Finance, 24, 295-314.
Chang, X. and Dasgupta, S. (2011). Monte Carlo Simulations and Capital Structure Research, International Review of Finance, 11, 1, 19-55.
Deesomask, R., Paudyal, K., and Pescetto, G. (2004). The Determinants of Capital Structure: Evidence from the Asia Pacific Region, Journal of Multinational Financial Management, 14, 387-405.
Ebaid, E. I. (2009). The Impact of capital Structure Choice on Firm Performance: Empirical Evidence from Egypt, The Journal of Risk Finance, 10, 5, 477-487.
Fischer, H. R., and Zechner, J. (1989). Dynamic Capital Structure Choice: Theory and Tests, The Journal of Finance, 44, 1, 19-40.
Frank, M.. and Goyal, V. (2003). Testing the Pecking Order Theory of Capital Structure, Journal of Financial Economics, 67, 217-48.
Ghosh, C., Nag, R., Sirmans, C. (2000). The Pricing of Seasoned Equity Offerings: Evidence from REITs, Real Estate Economics, 28, 363-384.
Hadlock, C. and James, C. (2002). Do Banks Provide Financial Slack?, Journal of Finance, 57, 1383-1420. Harris, M. and Raviv, A. (1991). The Theory of Capital Structure, Journal of Finance, 46, 297-356.
Hovakimian, A., Opler, T., and Titman, S. (2001). The Debt Equity Choice. Journal of Financial and Quantitative Analysis, 36, 1, 1-24.
Huang, S. and Song, F. (2006). The Determinants of Capital Structure: Evidence from China, China Economic Review, 17, 1, 14-36.
Indonesia Stock Exchange. IDX Fact Book 2006 - 2011. Jakarta: Indonesia Stock Exchange. Indonesia Stock Exchange. IDX Statistics 2006 - 2011. Jakarta: Indonesia Stock Exchange.
Ju, N., Parrino, R., Poteshman, A. M., and Weisbach, M. S. (2002). Horses and Rabbits? Optimal Dynamic Capital Structure from Shareholder and Manager Perspectives, Working Paper, University of Texas at Austin.
Kane, A., Marcus, A. J., and McDonald, R. L. (1985). Debt Policy and the Rate of Return Premium to Leverage,
Journal of Financial and Quantitative Analysis, 20, 4, 479-499.
Karadeniz, E., Kandir, S. Y., Balcilar, M., and Onal, Y. B. (2009). Determinants of Capital Structure: Evidence from Turkish Lodging Companies, International Journal of Contemporary Hospitality Management, 21, 5, 594-609.
Klapper, L. F. and Love, I. (2002), Corporate Governance, Investor Protection, and Performance in Emerging Markets, World Bank Policy Research WorkingPaper 2818, 1-39.
Modigliani, F. and Miller, M. (1958). The Cost of Capital, Corporate Finance, and the Theory of Investment,
American Economics Review, 48, 261-297.
Ozkan, Aydin, (2001). Determinants of Capital Structure and Adjustment to Long Run Target: Evidence from UK Company Panel Data, Journal of Business and Accounting, 28, 1, 175-198.
Pratheepkanth, Puwanenthiren, (2011). Capital Structure and Financial Performance: Evidence from Selected Business Companies in Colombo Stock Exchange Sri Lanka. Journal of Arts, Science and Commerce, 9, 171-181.
Rub, N. Abu, (2012). Capital Structure and Firm Performance, Evidence from Palestine Stock Exchange,
Journal of Money, Investment, and Banking, 23, 109-117.
Saeedi, Ali and Mahmoodi, Iman, (2011). Capital Structure and Firm Performance: Evidence from Iranian Companies, International Research Journal of Finance and Economics, 70, 20-29.
Smith, Clifford W., Jr. (1986). Investment Banking and the Capital Acquisition Process, Journal of Financial Economics, 15, 3-29.
Tang, C. H. and Jang, S. S. (2007). Revisit to the Determinants of Capital Structure: A Comparison between Lodging Firms and Software Firms, International Journal of Hospitality Management, 26, 1, 175-187. Zeitun, R. and Tian, G. (2007). Capital Structure and Corporate Performance: Evidence from Jordan,