DEX: Increasing the Capability of Scientific Data Analysis Pipelines by
Using Efficient Bitmap Indices to Accelerate Scientific Visualization
Kurt Stockinger, John Shalf, Wes Bethel, and Kesheng Wu
Computational Research Division
Lawrence Berkeley National Laboratory
1 Cyclotron Road, Berkeley, CA 94720, USA
Abstract
We describe a new approach to scalable data analysis that enables scientists to manage the explosion in size and complexity of scientific data produced by experiments and simulations. Our approach uses a novel combination of efficient query technology and visualization infrastructure. The combination of bitmap indexing, which is a data man-agement technology that accelerates queries on large sci-entific datasets, with a visualization pipeline for generating images of abstract data results in a tool suitable for use by scientists in fields where data size and complexity poses a barrier to efficient analysis. Our architecture and imple-mentation, which we call DEX (short for dexterous data ex-plorer), directly addresses the problem of “too much data” by focusing analysis on data deemed to be “scientifically interesting” via a user-specified selection criteria. The ar-chitectural concepts and implementation are applicable to wide variety of scientific data analysis and visualization ap-plications. This paper presents an architectural overview of the system along with an analysis showing substantial performance over traditional visualization pipelines. While performance gains are a significant result, even more im-portant is the new functionality not present in any visual-ization analysis software – namely the ability to perform interactive, multi-dimensional queries to refine regions of interest that are later used as input to analysis or visualiza-tion.
1
Introduction
Bitmap Indices are index data structures for efficiently querying high-dimensional data sets. Such queries form the basis of data analysis, which is a central task in the scientific process. Several data warehouses and scientific applica-tions use bitmap indices to efficiently access large amounts of read-only data. Over the last few years, we have
devel-oped and deployed bitmap index software (FastBit) that is now used in production analysis of data produced by high-energy physics experiments [26] and for feature extraction and 2D/3D region growing in astrophysics and combusion applications [24, 19]. The performance and functional gains that bitmap indexing provide to data-intensive applications are particularly germane to scientific visualization where in-creasing data size and complexity often exceed the capacity of current visualization architectures as well as overwhelm the scientist with too much visual data.
FastBit software permits scientists to define the subset of data cells that “are interesting” using compound Boolean expressions. For example, in the field of combustion, datasets typically have dozens of quantities per cell repre-senting the concentration of various chemical species in-volved in the combustion process along with fluid dynamics variables like pressure, density and velocity. Combustion researchers are often concerned with tracking combustion processes on the flame front, but the definition of a flame front turns out to be difficult to objectively define in a sim-ple way. Instead, a flamefront is best defined as a set of criteria expressed as a conjunction of boolean clauses: cells where temperature exceeds some threshold and the concen-tration of one or more chemical species lies within some range. Modern scientific datasets are so large and complex that applying visualization techniques to the entire dataset often results in a “thicket of visual noise” where interesting features are visually obscured. It is difficult to remove the visual noise using the clipping, cropping, and sub-setting techniques that are typically available in visualization tools because the feature of interest, the flame front, is topologi-cally complex. Instead, researchers construct a boolean ex-pression specifying conditions likely to contain the flame-front, then FastBit rapidly selects the volume of interest, or data cells that match the selection criteria. Within the DEX tool, these volumes of interest are then used as input to a standard visualization pipeline where other methods can be applied to visualize the data selected by the query operation. FastBit keeps a bitmap for each distinct attribute value
or attribute range (see Section 2). Queries are processed by evaluating a subset of all bitmap indices, which is of-ten considerably smaller than the entire data set. Hence, bitmap indices are able to resolve complex queries using only a fraction of the memory and time that would be re-quired to process the entire dataset. As a consequence, the time complexity of the visualization algorithm can also be significantly reduced for large datasets.
Therefore, the advantages of DEX are two-fold. DEX helps reduce the visual complexity of a visualization by focusing the visualization algorithms exclusively on poten-tially topologically complex regions of interest that are de-fined by the query. DEX also offers significant advantages for large datasets because the efficient indexing scheme en-ables the visualization system to load only the data cells selected by the query rather than examining all cells in the entire dataset. We refer to this visualization methodology as ”Query-Based Visualization.”
The main contributions of this paper are as follows:
• DEX combines highly efficient data management tech-niques with visualization. The combination represents a promising novel approach for high capacity and ca-pability analysis and visualization implementations. We describe our implementation of the DEX tool and the underlying architecture of FastBit.
• We describe visualization methods enabled by ”query-based visualization” technology and support them with example use-cases in combustion and astrophysics re-search.
• Using two scientific datasets, we compare the perfor-mance of DEX with that of traditional visualization al-gorithms.
This paper focuses on two datasets that are represen-tative of the output from cutting-edge scientific codes in High Performance Computing. The first dataset is a temporally evolving reacting methane-air jet from the TeraScale High-Fidelity Simulation of Turbulent Combustion with Detailed Chemistry [21]. The sec-ond dataset is a supernova explosion from the TeraS-cale Supernova Initiative [22].
The paper is organized as follows. In Section 2 we re-view the prior work on bitmap indices and visualization problems that are within the scope of DEX. Section 3 dis-cusses index-based data extraction and explains how bitmap indices are used for region growing and feature extraction. In Section 4 we introduce the architecture of DEX along with an informal time complexity analysis. Typical scien-tific data exploration and visualization use cases a given in Section 5. Performance results are presented in Section 6. We conclude the paper in Section 7 and introduce some fu-ture research challenges.
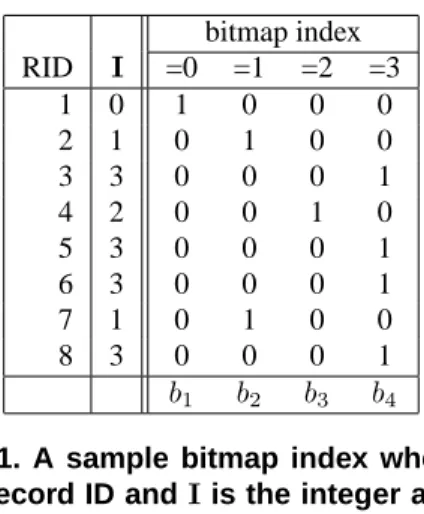
bitmap index RID I =0 =1 =2 =3 1 0 1 0 0 0 2 1 0 1 0 0 3 3 0 0 0 1 4 2 0 0 1 0 5 3 0 0 0 1 6 3 0 0 0 1 7 1 0 1 0 0 8 3 0 0 0 1 b1 b2 b3 b4
Figure 1. A sample bitmap index where RID is the record ID andIis the integer attribute with values in the range of 0 to 3.
2
Related Work
In the following section, we review the concept of bitmap indexing with particular emphasis upon how the bitmap in-dex accelerates multi-dimensional data query operations. To set the stage for later sections of this paper, we discuss the visualization pipeline, with particular emphasis upon isocontouring. Isocontouring is a staple visualization tech-nique that performs an operation on cells that satisfy a sin-gle criteria. To that end, the part of the isocontouring algo-rithm that finds cells satisfying a single criteria is similar to the more general and difficult problem of efficient, multi-dimensional data searching.
2.1
Bitmap Indices
Bitmap indices are one of the most efficient indexing schemes available for speeding up multi-dimensional range queries for read-only or read-mostly data [17, 25]. For an attribute withc distinct values, the basic bitmap index [6] generatescbitmaps withN bits each, whereNis the num-ber of records (cells) in the dataset. Each bit in a bitmap is set to 1 if the attribute in the record is of a specific value, otherwise the bit is set to 0. For example, the integer at-tributeIshown in Figure 1 can be one of four distinct val-ues, 0, 1, 2, and 3. The corresponding bitmap index has four bitmaps. Since the value in record 5 is 3, the fifth bit inb4
is set to 1 and the same bits in other bitmaps are 0. In short, 4 bitmaps are required to encode 4 distinct attribute values. Bitmap indices are efficient for processing multi-dimensional range queries such as “I < 2 andJ > 3”. The queries are evaluated with bitwise logical operations that are well-supported by computer hardware.
For data sets where a given variable may span a large number of distinct values, one concern with bitmap index-ing is that the amount of space required by the bitmap index
could become quite large. One way of reducing the storage requirement is to use bitmap compression. Another is to use a binning strategy, which is described below. Note that an efficient bitmap compression scheme not only has to reduce the size of bitmaps but also has to perform bitwise Boolean operations efficiently.
Several bitmap compression methods were studied in [1, 14]. The authors demonstrated that the scheme named Byte-aligned Bitmap Code (BBC) [2, 3] shows the best overall performance characteristics. More recently a new compression scheme called Word-Aligned Hybrid (WAH) [25] was introduced. It has been shown that even in the worst case, the bitmap indices can be compressed to a size that is comparable with a typical B-tree index. The time re-quired to answer a range query using a compressed bitmap index is in fact optimal. In the worst case, the response time is proportional to the number of hits of the query [25].
The bitmap indices discussed so far encode each dis-tinct attribute value as one bitmap vector. This technique is very efficient for integer or floating point values with low attribute cardinalities. However, scientific data is of-ten based on floating point values with high attribute car-dinalities. The work presented in [20] demonstrated that bitmap indices with binning can significantly speed up multi-dimensional queries for high-cardinality attributes.
2.2
Visualization
The initial demonstration of the DEX tool displays the cells selected by the query. Visually, the selection appears as a “blocky” isosurface. While there is visual similarity be-tween an isosurface computed over a scalar field and the set of cells returned from a complex multidimensional query, the two methods – isosurfacing and bitmap indexing – can-not be directly compared due to a fundamental difference in generality. Specifically, bitmap indices are evaluating multi-dimensional comparisons to define a volume of
inter-est whereas the isosurface is evaluating a scalar to find a surface of interest. Despite the fundamental difference in
generality, a comparison between DEX and isosurface al-gorithms is warranted because the isosurface is the one of the most commonly employed visualization techniques. A time-consuming processing step in any isocontouring algo-rithm is the search for the data cells that satisfy a criteria, namely, that a surface passes through a cell. We are focus-ing our performance comparison between bitmap indexfocus-ing and isocontouring on the task of searching for cells that sat-isfy a single criteria.
To satisfy a search consisting of multiple criteria in a tra-ditional visualization pipeline, one can compute a “derived field” that represents an evaluation of a multi-dimensional objective function producing a scalar field that can then be isosurfaced. Such derived values are akin to an expensive
join operation. The isosurface algorithm is then used to draw a contour (equipotential surface) around the scalar to identify the topologically complex region of interest. If the objective changes, then the algorithm must reload all of the data in order to derive a new scalar using the new objective function. DEX provides this very functionality, but does not need to reload data or derive new fields to evaluate a new objective function. We will demonstrate the efficiency benefits of our approach in Section 6 of the paper.
The bitmap indices are far more general than isosur-faces because they identify a volume of interest rather than a surface of interest. Not only do the bitmap indices sup-port evaluation of equality (x = v, the definition of iso-surface), they can find regions that are less than a value (x < v), greater than a value (x > v), or any complex expression that can be constructed from a Boolean combi-nation of those expressions (x1> v1andx2≤v2and ... ).
The isosurface algorithm generates surface normals, which can be used to implicitly identify the interior of a volume of interest. However, using the surface normals to convert the selected surface-of-interest into a volume of interest re-quires an additional, potentially expensive algorithmic step. Consequently, the locus of comparison between DEX and the isosurface algorithm is restricted to evaluation of equal-ity (surface finding). This artificial limit helps provide a basis for comparing the performance of isocontouring to bitmap index queries by evaluating simple equality expres-sions (e.g. find all cells satisfying the expression(SELECT data from t WHERE cell[i]=scalar value).
The most widely used isosurfacing technique is March-ing Cubes [16]. MarchMarch-ing cubes improves the efficiency of surface generation at each cell that intersects the surface, but must examine every cell in the dataset to find the cells that intersect the surface. Marching cubes accelerate sur-face generation by using a state table that enumerates the finite number of surface-edge intersections. A number of algorithms have been developed to accelerate the process of finding cells that intersect the desired surface. These oper-ate by reducing the number of cells that must be evaluoper-ated by culling cells that are either out of range (value based) or are not visible due to occlusion (view based). According to [9] isosurfacing algorithms can be classified as either view-dependent or view-inview-dependent. The view-view-dependent algo-rithms mainly perform computation on regions that make up substantial parts of the final image. View-independent al-gorithms, on the other hand, generate geometry on all cells containing the surface regardless of whether or not they are visible. Since one of the goals of DEX is to perform inter-active, feature-based analysis, view-independent algorithms form the basis of comparison in this paper.
One key technique used in view-independent isosurface acceleration is I/O-optimal isosurfacing where interval-tree indexing structures help rapidly locate those cells
contain-ing the surface. A number of methods make use of octrees [23] for searches, but the octree approach is impractical for data containing small-scale fluctuations or noise since most of the tree will be traversed. Another example of an index-accelerated isosurfacing algorithm is NOISE [15], which makes use of a k-d tree [4] to accelerate the search. NOISE searches over points in 2D rather than a full 3D interval search. ISSUE [18] further improves on NOISE by using a 2D regular lattice rather than a k-d tree in the search phase. The isosurfacing algorithms described above rely on in-dex data structures that remain entirely memory-resident to speed up isosurface extraction. By contrast, FastBit can op-erate almost entirely out-of-core, thereby minimizing the memory footprint when used on extremely large datasets that otherwise would not fit into main memory. An interac-tive isosurface extraction method based on an out-of-core, i.e. non-memory resident, index data structure, is presented in [8].
The isosurface algorithms found in typical visualiza-tion frameworks operate only on scalar data values. They do not directly support multi-dimensional feature-based searches for interactive refinement of feature values such as
temperatureor pressure. As described earlier, locating cells that satisfy a multi-dimensional feature query using traditional visualization tools requires generating a derived field, which is akin to an an expensive join operation. DEX, however, evaluates multi-dimensional feature bitmap index queries, which do not require expensive joins.
In DEX, isosurface extraction is only one of several sup-ported features. Apart from computing scalar equipoten-tial surfaces, we are mainly interested in reconstructing the whole data volume of the extracted regions. Typically this data volume is further processed in scientific applications such as analysis of flame fronts [24].
3
Index-Based Data Extraction
Bitmap indices have been successfully applied in large-scale scientific analysis. Recently we demonstrated that bitmap indices can also be applied efficiently for 2D and 3D region growing problems [24, 19]. In this section we will re-view some of these fundamental assumptions and ideas that are important for understanding the complete visualization pipeline that we introduce in Section 4.
Many scientific datasets are spatio-temporal in nature be-cause they compute or are measurements of physical quan-tities that vary in space and time. For example, a simulation of the combustion process computes the concentrations of all chemical species along with pressure and temperature [10, 13]. One common operation in mining these datasets is to derive quantities on regions of interest, for instance, the total heat output from an ignition kernel in the combustion simulation. Computing derived quantities, which can itself
be an expensive operation, is accelerated by efficiently iden-tify regions of interest (feature extraction).
Our assumption is that the datasets are based on regu-lar discretization of space as used in the Direct Numerical Simulations of combustion on uniform 2D or 3D meshes [10, 13]. In these cases, the space is discretized into small cells according to the raster scan order [24]. The quantities on each cell are computed at varying time values and are grouped by time steps.
After the user specifies the selection critera, the process of identifying regions of interest is usually divided into two steps. The feature extraction step (search step) locates cells that satisfy the search criteria. The region growing step groups the selected cells into connected regions.
In order to identify regions of interest, data structures like the Quad-tree and R-Tree [12] partition cells according to their spatial coordinates. Apart from the well-known fact that these data structure are efficient only for relatively low dimensional data, they also separate cells that are neighbors in space. As a result of the spatial separation, the efficiency of region growing algorithm is often impeded [24].
DEX preserves the spatial order of the cells, thus avoid-ing the need for base data reorderavoid-ing and reducavoid-ing the time required to build the bitmap indices. Another benefit is that the compressed bitmap, which is produced as the result of the feature extraction step, can be easily turned into blocks of connected cells.
4
DEX - Dexterous Data Explorer
4.1
Design and Functionality
The DEX tool combines the FastBit query engine with 3D visualization methods. The result is the ability to per-form interactive feature-based analysis and region finding for high-dimensional queries. By displaying the resulting regions of interest, application scientists can quickly iden-tify characteristic features of their data. We refer to this approach to visualization as query-driven visual data
anal-ysis. Query-driven data analysis methods allow a scientist to
define a search criteria as a Boolean expression. The search only returns the subset of data that matches the search cri-teria, thereby reducing load on the downstreaming visual-ization pipeline as well as reducing the “visual load” on the scientist. Visualization processing and visual interpre-tation is limited only to data defined to be relevant. The scope-limiting afforded by query-driving visual data anal-ysis represents a leap forward in capabilities for scientific researchers.
The version of DEX we describe in this paper uses the Fast Light Toolkit (FLTK) for the graphical user interface (GUI), the Visualization ToolKit (VTK) for visualization
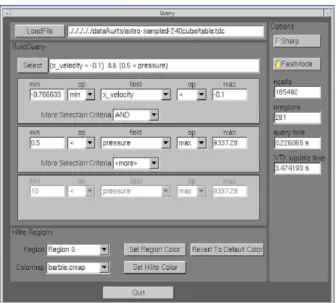
Figure 2. Graphical User Interface of DEX. 2-dimensional query on supernova data.
processing, and OpenGL for hardware accelerated 3D ren-dering. The graphical user interface, shown in Figure 2, demonstrates a two-dimensional query for extracting re-gions of interest. The result of this query selection is then visualized as shown in Figure 3.
The DEX user interface, seen in Figure 2, lays out the typical pipeline for a data analysis task in a top-to-bottom flow. The top portion of the user interface allows the user to select a dataset by either typing a filename or using the file browser dialog. The middle section of the GUI guides the user through the process of building a complex query, which is displayed just below the file selection dialog as it is being constructed. Finally, the bottom section of the GUI supports various ways of manipulating the regions of interest identified by the region growing algorithm. Future versions of the tool will add controls on the bottom portion of the interface that control a broader range of visualization techniques that could be applied to the cells returned from the search. These techniques include but are not limited to slicing, transfer function manipulation, thresholding, vec-tor/tensor visualization algorithmic control, etc.
The majority of the code in DEX translates the query re-sults into a dataset that can be processed efficiently using the VTK pipeline shown in Figure 4. FastBit operates on uni-form structured grids like those stored in HDF or NetCDF format. However, the data returned by a selection is ex-pressed as a list of disjoint rectilinear regions that match the selection criteria. Consequently, the selected data is encoded as an unstructured grid comprised of hexahedral cells. The resulting unstructured dataset is assembled in
Figure 3. 3D Visualization of supernova explosion based on user query of Figure 2.
Figure 4. A typical visualization pipeline in VTK.
memory as a vtkUnstructuredGrid dataset and handed off to a standard VTK pipeline suitable for use with unstruc-tured grids (see Figure 4). The user can then interactively
view the geometric model resulting from the selection in 3D using the hardware accelerated graphics.
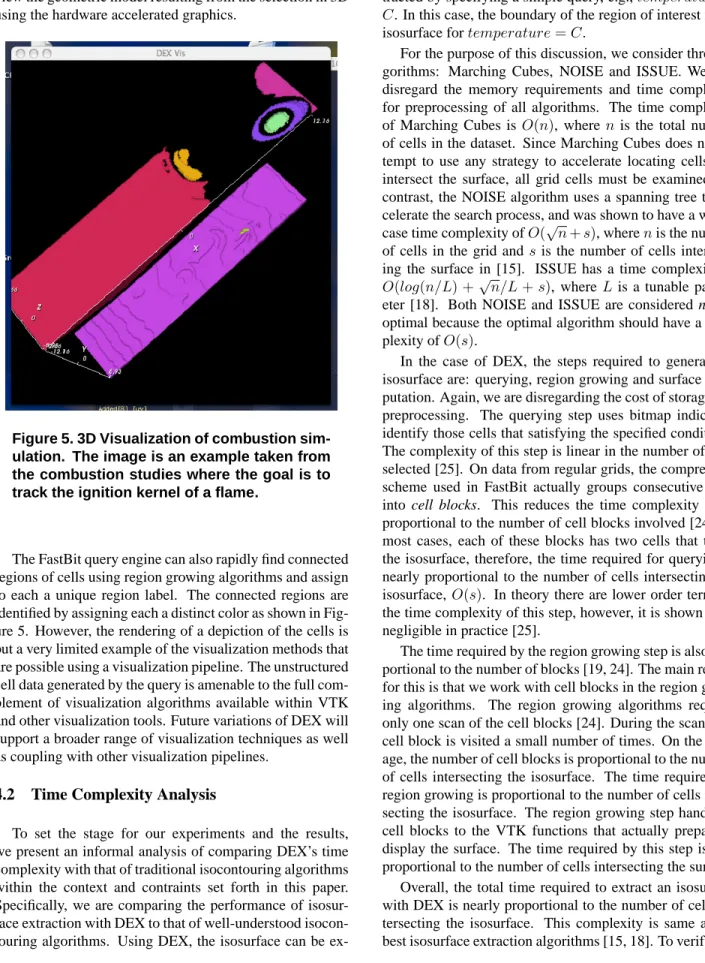
Figure 5. 3D Visualization of combustion sim-ulation. The image is an example taken from the combustion studies where the goal is to track the ignition kernel of a flame.
The FastBit query engine can also rapidly find connected regions of cells using region growing algorithms and assign to each a unique region label. The connected regions are identified by assigning each a distinct color as shown in Fig-ure 5. However, the rendering of a depiction of the cells is but a very limited example of the visualization methods that are possible using a visualization pipeline. The unstructured cell data generated by the query is amenable to the full com-plement of visualization algorithms available within VTK and other visualization tools. Future variations of DEX will support a broader range of visualization techniques as well as coupling with other visualization pipelines.
4.2
Time Complexity Analysis
To set the stage for our experiments and the results, we present an informal analysis of comparing DEX’s time complexity with that of traditional isocontouring algorithms within the context and contraints set forth in this paper. Specifically, we are comparing the performance of isosur-face extraction with DEX to that of well-understood isocon-touring algorithms. Using DEX, the isosurface can be
ex-tracted by specifying a simple query, e.g.,temperature > C. In this case, the boundary of the region of interest is the isosurface fortemperature=C.
For the purpose of this discussion, we consider three al-gorithms: Marching Cubes, NOISE and ISSUE. We also disregard the memory requirements and time complexity for preprocessing of all algorithms. The time complexity of Marching Cubes is O(n), where nis the total number of cells in the dataset. Since Marching Cubes does not at-tempt to use any strategy to accelerate locating cells that intersect the surface, all grid cells must be examined. In contrast, the NOISE algorithm uses a spanning tree to ac-celerate the search process, and was shown to have a worst-case time complexity ofO(√n+s), wherenis the number of cells in the grid and sis the number of cells intersect-ing the surface in [15]. ISSUE has a time complexity of
O(log(n/L) +√n/L+s), whereL is a tunable param-eter [18]. Both NOISE and ISSUE are considered nearly optimal because the optimal algorithm should have a com-plexity ofO(s).
In the case of DEX, the steps required to generate an isosurface are: querying, region growing and surface com-putation. Again, we are disregarding the cost of storage and preprocessing. The querying step uses bitmap indices to identify those cells that satisfying the specified conditions. The complexity of this step is linear in the number of cells selected [25]. On data from regular grids, the compression scheme used in FastBit actually groups consecutive cells into cell blocks. This reduces the time complexity to be proportional to the number of cell blocks involved [24]. In most cases, each of these blocks has two cells that touch the isosurface, therefore, the time required for querying is nearly proportional to the number of cells intersecting the isosurface, O(s). In theory there are lower order terms in the time complexity of this step, however, it is shown to be negligible in practice [25].
The time required by the region growing step is also pro-portional to the number of blocks [19, 24]. The main reason for this is that we work with cell blocks in the region grow-ing algorithms. The region growgrow-ing algorithms requires only one scan of the cell blocks [24]. During the scan each cell block is visited a small number of times. On the aver-age, the number of cell blocks is proportional to the number of cells intersecting the isosurface. The time required for region growing is proportional to the number of cells inter-secting the isosurface. The region growing step hands the cell blocks to the VTK functions that actually prepare to display the surface. The time required by this step is also proportional to the number of cells intersecting the surface. Overall, the total time required to extract an isosurface with DEX is nearly proportional to the number of cells in-tersecting the isosurface. This complexity is same as the best isosurface extraction algorithms [15, 18]. To verify this
analysis, in Section 6, we will present some timing results to compare DEX against the best isosurface extraction al-gorithm available to us.
5
Use Cases
In this section we discuss two use cases where DEX is employed to produce query-driven visual data analysis. These two uses cases – one from Combustion and one from Astrophysics – form the basis for our experiments, which are described in the next section.
5.1
Combustion
Combustion research involves tracking numerous species of molecules through complex chemical reaction networks. Tracking the flame front helps researchers better understand the properties required for efficient combustion. However, the definition of the flame front is ambiguous in practice – it is identified by a complex set of criteria. DEX uses the FastBit infrastructure to rapidly select the data satisfying a set of user-specified conditions believed to characterize the flame front, then performs visual analysis on the resulting data. Each distinct, fully grown region representing a flame front is labeled with color to help the researcher visually identify and track these features over multiple time-steps of the dataset.
5.2
Astrophysics
Like the combustion research example, astrophysics simulations produce data that have many fields at each grid point. Simulations of stellar phenomena like supernovae re-quire tracking the mass fractions of many different chemical species, radiation emission and absorption profiles for radi-ation transport, baryonic densities, along with typical fluid dynamics properties (e.g. pressure, temperature, flow vec-tors). DEX helps researchers understand the complex rela-tionships between different fields in the data using query-based exploration methods. The 3D viewing interface pro-vides all of the advantages of typical interactive visualiza-tion tool approaches, but the FastBit query mechanism en-sures that even large datasets can be explored at interactive rates via the accelerated searches.
6
Experiments
In this section we evaluate the efficiency of DEX with two different scientific datasets. For one-dimensional queries, we compare the performance of DEX with three different isosurface algorithms of VTK. The isosurface algorithms are vtkMarchingCubes, vtkContourFilter and
vtkKitwareContourFilter. The experiments were carried out
on a 2.8 GHz Intel Pentium IV with 2 GB RAM. The I/O subsystem is a hardware RAID with two SCSI disks. In our tests, we compare the performance of DEX with three different isosurface algorithms provided by VTK.
6.1
Combustion
The first dataset is a temporally evolving reacting methane-air jet from the TeraScale High-Fidelity Simu-lation of Turbulent Combustion with Detailed Chemistry [21]. The data set consists of some 2.7 million data points with 10 feature values that include chemical species and fluid dynamics variables. For each feature value we built a compressed, range-encoded bitmap index with 100 bins.
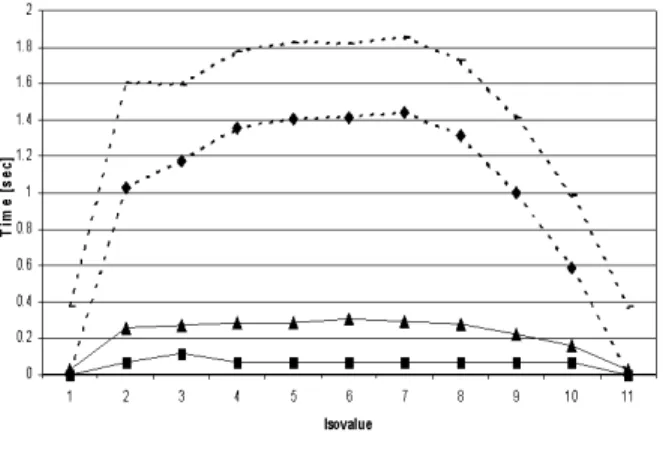
Figure 6. Isosurface extraction for combus-tion data. DEX vs. three different isosurface algorithms of VTK.
In this set of experiments, we compare the performance of DEX with three different isosurface algorithms of VTK. We measure the time for extracting an isosurface with VTK for the feature valueCH4with 11 different, randomly
cho-sen isovalues covering the entire domain space. For our ex-periments we are only interested in the data processing time and do not report on the time for rendering. The results are shown in Figure 6. vtkContourFilter is the least per-formant algorithm, vtkKitwareContourFilter is the fastest VTK algorithm. In all cases DEX performs significantly better than any of VTK’s isosurfacing algorithms. On aver-age DEX outperforms the best isosurface algorithm in VTK by a factor of four. Note that DEX not only extracts an isosurface, but also finds the entire volume of cells that lie inside the surface. This is a notable functional difference between DEX and traditional isosurface algorithms.
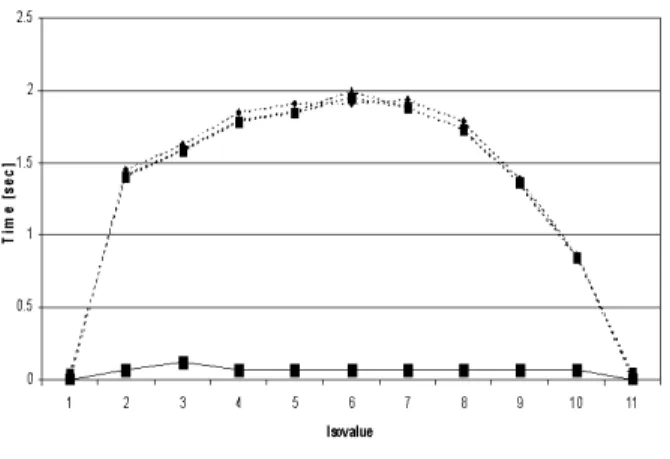
Figure 7. Isosurface extraction for combus-tion data. DEX vs. four different isosurface algorithms of VTK. Note: We forced the us-age of scalarTree for accelerating isosurface extraction in VTK.
In the next set of tests we forced the usage of “scalarTree” in VTK. This is an index structure for accel-erating isosurface extraction in VTK. As we can see in Fig-ure 7, the acceleration technique did not improve the per-formance of VTK’s algorithm. On the contrary, the perfor-mance gain of DEX is even more significant.
6.2
Astrophysics
The second dataset is based on a simulated supernova explosion computed by the TeraScale Supernova Initiative [22]. It consists of a2403mesh, i.e. some 13.8 million data
points, with six variables per grid point. They are the
x-velocity, y-x-velocity, z-x-velocity, entropy, density and pressure
of the supernova explosion. For each variable,we built a compressed, range-encoded bitmap index with 100 bins.
As in the previous experiments, we measure the time for extracting an isosurface with VTK for the variable value
x-velocity using eleven different, randomly chosen isovalues
covering the entire domain space. In our experiments, we are interested only in the data processing time and do not report on the time for rendering. The results for the three different isosurface algorithms of VTK are shown in Figure 8. We can see that in all cases DEX is significantly faster than the best VTK isosurface algorithm. On average, DEX’s isosurface extraction is three times faster than the best VTK isosurface algorithm.
We also ran the benchmarks using the “scalarTree” op-tion in VTK. Similar to the results we obtained from the combustion data, the performance gain of DEX is even
Figure 8. Isosurface extraction for supernova data. DEX vs. three different isosurface algo-rithms of VTK.
more significant (see Figure 9).
Figure 9. Isosurface extraction for supernova data. DEX vs. four different isosurface algo-rithms of VTK. Note: We forced the usage of scalarTree for accelerating isosurface extrac-tion in VTK.
The major advantage of DEX over traditional visualiza-tion frameworks is that it also supports multi-dimensional feature-based queries. This is a novel research area that is not supported in previous visualization frameworks.
6.3
Observations
Our tests show that DEX outperforms the isosurface ex-traction algorithms available from VTK. The scalarTree used by VTK builds a spanning tree to accelerate the isosur-face extraction algorithms. This is similar to the approach used by DEX where compressed bitmap indices are used. The spanning trees and bitmap indices all reduce the vol-ume of data used during isosurface extraction. Testing re-sults suggest that our bitmap index scheme is more effective since it uses less time. Because the test data are from regu-lar meshes, DEX directly takes advantage of this fact, while the particular version of spanning tree used by VTK was designed for irregular meshes. This may explain why the VTK functions require more time in most cases.
7
Conclusions and Future Work
In this paper we presented the architecture of DEX (short for dexterous data explorer). We showed that DEX com-bines highly efficient data management techniques with tra-ditional visualization pipelines to produce a new capability we refer to as “query-driven data analysis”. Bitmap indices are used to quickly locate features in data and grow them into connected regions. The results are then used as input to the visualization pipeline.
We compared the performance of DEX to traditional isosurfacing, which is a common visualization task. We showed that our approach outperforms the fastest isosur-face algorithm in VTK by, on the average, a factor of four when considering the time required to locate cells that sat-isfy a search criteria. While traditional isosurface algo-rithms find cells that meet a single criteria – where a sur-face passes through a cell – our approach supports complex multi-dimensional queries. The main advantage of DEX, however, is that it combines multi-dimensional feature ex-traction queries with 3D visualization. This new capability, which is not supported in traditional visualization frame-works, allows scientists to get a better visual understanding of the analysis results and has to potential to open the door for new science. It reduces the processing load in the vi-sualization pipeline by limiting processing to data that is “scientifically interesting,” and as such is a new approach for visual analysis of large and complex scientific data.
To build on the results we present in this paper, we sug-gest the following as logical next steps for future research.
• Expand the capabilities of DEX to support queries on adaptive mesh refinement (AMR) [5]) data. Many computational science projects make use of Berger-Colella hierarchical adaptive mesh algorithms, but these data structures pose unique challenges for Fast-Bit methods because data values on refined grids
over-lap those on the coarser grids. A feature that is ap-parent in the refined grid may not meet the selection criteria in the coarser grid – or vice verse.
• Provide direct support for multi-resolution data queries. Currently, a query may return selections that are larger than the available memory of a worksta-tion. A multi-resolution query operation will use a low-resolution query to estimate the size of the selec-tion and use that informaselec-tion to select an intermediate level of resolution for the query. This can be keyed off of the current viewing angle of the dataset so that the queries only return with a Level-of-Detail that is warranted by the current viewing angle and screen res-olution so that no features that are smaller than a single pixel in screen space need to be returned. This can also be extended to support view-culled queries where por-tions of the selection that would otherwise be outside of the viewable screen area will be excluded from the query.
8
Acknowledgments
We thank Jacqueline Chen (Sandia National Laborato-ries, California) and John Blondin (North Carolina State University) for the scientific datasets used in this paper. This work was supported by the Director, Office of Science, Office of Advanced Scientific Computing Research, of the U.S. Department of Energy under Contract No. DE-AC03-76SF00098.
References
[1] S. Amer-Yahia and T. Johnson. Optimizing Queries on Compressed Bitmaps. In International Conference
on Very Large Data Bases, Cairo, Egypt, September
2000. Morgan Kaufmann.
[2] G. Antoshenkov. Byte-aligned Bitmap Compression. Technical report, Oracle Corp., 1994. U.S. Patent number 5,363,098.
[3] G. Antoshenkov and M. Ziauddin. Query Processing and Optimization in ORACLE RDB. VLDB Journal, 5:229–237, 1996.
[4] J. L. Bentley. Multidimensional binary search trees used for associative search. Comm. ACM, 18(9):509– 516, 1975.
[5] M. Berger and P. Colella. Local Adaptive Mesh Re-finement for Shock Hydrodynamics. Journal of
[6] C. Y. Chan and Y. E. Ioannidis. An Efficient Bitmap Encoding Scheme for Selection Queries. In SIGMOD, Philadelphia, Pennsylvania, USA, June 1999. ACM Press.
[7] F. Chang, C.-J. Chen, and C.-J. Lu. A Linear-Time Component-Labeling Algorithm Using Contour Trac-ing Technique. Computer Vision Image
Understand-ing, 93(2):206–220, 2004.
[8] Y.-J. Chiang, C. T. Silva, and W. J. Schroeder. In-teractive Out-Of-Core Isosurface Extraction. In IEEE
Visualization, Research Triangle Park, North Carolina,
USA, October 1998. IEEE Computer Society Press. [9] C. S. Co, B. Hamann, and K. I. Joy. Iso-Splatting:
A Point-based Alternative to Isosurface Visualization. In Proceedings of the Eleventh Pacific Conference on
Computer Graphics and Applications - Pacific Graph-ics 2003, Canmore, Alberta, Canada, October 2003.
[10] T. Echekki and J. H. Chen. Direct Numerical Simula-tion of AutoigniSimula-tion in non-Homogeneous Hydrogen-Air Mixtures, 2003. Combustion and Flame.
[11] C. Fiorio and J. Gustedt. Two Linear Time Union-Find Strategies for Image Processing. Theoretical
Com-puter Science, 154(2):165–181, 1996.
[12] V. Gaede and O. G¨unther. Multidimension Access Methods. ACM Computing Surveys, 30(2):170–231, 1998.
[13] H. G. Im, J. H. Chen, and C. K. Law. Ignition of Hydrogen/Air Mixing Layer in Turbulent Flows. In
27th International Symposium on Combustion, The Combustion Institute, pages 1047–1056, Boulder, CO,
1998.
[14] T. Johnson. Performance Measurements of Com-pressed Bitmap Indices. In International
Confer-ence on Very Large Data Bases, Edinburgh, Scotland,
September 1999. Morgan Kaufmann.
[15] Y. Livnat, H. W. Shen, and C. R. Johnson. A Near Op-timal Isosurface Extraction Algorithm Using the Span Space. IEEE Transactions on Visualization and
Com-puter Graphics, 2(1), March 1996.
[16] W. E. Lorensen and H. E. Cline. Maching Cubes: A High Resolution 3D Surface Construction Algorithm.
Computer Graphics, 21(4):163–169, 1987.
[17] P. O’Neil. Model 204 Architecture and Perfor-mance. In 2nd International Workshop in High
Per-formance Transaction Systems, Asilomar, California,
USA, 1987. Springer-Verlag.
[18] H. W. Shen, C. D. Hansen, Y. Livnat, and C. R. John-son. Isosurfacing in Span Space with Utmost Effi-ciency (ISSUE). In IEEE Visualization ‘96, San Fran-cisco, CA, USA, October 1996.
[19] K. Stockinger and K. Wu. Improved Searching for Spatial Features in Spatio-Temporal Data. Techni-cal report, Lawrence Berkeley National Laboratory, Berkeley, California, USA, September 2004. LBNL-56376.
[20] K. Stockinger, K. Wu, and A. Shoshani. Evaluation Strategies for Bitmap Indices with Binning. In
In-ternational Conference on Database and Expert Sys-tems Applications (DEXA), Zaragoza, Spain,
Septem-ber 2004. Springer-Verlag.
[21] TeraScale High-Fidelity Simulation of Tur-bulent Combustion with Detailed Chemistry. http://www.scidac.psc.edu.
[22] TeraScale Supernova Initiative. http://www.phy.ornl.gov/tsi/.
[23] J. Wilhelms and A. Van Gelder. Octrees for Faster Iso-surface Generation. ACM Transactions on Graphics, 11(3):201–227, 1992.
[24] K. Wu, W. Koegler, J. Chen, and A. Shoshani. Us-ing bitmap index for interactive exploration of large datasets. In International Conference on Scientific and
Statistical Database Management (SSDBM),
Cam-bridge, Massachusetts, USA, July 2003. IEEE Com-puter Society Press.
[25] K. Wu, E. J. Otoo, and A. Shoshani. On the Per-formance of Bitmap Indices for High Cardinality At-tributes. In International Conference on Very Large
Data Bases, Toronto, Canada, September 2004.
Mor-gan Kaufmann.
[26] K. Wu, W.-M. Zhang, V. Perevoztchikov, J. Lauret, and A. Shoshani. The Grid Collector: Using an Event Catalog to Speedup User Analysis in Distributed En-vironment. In Computing in High Energy and
Nu-clear Physics (CHEP) 2004, Interlaken, Switzerland,