Multiple Sclerosis 16(1) 45–54
!The Author(s), 2010. Reprints and permissions:
sagepub.co.uk/journalsPermissions.nav DOI: 10.1177/1352458509351896 msj.sagepub.com
A voxel-based morphometry study of
disease severity correlates in relapsing–
remitting multiple sclerosis
A Prinster
1,2, M Quarantelli
1, R Lanzillo
3,4, G Orefice
3,
G Vacca
3, B Carotenuto
5, B Alfano
1, A Brunetti
6,
V Brescia Morra
3and M Salvatore
5Abstract
Previous studies have shown a preferential loss of grey matter in fronto-temporal regions in patients with multiple sclerosis. Studies of correlates of disease severity are more controversial, because some studies have suggested an association between sensorimotor cortex atrophy and Expanded Disability Status Scale score, while others did not find such a correlation. The objective of this study was to assess the correlation of regional loss of grey matter and white matter with indexes of clinical and radiological severity in relapsing–remitting multiple sclerosis, including the Expanded Disability Status Scale and lesion load. Correlations between Expanded Disability Status Scale, lesion load and disease duration were assessed in 128 patients with relapsing–remitting multiple sclerosis (Expanded Disability Status Scale range 1.0–6.0) using optimized voxel-based morphometry. Bilateral loss of grey matter in sensorimotor cortices was correlated with Expanded Disability Status Scale, and tissue loss also involved adjacent white matter, extending along pyramidal tracts to the brainstem. Increasing lesion load was correlated with loss of deep grey matter and white matter. No specific region of grey matter or white matter showed a significant correlation with disease duration. These findings support the hypothesis that motor neuron involvement plays a major role in the progression of physical disability. Lesion load accrual affects mainly highly interconnected subcortical structures, while disease duration has a less significant impact on brain atrophy, probably owing to the inter-subject heterogeneity of the clinical course of the disease.
Keywords
multiple sclerosis, relapsing–remitting, voxel-based morphometry, Expanded Disability Status Scale, lesion load, cortical atrophy
Date received: 26th February 2009; accepted: 10th September 2009
Introduction
The results from previous studies of regional brain tissue loss in multiple sclerosis (MS) suggest that grey matter (GM) atrophy, in patients affected by relapsing– remitting (RR-)MS, is located preferentially in specific regions of the brain, including motor areas1,2 and thalami.3 Few studies have addressed the correlations between regional brain atrophy and indexes of disease severity, including disability and lesion load (LL), and they provide somewhat conflicting results.1,2,4–6
In particular Chen et al.5 and Sailer et al.,2 in two small groups including both RR and secondary progres-sive (SP-)MS patients, found a significant thinning of the motor areas in patients with more severe disability. However, other studies focusing on RR-MS were not able to detect significant correlations between motor cortex atrophy and clinical disability in small groups of patients,1,6or in the early phases of the disease.4
When assessing the relationship of atrophy with LL, Sailer et al. found a significant thinning of the prefron-tal cortex in a subgroup of patients with higher LL, as compared to the control group.2Charil et al. demon-strated a preferential correlation of cortical thickness with T2-LL in bilateral anterior cingulate gyrus,
1
Biostructure and Bioimaging Institute, National Research Council, Naples, Italy.
2
SDN Foundation, Naples, Italy.
3
Department of Neurological Sciences, University ‘Federico II’, Naples, Italy.
4Neurology, Hermitage Hospital, Capodimonte, Naples, Italy.
5Department of Biomorphological and Functional Sciences, University
‘Federico II’, Naples, Italy.
6Neuroradiology, University ‘Federico II’, Naples, Italy.
Corresponding author:
Anna Prinster, PhD, Biostructure and Bioimaging Institute, National Council for Research, Edificio 10, Via Pansini, 5, 80131 Napoli, Italy. Email: [email protected]
bilateral posterior insular cortex in the vicinity of the transverse temporal gyrus, right anterior and middle temporal gyri and left inferior frontal and orbital gyri.4 Other groups have shown a significant correla-tion between LL and GM volume in the caudates,1the frontal and parietal cortices in a longitudinal study,7 and thalami in transversal studies.6
All these attempts at correlating regional brain tissue loss and disease severity have focused on GM volume or cortical thinning, while correlates of regional white matter (WM) volume have not been assessed, although WM loss has been demonstrated in different cohorts of MS patients,8,9and may play a role in determining dis-ease severity.
Voxel-based morphometry (VBM),10 a fully auto-mated technique used to assess the density of brain tissues at a voxel level, has been applied previously to assess the regional distribution of GM loss in RR-MS,1,3,6,7 and is suitable for the study of changes in the volume of both GM and WM.
The aim of the present study was to assess the cor-relation between regional losses of GM and WM and indexes of disease severity, including clinical disability (as measured by the Expanded Disability Status Scale, EDSS) and LL, in a large group of patients with pure RR-MS, using VBM.
Materials and methods
Participants
One-hundred and twenty-eight patients (86 female) with MS, clinically defined according to Poser criteria,11and with an RR course12were recruited into the study. The mean age of the patient group was 36.079.2 years (range 18–58 years), with a mean disease duration (DD) of 10.147.2 years (range 0.3–30.8 years) and a median EDSS score of 2.8 (range 1.0–6.0).13
The exclusion criteria for this study included treat-ment with corticosteroids within the preceding 28 days, previous treatment with cyclophosphamide, azathiopr-ine, methotrexate, mithoxantrone or cyclosporazathiopr-ine, or previous treatment with any experimental immunomo-dulating drug.
At the time of the scan 13 patients were drug naive, while the remaining patients had for at least six months been given interferon beta (108 patients on interferon beta-1a, 7 on interferon beta-1b).
Thirty-five healthy participants (18 female) were also included in the analysis for comparison. The mean age of the normal volunteer (NV) group was 38.3110.97 years (range 22–57 years). All subjects agreed to partic-ipate in the study by signing a written informed con-sent, and the ethical committees of the participating institutions had previously approved the protocol.
Magnetic resonance imaging studies
The magnetic resonance imaging (MRI) protocol included two interleaved sets of 16 slices each covering the whole brain, which were obtained at 1.5 T (Intera, Philips Medical Systems, the Netherlands), sampling the brain at a total of 32 contiguous levels. Each of the two sets included conventional spin-echo sequences providing T1w (520/15 ms TR/TE) and PD/T2w (1800/ 15–90 ms TR/TE) 4 mm thick axial images (24 cm FOV, 256256 acquisition matrix).
Voxel-based morphometry analysis
The MRI volumes were preliminarily segmented into GM, normal and abnormal WM, and cerebrospinal fluid (CSF) using a fully automated relaxometric method described in detail elsewhere,1,14 which pro-vides the binary maps of normal-appearing GM, normal-appearing WM, abnormal WM (providing the T2-w lesion load) and CSF. A previous work that assessed the accuracy of segmentation of both nor-mal and abnornor-mal tissues demonstrated a lack of a LL-associated bias in the measure of brain tis-sue volumes (100% recovery of GM volume, with a non-significant correlation between GM volume and LL).1
The volumes of GM and total WM (hereinafter WM indicates the sum of both normal-appearing and abnor-mal WM) were analysed, using optimized VBM analy-sis,10,15 to assess both regional differences between the NV and MS groups, and correlations with EDSS and LL in the MS group.
The VBM was performed using the Statistical Parametric Mapping software (SPM5, Wellcome Department of Cognitive Neurology, London, UK, http://www.fil.ion.ucl.ac.uk/spm)16 running under
MATLAB version 6 (the Mathworks, Inc.,
Massachusetts, USA). Details of the protocol for opti-mized VBM as applied to segmented volumes has been described in detail elsewhere.1
Briefly, for each of the two analysed types of brain tissue (GM and WM), preprocessing included the fol-lowing steps:
– Normalization of the GM and WM maps of each participant to the MNI (Montreal Neurological Institute) space using the SPM5 mean GM and WM templates with a 12-parameter affine model without any nonlinear component.17 Nonlinear components were not used for template creation in order to pre-serve group affine geometry.18
– Creation of GM and WM templates specific for site and group, which were obtained by averaging the corresponding roughly normalized brain tissue volumes obtained in the previous step, and by
subsequent smoothing with a Gaussian filter of 8 mm full-width at half-maximum (FWHM).
– Non-linear normalization of the original GM and WM maps to the corresponding site- and study-specific templates with 16 non-linear iterations using 686 basis functions to account for global shape differences.19 Normalized images were resampled by trilinear interpolation to 111 mm3 voxel size.
– The resulting normalized images were then modu-lated by multiplying the GM and WM voxels by the Jacobians derived from the corresponding spatial normalization parameters, to preserve the amount of the specific tissue in each voxel.10
– Finally, the modulated images were smoothed with a 12 mm FWHM isotropic Gaussian filter to reduce con-founding by individual variations in gyral anatomy and to render the data more normally distributed as per the Gaussian random field model underlying the statistical process used for adjustingp-values.17
Statistical analysis
The effect of the disease on global brain tissue volumes was preliminarily tested, separately for GM, WM and CSF, by stepwise multiple regression analysis using SPSS (SPSS Inc., Chicago, Illinois, USA). Total intra-cranial volume (ICV, the sum of GM, WM and CSF), age and sex were entered first into the model to account for the possible effects of these variables. Subject group (NV versus MS) was then entered to explore the effect of the disease. Subsequently, LL, EDSS and DD were entered to test for the possible effect of these variables on global brain tissue volumes in MS patients. The sig-nificance level was set to 0.05, and corrected for multi-ple comparisons according to Bonferroni.
To search for regional correlations between brain tissue volumes and clinical variables, normalized modu-lated GM and WM volumes were analysed separately at voxel level using a generalized linear model, with correc-tion for multiple comparisons based on the random Gaussian field theory,16including age and sex as nuisance regressors (confounding covariates) in an analysis of cov-ariance (ANCOVA), to take into account their effect on brain tissue volumes. The ICV was included in the model to normalize for head size.
Prior to regression analysis, scans were thresholded at a fixed intensity value of 25 to reduce the influence of any remaining non-brain tissue. Correlations for GM and WM were assessed separately versus group (NV or MS), EDSS, LL and DD. For each correlation both direct and inverse contrasts were probed. Ap-value of 0.05 FWE Family-wise error-corrected at voxel level was used for comparisons between NV and MS patients.
Correlations between GM or WM and EDSS, LL and DD were examined only in regions found pre-viously to be abnormal in the MS patient group. For this purpose, an inclusive mask was built using the con-trol versus patient statistical map with a more lenient statistical threshold ofp<0.05, corrected for false dis-covery rate.20Within this mask, the clusters were con-sidered significant at p<0.05, corrected for multiple comparisons at the cluster level.
Results
The mean LL was 6.89.28 cc (meanSD, range 0–46.0 cc). Analysis of the global tissue volumes of our patient population showed significantly decreased GM volume (45.93.7% and 47.63.7% of ICV respectively for MS patients and NV,p<0.05 on mul-tiple regression analysis) and WM volume (37.13.1% and 38.92.2%, p<0.005), as compared with NV, and a correspondingly significant increase in CSF (17.05.4% and 13.53.3%,p<0.0005).
When assessing the correlation of global tissue volumes with clinical parameters, we found a significant linear correlation of GM loss with LL (p¼0.001), while it only approached significance when tested versus DD (p¼0.04) and EDSS (p¼0.06). The WM loss corre-lated significantly with DD (p<0.01), LL (p<0.00005) and EDSS (p<0.0001). The volume of CSF correlated with DD (p<0.005), LL (p<0.000005) and EDSS (p<0.0005).
Table 1 reports the clusters of significant GM loss in MS patients, compared with NV. For each cluster, the extension and the corresponding Brodmann Areas (BA) in which local maxima are located, along with the coordinates in the Talairach space,21 and the T level of the most significant voxel are reported.
In RR-MS, loss of GM involves preferentially the left fronto-temporal cortex and precuneus, as well as the anterior cingulate gyrus and the caudate nuclei bilaterally, and to a minor extent the right fronto-temporal cortex and right parietal lobule. The VBM analysis of WM indicated preferential areas of WM loss in RR-MS bilaterally in the periventricular regions in the temporal lobes, juxtacortical insular regions, extending posteriorly through the internal capsule to the thalami, and to the splenium of the corpus callosum (Figure 1). The inverse contrast (MS greater than NV) did not result in any significant region for either GM or WM.
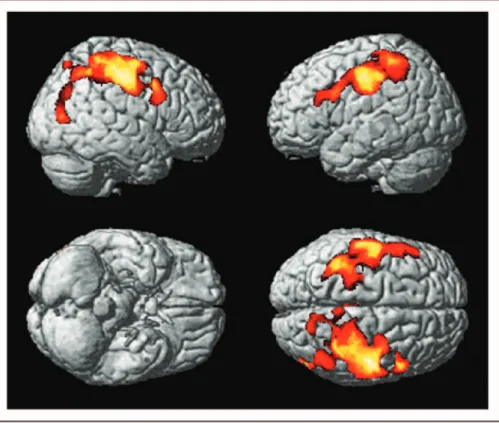
Regions of GM loss that showed a significant linear correlation with EDSS are shown in Figure 2 and sum-marized in Table 2, and include the primary motor and somatosensory areas and the middle frontal gyri bilat-erally, with extension to the middle temporal gyrus in the right hemisphere.
In Figure 3 is shown the map of the regions, indicat-ing a significant correlation between WM loss and EDSS (in green) along with the regions of GM loss correlating with EDSS (in red). Regions of WM loss correlating with EDSS are located bilaterally in the juxtacortical regions adjacent to the primary motor cortex and lower temporo-parietal regions, in the brain-stem (both pyramidal tracts and tegmentum) and in the anterior part of the corpus callosum.
Correlations between regional GM loss and lesion load (LL) are depicted in Figure 4 and summarized in Table 3. Regions of GM loss that correlate significantly with LL are distributed symmetrically in the caudate heads, the parahippocampal and cingulate gyri, motor cortex and insula.
Regions of WM loss that correlate with LL are reported in Figure 5. These include the corpus callo-sum, with more extensive involvement of the genu and splenium, the latter extending bilaterally to the juxtacortical fibres abutting the precuneus/posterior cingulate, thalamocapsular WM, and the deep tempo-ral white matter bilatetempo-rally.
Assessment of the correlations between either GM or WM loss and DD did not result in any significant cluster.
Discussion
The aim of this work was to assess the possible correla-tions between regional GM and WM loss and clinical parameters, including EDSS score (an index of disabil-ity), total LL (an index of disease severity) and DD, in a large group of patients with RR-MS.
The demonstration of global reduction in GM and WM volumes in RR-MS is in line with previous find-ings of GM and WM atrophy,22 and the preliminary assessment of regional GM volume in RR-MS, as com-pared with NV, confirmed previous findings, obtained using the same optimized VBM approach in a smaller patient group, of a preferential involvement of frontal regions.1
Additional assessment of WM volumes showed a more widespread loss, involving, besides periventricular and medial temporal WM (reflecting ventricular enlargement, which is predominant in RR-MS),23 pyramidal tracts extending from juxtacortical fibres adjacent to the sensorimotor cortex, through thalamo-capsular regions to the cerebral peduncles.
The significant loss of brain tissue in the thalamic region, with a significant correlation with LL, may actually reflect brain tissue loss in both pyramidal and Table 1. Clusters of significant grey matter loss in patients with relapsing–remitting multiple sclerosis relative to controls. For each cluster, the extension and the corresponding Brodmann areas (BA) in which local maxima are located, along with the coordinates in the Talairach space and the T level of the most significant voxel, are reported
Coordinates (mm)
Region Side BA N. voxel T x y Z
Precentral gyrus L 4/6 52739 7.50 30 32 35 26 20 13 55 12 45 Insula/claustrum R 13 3045 7.07 33 44 18 9 14 0
Caudate head L/R n/a 1267 6.85 3
7
10 17
3 2 Cingulate gyrus bilateral 24/31 10571 6.28 6
5 9 24 31 23 21 13 37
Middle frontal gyrus R 8 1298 6.13 23 18 39
Middle frontal/precentral gyrus R 9/8 4743 5.95 45 39 41 12 26 24 33 48 38 Precentral/postcentral gyrus R 6/3 1285 5.47 37 42 6 16 38 51 Inferior/superior Parietal lobule R 40/7 2027 5.36 40 36 34 41 48 47 53 47 61
Superior temporal gyrus L 9/8 367 5.05 48 52 30
thalamic regions, because with the present segmenta-tion technique most of the lateral thalamus is seg-mented as WM. Thalamic atrophy has been found in many studies of MS, and seems to be present already in the very early stages of MS, including clinical isolated syndrome (CIS).24
Give that the thalami are composed of GM nuclei interspersed among WM tracts, classification even with a multiparametric approach is challenging, and studies focusing specifically on this region, e.g. using diffusion tensor-based segmentation,25are required to disentan-gle the relative contributions of these anatomical struc-tures to local loss of brain tissue.
Previous work probing the correlations between global brain tissue volumes and indexes of disease severity have shown that global GM loss correlates weakly with EDSS in RR-MS in transversal studies,26 while a few longitudinal studies have suggested that patients who show sustained progression in disability (as measured by EDSS) present a significantly faster progression of the atrophy compared with patients with relatively stable disease.27–29In our patient popu-lation we confirmed the presence of a correpopu-lation between EDSS and global brain atrophy, as measured
by increased CSF, which was sustained by a reduction of global WM and (to a lesser extent) GM volumes.
When testing correlations of regional loss of GM with disease severity using VBM, motor areas showed a preferential correlation with EDSS bilaterally. These results confirm and extend previous observations from studies of cortical thickness, in small groups of MS patients with mixed disease course, that suggested a reduction in regional cortical thickness at the level of the motor areas in patients with higher disability scores as compared with NV,2 with a rate of GM thickness reduction that was more pronounced in the parietal and precentral cortex in patients with a more aggressive dis-ease course, compared with stable patients.5
A previous study in a smaller cohort of patients with pure RR-MS, which used the same methodology as the present study to analyse regional GM volume loss, failed to detect significant regional correlates of EDSS.1This was probably attributable to the reduced sample size and the smaller span of EDSS values (51 patients with an EDSS range of 1.5–4.5, versus 128 patients with EDSS range 1.0–6.0).
Another study that focused on correlates of regional GM loss in a large cohort of patients with pure Figure 1. Axial sections (first row, patient’s left side is on the observer’s left side), sagittal sections of the left (bottom left) and right (bottom right) hemispheres, and coronal section (bottom row, centre) from selected levels of a normal subject T1-weighted volume (in greyscale). The regions of significant white matter loss in patients with multiple sclerosis as compared with controls are overlaid in colourscale. Bilaterally, in the periventricular regions in the temporal lobes, juxtacortical insular regions, extending posteriorly through the internal capsule to the thalami, and the splenium of the corpus callosum are involved.
RR-MS, using a technique based on the assessment of cortical thickness to look for correlations with LL and disability in 425 patients, found a higher rate of thin-ning per unit increase in EDSS in the prefrontal regions bilaterally and in the anterior cingulate regions.4 The authors suggested that the poor correlation of cortical thinning of the premotor and motor areas with EDSS and LL might be due to the relatively mild impairment of their patients, with a high prevalence of patients at relatively early stages of the disease in the sample.
The present data, however, do not support this hypothesis because correlation of primary sensorimotor areas with EDSS was present and sizeable, despite the smaller EDSS range (1–6 as compared to 0–8 in the cohort published by Charil4) and smaller LL (up to 46.0 cc, compared with 78.6 cc).
Differences in the techniques used to assess atrophy (cortical thickness versus VBM) might contribute to the different results. In particular, studies of cortical thick-ness may be more sensitive to variations in GM regions Figure 2. Regions exhibiting a significant correlation between grey matter loss and Expanded Disability Status Scale (p<0.05 corrected for multiple comparisons at cluster level, i.e.tscore>3.16) in patients with relapsing–remitting multiple sclerosis are overlaid in colour on to the surface of a single subject normalized brain.
The primary motor and somatosensory areas, and the middle frontal gyri are involved bilaterally, with extension to the middle temporal gyrus in the right hemisphere.
Table 2. Clusters of significant grey matter loss that correlate with Expanded Disability Status Scale in patients with relapsing– remitting multiple sclerosis. For each cluster, the extension and the corresponding Brodmann areas (BA) in which local maxima are located, along with the coordinates in the Talairach space and the T level of the most significant voxel, are reported
Coordinates (mm)
Region Side N. voxel T x y Z
Precentral gyrus/postcentral gyrus R 41162 4.83 37 26
32
24
53 52
Frontal lobe – paracentral lobule R 13 37 44
Precentral gyrus/postcentral gyrus L 18416 4.73 53
44
15
15
34 40
with stronger morphological variability, such as the frontal cortex,30,31 while more stable regions of the brain may be better explored using VBM. However, to the best of our knowledge, comparative studies using both techniques are not currently available, and further work is needed to assess differences between these two techniques.
Additionally, criteria for patient selection may have played a role in determining different results; for exam-ple, current use of disease modifying therapy (DMT) was not an exclusion criterion in the present study, while previous use of immunosuppressors or experi-mental immunomodulatory therapies was not an exclu-sion criterion in the aforementioned paper.
Regarding correlation of GM loss and LL, the cur-rent results extend the previous findings of a correlation between GM loss and LL at the level of both caudate heads, showing areas of significant correlation also in the cingulate gyri, sensorimotor regions and temporal lobes, including the insulae.1
Interestingly, deep GM atrophy has been related to global LL also in primary and secondary progressive forms of the disease, as opposed to regional cortical atrophy which has been related in the same forms to corresponding lobar lesion loads.6
In that same study, however, Ceccarelli et al.6 demonstrated in RR-MS a correlation of thalamic atro-phy with LL, which, owing to the differences in the
segmentation techniques, may be reflected partly by the significant clusters that were detected in the present study in the thalamo-capsular regions in the VBM ana-lysis of the WM. Also, differences in data acquisition may contribute to different sensitivities. For the present work we used segmented two-dimensional sequences, which in principle may limit the accuracy of the method as compared to the use of three-dimensional sequences with isotropic resolution. However, it should be considered that the preprocessing for VBM involves a smoothing three times larger than the slice thickness (12 mm FWHM), thus making the use of 4 mm sections unlikely to affect the results of VBM.
The use of VBM to assess regional loss of WM allowed demonstration of a significant correlation with EDSS in the WM, which stemmed from the motor areas bilaterally and followed the pyramidal tracts down to the brainstem, thus supporting the hypothesis that motor neurons are more severely damaged as disability progresses.
In RR-MS, a correlation between motor disability and spinal cord atrophy has been previously demon-strated,32 which may be in turn related also to atrophy of the pyramidal tracts. However, further work is needed to explore this possible mechanism, and to assess possi-ble specific clinical correlates of pyramidal tract atrophy. It is of note that DD showed a weaker correlation with global atrophy, compared with LL and EDSS, Figure 3. Regions of white matter loss (in green) that correlate with Expanded Disability Status Scale in patients with relapsing– remitting multiple sclerosis together with regions of grey matter loss (in red) for comparison (p<0.05 corrected for multiple comparisons at cluster level, i.e.tscore>3.16). White matter loss is located bilaterally in the juxtacortical regions adjacent to the primary motor cortex and lower temporo-parietal regions, in the brainstem (both pyramidal tracts and tegmentum), and in the anterior part of the corpus callosum.
without any regional specificity in the VBM analysis. This may be due to both the difficulty in defining the time of disease onset based on the anamnesis, as well as the intrinsic inter- and intra-subject variability of dis-ease progression in RR-MS.
A limit of our study lies in the heterogeneity of the patient group in terms of clinical variables, which facili-tated the detection of potential correlates of EDSS and DD, but in turn limited the current approach to the study of the common patterns of brain tissue involvement across a heterogeneous population, while correlations that may be present only in MS subgroups (e.g. early MS, benign MS) may have remained undetected.
Furthermore, the presence of atrophy in the early phases of the disease, including CIS,24 may limit the
sensitivity of correlation analysis. The correction for age, here included both as a first step in the multiple regression analysis of global tissue volumes, and as a nuisance covariate in the VBM analysis, to allow for the strong correlation of brain tissue volumes with age,15 may have hindered detection of an effect of DD on atrophy within the constraints of the general linear model generalized linear model.
Conclusions
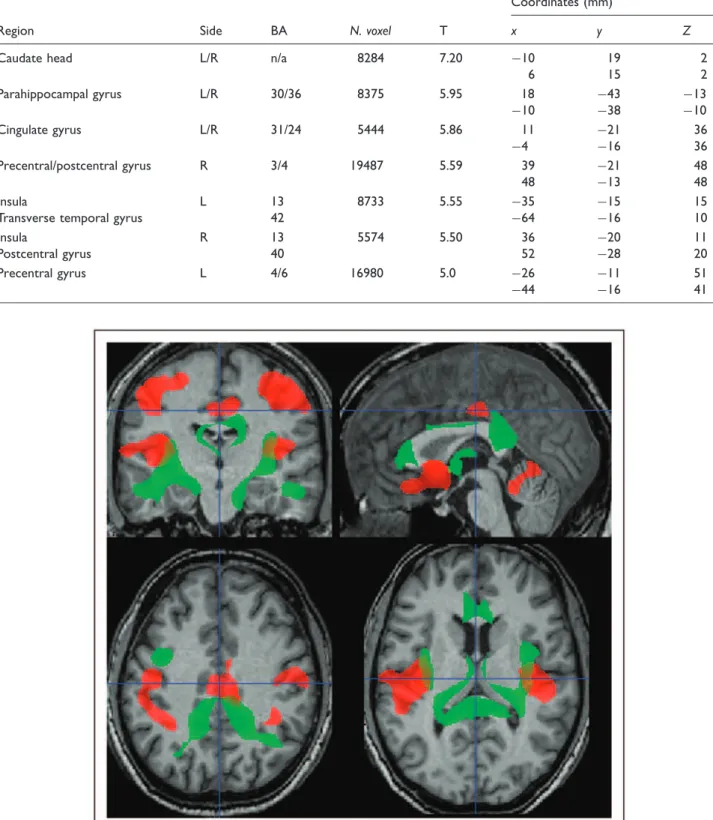
In RR-MS, we have confirmed a direct correlation between disease severity and brain tissue loss (both GM and WM) in the motor system, while LL correlates of brain tissue loss mainly affect highly interconnected Figure 4. Regions of significant correlation between grey matter loss and lesion load (p<0.05 corrected for multiple comparisons at cluster level, i.e.tscore>3.16) in patients with relapsing–remitting multiple sclerosis are overlaid in colour on to the sections of a normal subject T1-w images and are symmetrically distributed in the caudate heads, the parahippocampal and cingulate gyri, motor cortex and insula.
Figure 5. Regions of white matter loss (in green) that correlate with lesion load in patients with relapsing–remitting multiple sclerosis together with regions of grey matter loss (in red) for comparison (p<0.05 corrected for multiple comparisons at cluster level, i.e.tscore
>3.16). They include the corpus callosum, with more extensive involvement of the genu and splenium, the latter extending bilaterally to the juxtacortical fibres abutting the precuneus/posterior cingulate, thalamocapsular white matter, and the deep temporal white matter bilaterally.
Table 3. Grey matter clusters exhibiting a significant negative correlation with lesion load in patients with relapsing–remitting multiple sclerosis. For each cluster, the extension and the corresponding Brodmann areas (BA) in which local maxima are located, along with the coordinates in the Talairach space and the T level of the most significant voxel, are reported
Coordinates (mm)
Region Side BA N. voxel T x y Z
Caudate head L/R n/a 8284 7.20 10
6 19 15 2 2 Parahippocampal gyrus L/R 30/36 8375 5.95 18 10 43 38 13 10 Cingulate gyrus L/R 31/24 5444 5.86 11 4 21 16 36 36 Precentral/postcentral gyrus R 3/4 19487 5.59 39 48 21 13 48 48 Insula
Transverse temporal gyrus
L 13 42 8733 5.55 35 64 15 16 15 10 Insula Postcentral gyrus R 13 40 5574 5.50 36 52 20 28 11 20 Precentral gyrus L 4/6 16980 5.0 26 44 11 16 51 41
subcortical structures, including the caudate nuclei and thalami.
Acknowledgement
This study was funded in part by the EC – FP6-project DiMI, LSHB-CT-2005-512146.
References
1. Prinster A, Quarantelli M, Orefice G, et al. Grey matter loss in relapsing–remitting multiple sclerosis: a voxel-based morphometry study.Neuroimage2006; 29: 859–867. 2. Sailer M, Fischl B, Salat D, et al. Focal thinning of the
cere-bral cortex in multiple sclerosis.Brain2003; 126: 1734–1744. 3. Audoin B, Davies GR, Finisku L, Chard DT, Thompson AJ, Miller DH. Localization of grey matter atrophy in early RRMS: A longitudinal study.J Neurol 2006; 253: 1495–1501.
4. Charil A, Dagher A, Lerch JP, Zijdenbos AP, Worsley KJ, Evans AC. Focal cortical atrophy in multiple sclero-sis: relation to lesion load and disability. Neuroimage
2007; 34: 509–517.
5. Chen JT, Narayanan S, Collins DL, Smith SM, Matthews PM, Arnold DL. Relating neocortical pathol-ogy to disability progression in multiple sclerosis using MRI.Neuroimage2004; 23: 1168–1175.
6. Ceccarelli A, Rocca MA, Pagani E, et al. A voxel-based morphometry study of grey matter loss in MS patients with different clinical phenotypes. Neuroimage2008; 42: 315–322.
7. Bendfeldt K, Kuster P, Traud S, et al. Association of regio-nal gray matter volume loss and progression of white matter lesions in multiple sclerosis – A longitudinal voxel-based morphometry study.Neuroimage 2009; 45: 60–67. 8. Chard DT, Griffin CM, Parker GJ, Kapoor R, Thompson
AJ, Miller DH. Brain atrophy in clinically early relapsing– remitting multiple sclerosis.Brain2002; 125: 327–337. 9. Ge Y, Grossman RI, Udupa JK, Babb JS, Nyul LG,
Kolson DL. Brain atrophy in relapsing–remitting multi-ple sclerosis: fractional volumetric analysis of gray matter and white matter.Radiology2001; 220: 606–610. 10. Ashburner J, Friston KJ. Voxel-based morphometry –
the methods.Neuroimage2000; 11: 805–821.
11. Poser CM, Paty DW, Scheinberg L, et al. New diagnostic criteria for multiple sclerosis: guidelines for research pro-tocols.Ann Neurol1983; 13: 227–231.
12. Lublin FD, Reingold SC. Defining the clinical course of multiple sclerosis: results of an international survey. National Multiple Sclerosis Society (USA) Advisory Committee on Clinical Trials of New Agents in Multiple Sclerosis.Neurology1996; 46: 907–911. 13. Kurtzke JF. Rating neurologic impairment in multiple
sclerosis: an expanded disability status scale (EDSS).
Neurology1983; 33: 1444–1452.
14. Alfano B, Brunetti A, Larobina M, et al. Automated seg-mentation and measurement of global white matter lesion volume in patients with multiple sclerosis.J Magn Reson Imaging2000; 12: 799–807.
15. Good CD, Johnsrude IS, Ashburner J, Henson RN, Friston KJ, Frackowiak RS. A voxel-based
morphometric study of ageing in 465 normal adult human brains.Neuroimage2001; 14: 21–36.
16. Friston KJ, Holmes AP, Poline JB, et al. Analysis of fMRI time-series revisited.Neuroimage1995; 2: 45–53. 17. Ashburner J, Neelin P, Collins DL, Evans A, Friston K.
Incorporating prior knowledge into image registration.
Neuroimage1997; 6: 344–352.
18. Woods RP, Grafton ST, Watson JD, Sicotte NL, Mazziotta JC. Automated image registration: II. Intersubject validation of linear and nonlinear models.
J Comput Assist Tomogr1998; 22: 153–165.
19. Ashburner J, Friston KJ. Nonlinear spatial normalization using basis functions.Hum Brain Mapp1999; 7: 254–266. 20. Genovese CR, Lazar NA, Nichols T. Thresholding of statistical maps in functional neuroimaging using the false discovery rate.Neuroimage2002; 15: 870–878. 21. Talairach J and Tournoux P.Co-planar stereotaxic atlas
of the human brain. 3-dimensional proportional system: an approach to cerebral imaging.Thieme, 1988. New York. 22. Bermel RA, Bakshi R. The measurement and clinical
relevance of brain atrophy in multiple sclerosis. Lancet Neurol2006; 5: 158–170.
23. Pagani E, Rocca MA, Gallo A, et al. Regional brain atrophy evolves differently in patients with multiple scle-rosis according to clinical phenotype. Am J Neuroradiol
2005; 26: 341–346.
24. Henry RG, Shieh M, Okuda DT, Evangelista A, Gorno-Tempini ML, Pelletier D. Regional grey matter atrophy in clinically isolated syndromes at presentation.J Neurol Neurosurg Psychiatry2008; 79: 1236–1244.
25. Wiegell MR, Tuch DS, Larsson HB, Wedeen VJ. Automatic segmentation of thalamic nuclei from diffusion tensor mag-netic resonance imaging.Neuroimage2003; 19: 391–401. 26. De Stefano N, Matthews PM, Filippi M, et al. Evidence
of early cortical atrophy in MS: relevance to white matter changes and disability.Neurology2003; 60: 1157–1162. 27. Gasperini C, Paolillo A, Giugni E, et al. MRI brain
volume changes in relapsing–remitting multiple sclerosis patients treated with interferon beta-1a.Mult Scler2002; 8: 119–123.
28. Rudick RA, Fisher E, Lee JC, Duda JT, Simon J. Brain atrophy in relapsing multiple sclerosis: relationship to relapses, EDSS, and treatment with interferon beta-1a.
Mult Scler2000; 6: 365–372.
29. Zivadinov R, Sepcic J, Nasuelli D, et al. A longitudinal study of brain atrophy and cognitive disturbances in the early phase of relapsing–remitting multiple sclerosis.
J Neurol Neurosurg Psychiatry2001; 70: 773–780. 30. Tomaiuolo F, MacDonald JD, Caramanos Z, et al.
Morphology, morphometry and probability mapping of the pars opercularis of the inferior frontal gyrus: an in vivo MRI analysis.Eur J Neurosci1999; 11: 3033–3046. 31. Chiavaras MM, LeGoualher G, Evans A, Petrides M. Three-dimensional probabilistic atlas of the human orbi-tofrontal sulci in standardized stereotaxic space.
Neuroimage2001; 13: 479–496.
32. Rashid W, Davies GR, Chard DT, et al. Increasing cord atrophy in early relapsing–remitting multiple sclerosis: a 3 year study.J Neurol Neurosurg Psychiatry2006; 77: 51–55.