October 2019
Effects of Stormwater Green Infrastructure on
Watershed Outflow: Does Spatial Distribution
Matter?
Benjamin Fahy
Portland State UniversityHeejun Chang
Portland State University, [email protected]
Follow this and additional works at:
https://dc.uwm.edu/ijger
Part of the
Earth Sciences Commons
,
Environmental Sciences Commons
, and the
Geography
Commons
This Research Article is brought to you for free and open access by UWM Digital Commons. It has been accepted for inclusion in International Journal of Geospatial and Environmental Research by an authorized administrator of UWM Digital Commons. For more information, please contact [email protected].
Recommended Citation
Fahy, Benjamin and Chang, Heejun (2019) "Effects of Stormwater Green Infrastructure on Watershed Outflow: Does Spatial Distribution Matter?,"International Journal of Geospatial and Environmental Research: Vol. 6 : No. 1 , Article 5.
Abstract
Green Stormwater Infrastructure (GSI) has become a popular method in urban stormwater management. We examined how spatial distribution of GSI affected rainfall-runoff relationships in a recently developed neighborhood in Gresham, Oregon, USA for the 2017-2018 water year. Runoff ratio, peak discharge, and flashiness were compared under four precipitation scenarios (of differing intensity and duration) and different spatial arrangements of GSI. Distributed GSI reduced runoff ratio (10 - 20%), peak discharge (26 - 68%), and flashiness index (56 - 70%). Distributed GSI outperformed centralized structures for all metrics, reducing runoff ratio (22 - 32%), peak discharge 67 to 69%, and flashiness index (32 - 62%). This research serves as a basis for urban stormwater managers to understand potential impact of GSI on reducing runoff and downstream flooding in small urban watersheds with frequent rain.
Keywords
Hydrology, green infrastructure, urban, storm, sustainability
Acknowledgements
Special thank Katie Holzer at the City of Gresham who provided necessary data and resources as well as reviewing an earlier version of the manuscript. We also appreciate an anonymous reviewer whose comments helped clarify some points of the manuscript. This research was supported by the Urban Resilience to the Extremes Sustainability Research Network under National Science Foundation grant AGS‐1444755. Additional support was provided by PSU’s Institute for Sustainable Solutions. Views expressed are our own and do not necessarily reflect the views of the sponsoring agencies.
Green Stormwater Infrastructure (GSI) refers to all systems that attempt to promote infiltration and detention of runoff by integrating natural porous surfaces or artificial structure (e.g., cistern) into residential or urban landscapes (Golden and Hoghooghi 2017; Palmer et al. 2015). GSI has grown in popularity in recent years among urban managers and practitioners as it not only reduces flooding and pollution risk but also is an efficient alternative to traditional structural methods. GSI also offers positive social and ecological benefits such as improving real estate value, reducing crime rate, and mitigating the urban heat island effect (Wang et al. 2016; García-Cuerva et al. 2018; Baker et al. 2019). Furthermore, previous studies have predicted that some of the risks GSI is designed to mitigate (flooding and urban heat) may in fact worsen for cities in which a warming global atmosphere would lead to greater precipitation and temperature. At the very least, GSI can promote urban resilience in cities where precipitation intensity is projected to increase in the future (Rosenzweig et al. 2018), bringing more surface flooding (Matthews et al. 2015; Demuzere et al. 2014; Hirabayashi et al. 2013; Gill et al. 2007; Ashley et al. 2005).
Although the potential and observed benefits of GSI have been well researched, the optimal location of such infrastructure is still largely unknown (Ahiablame et al. 2012). In the past, GSI has been evaluated either at a regional scale (e.g. city, metropolitan area), or structural scale (individual structures), leaving a need for sub-catchment scale analyses (Avellaneda et al. 2017; Golden and Hoghooghi 2017; Bell et al. 2016). Localized studies can provide key information about the functionality of individual structures and are useful in designing blueprints for implementation. Much of this research compares inflow and outflow metrics for water quality and quantity of individual structures, and any measured changes is attributed solely to the structures (Jarden et al. 2016; Burns et al. 2012; Fassman & Blackbourn 2010; Hunt & Szpir 2006). Because many of the aforementioned studies evaluate structures independently, there still exists a need to identify cumulative impacts of combined infrastructure and the effects of different spatial configurations (i.e. proximity to impervious surfaces, to flow accumulation, to other GSI) (Bhaskar et al. 2016; Loperfido et al. 2014; Gilroy & McCuen 2009).
Conversely, broader scale comparisons can reduce errors based on spatial and temporal heterogeneity of individual structures, such as soil saturation, antecedent rain conditions and temperature (Thomas et al. 2016). However, these analyses typically assume spatial homogenization in otherwise heterogeneous parameters and are therefore more likely to identify external influential factors (Burns et al. 2012; Wainwright et al. 2011). Baker et al. (2004) found watershed area and flow path length far outweighed GSI variation when evaluating catchment flashiness, while Bell et al. (2016) reported only total imperviousness had a significant influence on watershed outflow. Factors that influence runoff can eclipse GSI when not controlled across comparison groups. Loperfido et al. (2014) measured GSI performance by controlling for landscape factors but found considerable variation in distribution, connectivity, and density of GSI. Using broad scale watersheds makes it difficult to discern factors (watershed size, impervious surface cover) that influence hydrology, even when attempting to control for them in the comparison (Pennino et al. 2016). In sum, large scale analyses allow for identification of statistical correlations between GSI and runoff but can be preventative in establishing well controlled comparisons (Zellner et al. 2016).
To solve these problems, we focus on subcatchments, which function as hydrologically independent areas with topological characteristics that carry surface flow to a common point that is not necessarily an inlet to a lake or ocean (Martz & Garbrecht 1992). Because discharge dynamics represent drainage basins, it is necessary to delineate boundaries that exclude the possibility of water exchange outside of a study site--something that is rarely achieved in local studies. Conversely, it is also necessary to isolate GSI in comparisons by controlling for all other variables that influence flow, which can be difficult when regional comparisons are too large to provide accurate accounts of differences in catchments. As shown in Table 1, many of the limitations in local and regional scales are absent for sub-catchment scale studies. The table shows how local scales (<0.01 km2) may overlook cumulative and interactional effects of GSI, and broad scales (>1 km2) may be subject to uncontrolled variables. We identify a general gap in existing literature and propose to investigate GSI at a controlled sub-catchment scale.
To fully understand the relative efficacy of varying spatial arrangements of GSI under changing climatic conditions, multiple climate scenarios should be tested to ensure how runoff characteristics will shift under differing precipitation conditions. Many previous studies on GSI measure flow in a single location over long term periods of precipitation (Jarden et al. 2016, Thomas et al.2016), or by comparing areas with different precipitation patterns (Kim & Park 2016; Noreen 2015; Miles & Band 2015). To test GSI performance under different climate scenarios, comparison groups should be evaluated for different types of rain events. Optimizing GSI in future projects requires understanding the most effective distribution of structures (Moore et al. 2016, Lim et al. 2016). While many studies discuss the overall impacts of GSI or compare types of GSI, there still exists a need to evaluate different arrangements (Bell et al. 2016; Lim and Welty 2016; Golden and Hoghooghi 2016). Distributed structures have recently been discovered to function more effectively than centralized. The literature has evidenced that there are optimal scales and arrangements for GSI, but a limited number of studies have directly addressed this question (Jayasooriya and Ng 2014). We seek to answer the following research questions.
(1) How effective is a combined GSI approach at reducing pluvial nuisance flooding in a climate that receives frequent rainfall?
(2) How does a distributed GSI arrangement compare to a centralized arrangement? (3) How does intensity and duration of precipitation impact GSI functionality?
2
MATERIALS AND METHODS
2.1 Study Area
As shown in Figure 1, the Brookside neighborhood is located in Portland’s neighbor, Gresham, Oregon, USA. The area received approximately 917mm of annual precipitation (based on station located at Portland International Airport) with the majority of it (73%) falling in the wet season from October to March (Western Regional Climate Center 2019). This neighborhood has clay soils (~0.25-1.27 cm/hr of infiltration) and steep slopes (up to 12%), a condition typically not favorable for installing GSI. The area is undergoing rapid development projects that will increase impervious surface f r o m l e s s t h a n 3 % t o o v e r 4 5 % i n l e s s t h a n a d e c a d e ( C i t y o f
Table 1. Location, study site median area, GSI type, and limitations of spatial scales for selected studies. Additional information in Hammel et al. (2013).
Case Study Location Scale (km2) GSI Type Limitations due to spatial scale
Hunt & Szpir (2006) North Carolina 0.000001 Bio-retention cells No combined functionality of GSI Gregoire & Clausen (2011) Connecticut 0.0002 Green roofs (GRs) Only green roofs examined
Burns et al. (2012) Melbourne, AU 0.0005 Lined bio-infiltration system No outcome of “flow-through” water
Fassman & Blackbourn (2010) Auckland, NZ 0.00062 Permeable streets No recorded catchment outflow, only structural
Jarden et al. (2016) Ohio 0.001 Green streets Street repairs offset impact
Davis (2008) Maryland 0.0024 Bio-retention facilities No combined effects of outflow at catchment scale Zimmerman et al. (2010) Massachusetts 0.01 Pavement, GRs, rain gardens Small sample size
Wang et al. (2010) Ohio 0.03 Building specific LID Calibrated model only to pre-development period
Bedan & Clausen (2009) Connecticut 0.031 Bio-retention, grassed swales None
Lim & Welty (2017) Washington D.C. 0.05 Distributed residential GSI No model Calibration Selbig & Bannerman (2008) Wisconsin 0.66 Infiltration basin, swales, pond None
Miles & Band (2015) N. Carolina, D.C. 1.5 Rain gardens, detention basins Sites differ (soil, vegetation, precipitation) Loperfido et al. (2014) Chesapeake Bay 4 Distributed & centralized GSI No controlled variables between locations Zellner et al. (2016) Illinois 4 Bioswales, green roofs, etc Only compare models, no empirical calibration Pennino et al. (2016) Maryland, D.C 6 Rain gardens, ponds, swales, Only normalize for watershed size & impervious
Granados-Olivas et al. (2016) New Mexico 11.65 N/A Only suitability, not a performance evaluation
Bell et al. (2016) North Carolina 15 Bio-retention cells Unclear connection between GSI and pipeshed Thomas et al. (2016) Iowa 45 Stormwater detention basins Many unidentified variables. No model calibration
Lim, (2016) Eastern USA 85 Combined sewer, all GSI Only measured presence of GSI, not functionality
Kim & Park (2016) Texas 253 N/A Sites differ greatly (not a controlled comparison)
Gresham 2017). In response, the City has worked with developers to incorporate GSI projects with the development to reduce and treat runoff into a nearby creek as a means to meet legislative requirements, reduce flooding further downstream, and to protect and enhance the water quality and habitat in the creek.
Figure 1. Study area Brookside neighborhood in the Portland metropolitan area (Google Streetview, 2018).
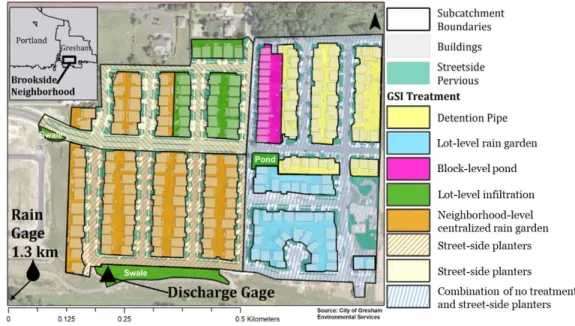
Based on lidar-derived topography and detailed sewer network, the Brookside neighborhood functions as a hydrologically independent watershed, with runoff generated by either building roofs, driveways, streets, or sidewalks. Runoff from roofs flows either to lot level GSI, centralized GSI, or streets, whereas runoff from driveways and streets flows to the street, overland along the street, and eventually through street side GSI or manholes that connect to a centralized pipeshed. Brookside is composed of similar size and density of housing and infrastructure designs throughout, but with sub-neighborhoods that differ in type, arrangement and density of GSI. As shown in Figure 2, subcatchments consist of five residential GSI and three street GSI treatment types containing varying combinations of distributed and centralized structures. The outflow from Brookside is monitored by a flow height and velocity data loggers, providing a historical record of discharge.
2.2 Observed Data Collection and Processing
We used the empirical outflow data measured by using Greyline Stingray 2.0 units and provided by the City of Gresham Department of Environmental Services. To ensure consistency, data were selected to consist of the maximum number of storms during a period without construction or alterations in the Brookside neighborhood and stormwater infrastructure design. More recent periods from June 1, 2017 to May 1, 2018 were prioritized as they best represent completed neighborhoods elsewhere. Precipitation data were obtained from the Pleasant Valley School Rain Gage in Gresham (via Portland Hydra Rainfall Network 2018).
Brookside
neighborhood
Portland
Gresham
5km
0
Figure 2. Study site area displaying boundaries, GSI treatment types, and gage locations.
To avoid errors, we removed storms with two-minute interval discharge readings greater than quadruple the neighboring values. These values were likely results from errors with the data loggers, perhaps from objects such as sticks causing the flow height gauge to misread water depth. Hourly precipitation data from the rain gage previously mentioned in Figure 2 was matched with outflow data and was considered accurate for the study site as the rain gage is less than one kilometer away. Because rainfall precedes discharge, rainfall data for 24 hours preceding the date and time of the first non-zero runoff value was included.
2.3 Preparing SWMM
The first step in building a model to use for sensitivity testing and calibration was to determine all necessary fixed input parameters to model the neighborhood. Site boundaries and flow paths (both surface and pipeshed) were determined using Digital Elevation Models (DEMs) at a one-meter resolution from the City of Gresham and the Hydrology tool set in the Environmental Systems Research Institute’s ArcGIS software. DEMs were processed to produce slope and gradient inputs which are used by SWMM to determine overland and pipe flow dynamics. Buildings, roads, pipes, and GSI structures were delineated using blueprints and high-resolution aerial photographs provided by the City of Gresham and Google Earth, 2017. From this, the percentage of impervious surfaces, flow path widths, landscape slopes, and other input parameters were calculated. Flow paths and GSI and building dimensions were ground-truthed to reduce measurement errors as much as possible. Because SWMM allows multiple options for routing flow, subcatchment design, processing infiltration, and incorporating infrastructure, various theoretical designs and parameters were compared to identify a model with the least amount of error. In the case of Brookside, the most accurate model routed flow from residential catchments with lot-level GSI treatment bioswales and detention ponds catchments to outfall nodes.
2.4 Sensitivity Analysis
Prior to calibration, a sensitivity analysis was ran to understand which parameters were dominating the outputs of the model. To identify such parameters, preliminary testing and the review of two past SWMM sensitivity analyses (Tsai et al. 2017; Tsihrintzis et al.1998) yielded a list of fourteen parameters and methods that significantly impacted model performance. The order of most to least sensitive parameters are subarea routing, GSI outflow routing, monthly evaporation constant, width of overland flow, evaporation method, impervious depression storage, Manning’s N (impervious), % zero imperviousness, pervious depression storage, Manning’s N (pervious), infiltration routing method, conductivity constant, suction head, and initial moisture deficit. Parameters were then altered independently of one another against the original base model designed with fixed (empirically measured) input parameters and suggested variable parameters from the SWMM user manual. The sensitivity analysis identified which parameters had the greatest impact on model performance and were refined in order of decreasing impact to the model during the calibration phase.
2.5 Calibration and Validation
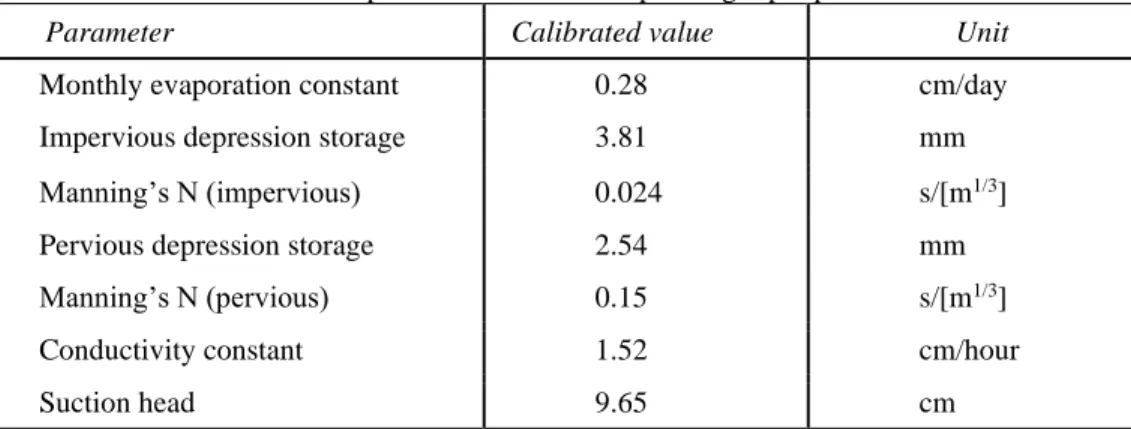
Although SWMM offers an automated calibration process, this process requires individual subcatchment runoff values, and cannot be used for a system of multiple subcatchments as used in this study. For that reason, a manual calibration process was used to improve model performance by manually adjusting one variable input parameter at a time. In each step during calibration, we adjusted one parameter at a time, mostly in decreasing order of the most sensitive parameters via the sensitivity analysis. Table 2 summarizes the results of calibrated parameter values.
Table 2. Calibration results for optimized for the corresponding input parameter.
Parameter Calibrated value Unit
Monthly evaporation constant 0.28 cm/day
Impervious depression storage 3.81 mm
Manning’s N (impervious) 0.024 s/[m1/3]
Pervious depression storage 2.54 mm
Manning’s N (pervious) 0.15 s/[m1/3]
Conductivity constant 1.52 cm/hour
Suction head 9.65 cm
The model’s outflow hydrograph for the selected water year was first used to compute a Nash-Sutcliffe Equilibrium (NSE) statistic, a metric for optimizing the model for each given input parameter (Nash and Sutcliffe, 1970). NSE ranges between −∞ and 1, with values between 0 and 1 being acceptable, and higher values signaling stronger performance (Moriasi et al. 2007). Once the model was calibrated to optimize NSE, the Percent Bias (PBIAS) statistic was used for verification and was only tested for the final model (and the base model for comparison). Unlike NSE, PBIAS measures the tendency of the model output to differ from the empirical data. The optimal value of PBIAS is 0, with low-magnitude (absolute value) measurements indicating accuracy (Gupta et al.
as well as alternate arrangement strategies.
2.6 Runoff Metrics
2.6.1 Runoff Ratio
Runoff ratio is similar to total discharge in that it is a measure of the total quantity of precipitation that fails to infiltrate, evaporate, or increase storage during a storm event. Using a ratio adjusts for small alterations to landscapes in different scenarios that may change the total volume of precipitation entering the system. Downstream flooding can reduced and prevent large quantities of discharge from entering waterways. Understanding how much water GSI can potentially detain from a riverine system during a flood event can inform the knowledge towards the ability for GSI to mitigate flooding (Johnson Creek Watershed Council, 2005).
2.6.2 Peak Discharge
Peak discharge is the maximum of the instantaneous peak flow (cubic meters per second) in the hydrographs of simulation events, as shown in the equation below. Peak flow can lead to combined sewer overflow (CSO) and both flooding and water quality problems, peak discharge will be compared across GSI arrangements to understand different CSO mitigation potentials (Department of Ecology, 2015).
2.6.3 Flashiness Index
The shape of hydrograph will serve as a basis to compare flashiness; because flashy hydrographs depict sharp vertical jumps and steep vertical declines, the slope of the maximum tangent line along the first rising limb was computed and used for comparison. Development and impervious surfaces can exacerbate flashiness and increase the rate at which water enters pipes, water treatment facilities, and stream networks, thus leading to higher discharge downstream (Baker et al. 2004).
2.7 Scenario Analysis
To identify the most effective arrangements of GSI and under which conditions they are most effective, we use a synthetic scenario analysis to perform two tests: first, to quantify the impact of GSI in the Brookside neighborhood against an absence of GSI; and second, to compare performance of dispersed vs. centralized GSI. In the first analysis, the Brookside arrangement is represented by the calibrated model. The No GSI model is designed exactly as Brookside with all GSI (both centralized and dispersed structures) removed. For the second test, two synthetic neighborhoods were designed to compare the performance of completely dispersed and completely centralized GSI designs. For the centralized scenario, dispersed GSI was removed, and new centralized structures (bioswales, detention pipes, and detention ponds) were applied to regions previously treated by dispersed structures. Conversely, for the dispersed arrangement, all centralized facilities were removed and replaced by dispersed structures in order to mimic treatment in the dispersed GSI regions.
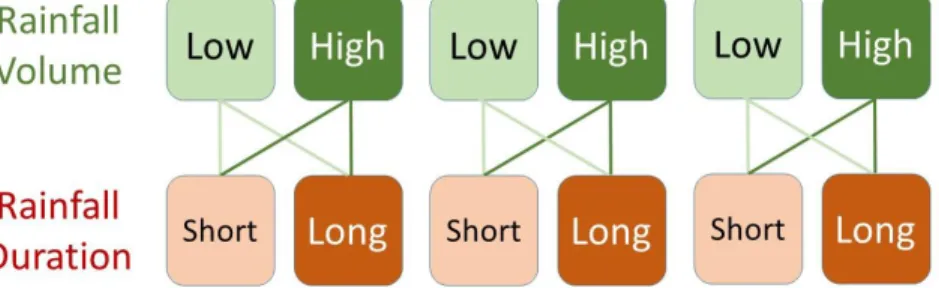
All tests evaluated four synthetic precipitation events including two levels of both precipitation volume and duration to measure the directional relationship of storm type and performance of the GSI arrangement in question (Table 3). Precipitation values were based on historical rainfall data from Portland HYDRA Rainfall Network, and validated with precipitation Intensity-Duration-Frequency (IDF) curve values from the 2007 Portland Bureau of Environmental Services’ Sewer Drainage Facilities Design Manual and the 2013 Stormwater Management Facilities Monitoring Report. The former defines a 2-year 24-hour storm event with 0.254 cm/hr average precipitation, and the later references design storms ranging from 0.087 cm/hr to 0.800 cm/hr with peak intensity starting at 0.432 cm/hr for 24 hour events, thereby validating the selected scenario storms used in this analysis. Holding precipitation volume constant to 1.83 and 3.66 cm, storm durations of 16 and 32 hours were tested.
Table 3. Characterization of four storm types used in scenario analyses.
By testing four storm types for four metrics for two arrangements, both scenario analyses consisted of sixteen simulations (Figure 3). Differences between arrangements were calculated as percent change from one arrangement to the other (from no GSI to Brookside GSI and from centralized GSI to dispersed GSI) to quantify the extent to which one arrangement outperformed the other for each metric.
Figure 3. Conceptual Diagram illustrating scenario analysis categories.
Storm Type Total
Precipitation (cm) Total Duration (hours) Average Precipitation (cm/hour) Max Precipitation (cm/hour)
Low volume, short duration 1.83 6 0.114 0.203
Low volume, long duration 1.83 32 0.057 0.102
High volume, short duration 3.66 16 0.229 0.406
3.1 Model Calibration
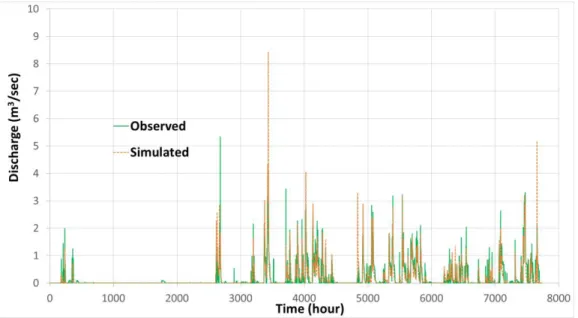
The final calibrated SWMM model had an NSE coefficient of 0.76 and the PBIAS of 3.3% at an hourly scale (see Figure 4). These numbers are well within the accepted range of values in other previous studies.
Figure 4. Hydrograph showing model iterations attempting to simulate observed outflow.
3.2 Presence and Absence of GSI
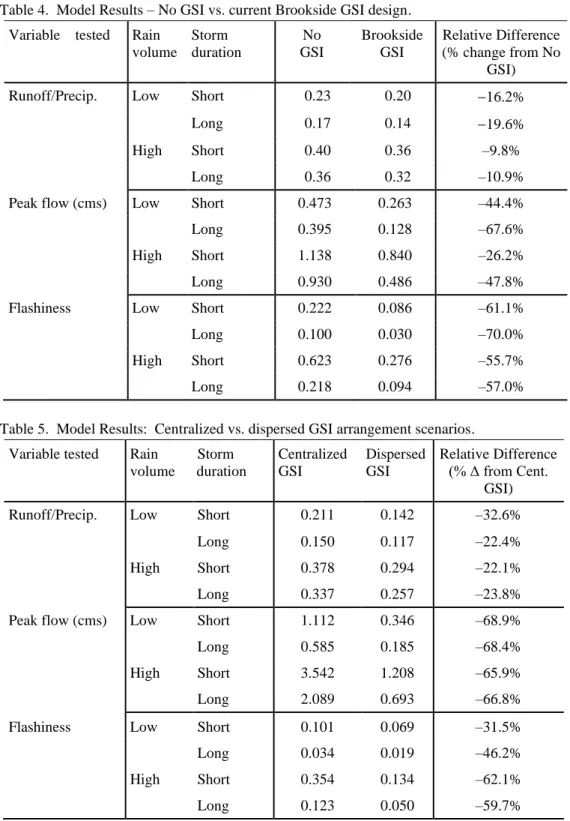
Table 4 summaries the impact of GSI in Brookside by testing the modeled neighborhood with the current GSI arrangement against that with no GSI for four hydrologic metrics, for four different storm types per metric. For runoff ratio, GSI in Brookside decreases runoff between roughly 10 and 20%, with the most significant impacts occurring in low volume storms, and for longer duration events. For peak flow, all storms illustrate that GSI in Brookside reduces peak discharge rates, with reductions ranging from roughly 26 to 68% and the greatest reductions occurring in smaller and longer, or more spread out storms. Lastly, Brookside GSI reduced flashiness for all storms, ranging from 56% to 70%, with the largest reductions occurring in smaller and longer duration events.
3.3 Spatial Distribution of GSI
The second scenario analysis, comparing synthetic designs of distributed with centralized GSI arrangements, shows similar trends to that of the No GSI vs. Brookside GSI comparison, except for lag time. As shown in Table 5, all scenarios illustrated that dispersed GSI decreases runoff ratio, ranging from 22 to 33%, with the largest reduction occurring in the low volume, short duration event. For peak flow, all storms showed a consistent trend of a reduction in flow between 67 and 69%. Lastly, dispersed was found to reduce flashiness for all storms with the greatest relative reductions occurring in high
volume storms (between 60 and 62% decrease) compared to low volume events (32 to 46% reductions).
Table 4. Model Results – No GSI vs. current Brookside GSI design. Variable tested Rain
volume Storm duration No GSI Brookside GSI Relative Difference (% change from No GSI)
Runoff/Precip. Low Short 0.23 0.20 −16.2%
Long 0.17 0.14 −19.6%
High Short 0.40 0.36 –9.8%
Long 0.36 0.32 –10.9%
Peak flow (cms) Low Short 0.473 0.263 –44.4%
Long 0.395 0.128 –67.6%
High Short 1.138 0.840 –26.2%
Long 0.930 0.486 –47.8%
Flashiness Low Short 0.222 0.086 –61.1%
Long 0.100 0.030 –70.0%
High Short 0.623 0.276 –55.7%
Long 0.218 0.094 –57.0%
Table 5. Model Results: Centralized vs. dispersed GSI arrangement scenarios. Variable tested Rain
volume Storm duration Centralized GSI Dispersed GSI Relative Difference (% Δ from Cent. GSI)
Runoff/Precip. Low Short 0.211 0.142 –32.6%
Long 0.150 0.117 –22.4%
High Short 0.378 0.294 –22.1%
Long 0.337 0.257 –23.8%
Peak flow (cms) Low Short 1.112 0.346 –68.9%
Long 0.585 0.185 –68.4%
High Short 3.542 1.208 –65.9%
Long 2.089 0.693 –66.8%
Flashiness Low Short 0.101 0.069 –31.5%
Long 0.034 0.019 –46.2%
High Short 0.354 0.134 –62.1%
The results of the first scenario analysis quantifies how the configuration of GSI in the Brookside neighborhood performed for three different metrics under four different types of precipitation events. In general, Brookside GSI appears to reduce flooding risk for all storms, with the greatest impact occurring in low volume and long duration precipitation events. This is evidenced by reductions in runoff ratio, peak flow, and flashiness indices, with the largest reductions occurring in low volume long duration storms for all three metrics. The findings with runoff ratio and peak flow suggest that, as precipitation events increase in size and decrease in duration, soil and storage quickly becomes saturated, prohibiting infiltration and redirecting runoff downstream, rendering the structures less effective. These findings are consistent with previous studies (Pennino et al. 2016; Thomas et al. 2016; Zellner et al. 2016; Loperfido et al. 2014; Bell et al. 2016). Another possible reason why direct runoff increases with increase in rainfall intensity is that rainfall and direct runoff have less time to be infiltrated while being transported to downstream areas, as rainfall intensity is greater than infiltration rate. With the dominance of clay-type soils, the study area’s soil could quickly expand, decreasing pore sizes and thus not allowing rainwater to infiltrate into soils. Although mostly consistent across storms (ranging 57-70%), the trend exhibited with flashiness suggests that small and long precipitation events are more likely to allow for GSI to function without becoming quickly overwhelmed and failing to capture additional runoff. This finding is supported by previous studies that have found flashiness⎯sometimes referred to hydrograph kurtosis⎯is either unaffected or dampened by GSI (Hood et al. 2007).
One of the most frequently mentioned gaps in GSI literature is the need for research to compare different types of spatial arrangements of infrastructure, particularly as it relates to the dispersion of structures across a landscape (Lim and Welty 2017). As noted in a review by Golden and Hoghooghi (2017), there exist “future questions about optimal spatial configurations for [GSI] practices” and recommend “considering the placement and spatial configurations of [GSI] practices in the catchment. The second scenario seeks to answer this question by comparing distributed GSI to centralized GSI. In general, we find that distributed infrastructure outperforms centralized for all three metrics, and to a greater extent for smaller, shorter duration storms (albeit for flashiness, large short storms exhibited the greatest relative reduction). This indicates that distributed infrastructure is key in reducing runoff volumes and peak discharges, and likely because flow paths are intercepted before runoff can amalgamate and exacerbate centralized facilities downstream. The findings that stronger reductions occur for smaller shorter events indicates that GSIs are more effective for smaller events because they are typically designed to deal with smaller events than larger events that grey infrastructure may handle. While many studies have found that GSI is more effective at lower precipitation volumes and duration (Her et al. 2017; Thomas et al. 2016; Loperfido et al. 2014; Qin et al. 2013; Chapman & Horner 2010; Hood et al. 2007; Mentens et al. 2006), our findings suggests that the distributed structures may be the driving force behind the impact of GSI in these types of storms. Identifying that larger storms exhibit the greatest relative reduction in flashiness from centralized to dispersed arrangements is likely an outcome of the lack of an ability for large centralized facilities to absorb water quickly when overwhelmed with high intensity runoff. Furthermore, because the speed of runoff increases as it amalgamates, dispersed GSI may be better suited to separate flows that would otherwise combine and move at higher rates towards centralized facilities and
system outfalls (Horner et al. 1994; Schueler 1987). All things considered, previous studies comparing the spatial dispersion of GSI are largely aligned with the findings of this paper (Fry and Maxwell, 2017; Kim and Park, 2016). Our research supports these findings in suggesting that distributed structures are the driving force in GSI efficacy and may be better suited to mitigate nuisance frequent flooding than centralized facilities.
5
CONCLUSIONS
Understanding the types of spatial arrangements and climate scenarios under which GSI is most effective can lend direction not only to future academic and scientific research but also to city practitioners looking to guide planning efforts as they pertain to reducing flooding hazards. As with any municipality promoting development of new residential neighborhoods, careful consideration is spent identifying costs and benefits in investing in disaster risk reduction. Because GSI becomes increasingly more expensive as it is designed to capture greater volumes of runoff (Lim and Welty 2016), there exists a need to quantify performance and identify the point in which it ceases to function effectively. This research shows that GSI is most effective when distributed across a landscape, and when designed with the purpose of reducing the impact of low volume, short duration precipitation events. Moreover, the results in this research can serve urban planners aiming to build risk resilient neighborhoods with potential increases in precipitation and the resulting flooding as with the city of Portland. Lastly, this study contributes to the growing body of literature addressing the importance of the spatial scale of analyzing hydrologic phenomena and the relationship between runoff and connectivity of neighborhood systems.
REFERENCES
Ahiablame, L.M., Engel, B.A., and Chaubey, I. (2012) Effectiveness of low impact development practices: Literature review and suggestions for future research. Water Air and Soil Pollution, 223, 4253–4273.
Ashley, R.M., Balmforth, D.J., Saul, A.J., and Blanskby, J.D. (2005) Flooding in the future – predicting climate change, risks and responses in urban areas. Water Science and Technology, 52 (5), 265–273.
Avellaneda, P.M., Jefferson, A.J., Grieser, J.M. and Bush, S.A. (2017) Simulation of the cumulative hydrological response to green infrastructure. Journal of Water Resources, 53 (4), 3087–3101.
Baker, A., Brenneman, E., Chang, H., McPhillips, L., and Matsler, M. (2019) Spatial Analysis of Landscape and Sociodemographic Factors Associated with Green Stormwater Infrastructure Distribution in Baltimore, Maryland and Portland, Oregon, Science of the Total Environment, 664, 461-474.
Baker, D.B., Richards, P.R., Loftus, T.T., and Kramer, J.W. (2004) A New Flashiness Index: Characteristics and Applications to Midwestern Rivers and Streams. Journal of the American Water Resources Association. Paper No. 03095. Bedan, E.S., and Clausen, J.C. (2009) Stormwater runoff quality and quantity from
traditional and low impact development watersheds. Journal of the American Water Resources Association, 40 (2), 998–1008.
Bell, C.D., McMilan, S.K., Clinton, S.M., and Jefferson, A.J. (2016) Hydrologic response to stormwater control measures in urban watersheds. Journal of Hydrology, 541 (B), 1488–1500.
Burns, M.J., Fletcher, T.D., Walsh, C.J., Ladson, A.R., and Hatt, B.E. (2012) Hydrologic shortcomings of conventional urban stormwater management and opportunities for reform. Landscape and Urban Planning 105 (3), 230-240.
Chapman, C., and Horner, R.R. (2010) Performance assessment of a street-drainage bioretention system. Water Environment Research, 82 (2), 109–119.
City of Gresham (2017) GIS, Land Cover, outflow, and development history data, Offices of Environmental Services and Water Resources.
Department of Ecology, State of Washington (2015) Combined Sewer Overflows. [online]. Available at https://ecology.wa.gov/Regulations-Permits/Permits-certifications/Combined-Sewer-Overflows [accessed 26 May 2018].
Davis, A.P. (2008) Field performance of bioretention: hydrology impacts. Journal of Hydrologic Engineering, 13 (2), 90–95.
Demuzere, M., Orru, K., Heidrich, O., Olazabal, El, Geneletti, D., Orru, H., Bhave, A.G., Mittal, N., Feliu, E., and Faehnle, M. (2014) Mitigating and adapting to climate change: Multi-functional and multi-scale assessment of green urban infrastructure. Journal of Environmental Management, 146, 107-115.
Fassman, E.A., and Blackbourn, S. (2010) Urban runoff mitigation by a permeable pavement system over impermeable soils. Journal of Hydrologic Engineering, 15 (6), 475–485.
Fry, T.J., and Maxwell, R.M. (2017) Evaluation of distributed BMPs in an urban watershed—high resolution modeling for stormwater management. Hydrological Processes, 31 (15), 2700–2712.
Garcia-Cuerva, L., Berglund, E. Z., and Rivers III, L. (2018) An Integrated approach to place Green Infrastructure strategies in marginalized communities and evaluate stormwater mitigation. Journal of Hydrology, 559, 648-660.
Gill, S.E., Handley, J.F., Ennos, A.R., and Pauleit, S. (2007) Adapting Cities for Climate Change: The Role of the Green Infrastructure. Built Environment, 33 (1), 115-133(19).
Gilroy, K.L., and McCuen, R.H. (2009) Spatio-temporal effects of low impact development practices. Journal of Hydrology, 367 (3-4), 228-236.
Golden, H.E., and Hoghooghi, N. (2017) Green infrastructure and its catchment-scale effects: an emerging science. Wiley Interdisciplinary Reviews: Water, 5 (1), 254. Granados-Olivas, A., Alatorre-Cejudo, L.C., Adams, D., Serra, Y.L., Esquivel-Ceballos,
V.H., Vázquez-Gálvez, F.A., Giner, M.E. and Eastoe, C. (2016) Runoff Modeling to Inform Policy Regarding Development of Green Infrastructure for Flood Risk Management and Groundwater Recharge Augmentation along an Urban Subcatchment, Ciudad Juarez, Mexico. Journal of Contemporary Water Research & Education, 159 (1), 50–61.
Gregoire, B.G., and Clausen, J.C. (2011) Effect of a modular extensive green roof on stormwater runoff and water quality. Ecological Engineering, 37 (6), 963–969. Her, Y., Jeong, J., Arnold, J., Gosselink, L., Glick, R. and Jaber, F., (2017) A new
framework for modeling decentralized low impact developments using Soil and Water Assessment Tool. Environmental Modelling & Software, 96, 305-322.
Hirabayashi, Y., Mahendran, R., Koirala, S., Konoshima, L., Yamazaki, D., Watanabe, S., Kim, H., and Kanae, S. (2013) Global Flood Risk Under Climate Change. Nature Climate Change, 3, 816-821.
Hood, M.J., Clausen, J.C. and Warner, G.S. (2007) Comparison of Stormwater Lag Times for Low Impact and Traditional Residential Development. Journal of the American Water Resources Association, 43 (4), 1036–1046.
Horner, R.R., Skupien, J.J., Livingston, E.H. and Shaver, H.E. (1994) Fundamentals of Urban Runoff Management: Technical and Institutional Issues. In cooperation with U.S. Environmental Protection Agency. Terrene Institute, Washington, D.C. Hunt, W.F., and Szpir, L.L. (2006) Permeable pavements, green roofs, and cisterns: Stormwater treatment practices for low-impact development. Urban Waterways, AG, 588-606.
Jarden, K.M., Jefferson, A.J., and Grieser, J.M. (2016) Assessing the effects of catchment-scale urban green infrastructure retrofits on hydrograph characteristics. Hydrological Processes, 30 (10), 1536–1550.
Jayasooriya V., and Ng, A. (2014) Tools for modeling of stormwater management & economics of green infrastructure Practices: a review. Water, Air, & Soil Pollution, 225, 1–20.
Johnson Creek Watershed Council. (2005) Johnson Creek Watershed Characterization [online]. Available at https://portlandoregon.gov/bes/article/214368 [accessed 26 May 2018].
Kim, H.W., and Park, Y. (2016) Urban green infrastructure and local flooding: The impact of landscape patterns on peak runoff in four Texas MSAs. Applied Geography, 77, 72-81.
Lim, T.C, and Welty, C. (2017) Effects of spatial configuration of imperviousness and green infrastructure networks on hydrologic response in a residential sewershed. Water Resources Research, 53 (9), 8084–8104.
Loperfido, J.V., Noe, G.B., Jarnagin, S.T., and Hogan, D.M. (2014) Effects of distributed and centralized stormwater best management practices and land cover on urban stream hydrology at catchment scale. Journal of Hydrology, 519 (C), 2584–2595.
Martz, L.W., and Garbrecht, J. (1992) Numerical definition of drainage network and subcatchment areas from Digital Elevation models. Computers & Geosciences, 18 (6), 747-761.
Matthews, T., Lo, A.Y., and Byrne, J.A. (2015) Reconceptualizing Green Infrastructure for Climate Change Adaptation: Barriers to Adoption and Drivers for Uptake by Spatial Planners. Landscape and Urban Planning, 138, 155-163.
Mentens, J., Raes, D., and Hermy, M. (2006) Green roofs as a tool for solving the rainwater runoff problem in the urbanized 21st century? Landscape and urban planning, 77 (3), 217–226.
Miles, B., and Band, L.E. (2015) Green infrastructure stormwater management at the watershed scale: urban variable source area and watershed capacitance. Hydrological Processes, 29 (9), 2268–2274.
Moore, T.L., Gulliver, J.S., Stack, L., and Simpson, M.H. (2016) Stormwater management and climate change: vulnerability and capacity for adaptation in urban and suburban contexts. Climatic Change, 138 (3-4), 491-504.
Moriasi, D.N., Arnold, J.G., Van Liew, M.W., Bingner, R.L., Harmel, R.D., and Veith, T.L. (2007) Model Evaluation Guidelines for Systematic Quantification of
Nash, J.E., and Sutcliffe, J. V. (1970) River flow forecasting through conceptual models part 1—A discussion of principles. Journal of Hydrology, 10 (3), 282-290. Noreen, A. (2015) Sustainability in Stormwater Management in a Changing Climate: A
Case Study in Falkenberg, Sweden. Uppsats för avläggande av masterexamen i naturvetenskap, 30 (hp), 1-78.
Palmer, M.A., Liu, J. Matthews, J.H., Mumba, M., and D’Odorico, P. (2015) Manage Water in a Green Way. Science, 349 (6248), 584-585.
Pennino, M.J., McDonald, R.I., and Jaffe, P.R. (2016) Watershed-scale impacts of stormwater green infrastructure on hydrology, nutrient fluxes, and combined sewer overflows in the mid-Atlantic region. Science of the Total Environment, 565 (15), 1044-1053.
Portland HYDRA Rainfall Network. (2018) City of Portland Bureau of Environmental Services and United States Geographical Survey [online]. Available at https://or.water.usgs.gov/non-usgs/bes/ [accessed 15 November 2018].
Qin, H. P., Li, Z. X., and Fu, G. (2013) The effects of low impact development on urban flooding under different rainfall characteristics. Journal of Environmental Management, 129, 577-585.
Rosenzweig, B., McPhillips, L., Chang, H., Cheng, C., Welty, C., Matsler, M., and Iwaniec, D. (2018) Urban pluvial flood risk and opportunities for resilience, Wires Water 5(6): e1032.
Schueler, T.R. (1987) Controlling Urban Runoff: A Practical Manual for Planning and Designing Urban BMPs. Metropolitan Washington Council of Governments. Maryland Stormwater Design Manual. Maryland Department of the Environment. Baltimore, MD.
Selbig, W.R., and Bannerman, R.T. (2008) A comparison of runoff quantity and quality from two small basins undergoing implementation of conventional- and low-impact-development (LID) strategies: Cross Plains, Wisconsin, water years 1999–2005. U.S. Geological Survey Scientific Investigations Report, 57 (viii), 2008–5008.
Thomas, N.W., Antonio, A.A., Schilling, K.E., and Weber, L.J. (2016) Evaluating the efficacy of distributed detention structures to reduce downstream flooding under variable rainfall, antecedent soil, and structural storage conditions. Advances in Water Resources, 96, 74-87.
Tsai, L.Y., Chen, C.F., Fan, C.H. and Lin, J.Y. (2017) Using the HSPF and SWMM models in a high pervious watershed and estimating their parameter sensitivity. Water, 9 (10), 780.
Tsihrintzis, V.A., and Hamid, R. (1998) Runoff quality prediction from small urban catchments using SWMM. Hydrological Processes, 12, 311-329.
Wang, X., Shuster, W., Pal, C., Buchberger, S., Bonta, J., and Avadhanula, K. (2010) Low impact development design-integrating suitability analysis and site planning for reduction of post-development stormwater quantity. Journal of Sustainability, 2 (8), 2467–2482.
Wang, M., Zhang, D.Q., Adhityan, A., Ng, W.J., Dong, J., and Tan, S.K. (2016) Assessing cost-effectiveness of bioretention on stormwater in response to climate change and urbanization for future scenarios. Journal of Hydrology, 543 (B), 423-432.
Wainwright J., Turnbull L., Ibrahim T.G., Lexartza-Artza I., Thornton, S.F., and Brazier, R.E. (2011) Linking environmental Régimes, space and time: interpretations of structural and functional connectivity. Geomorphology, 126 (3-4), 387–404. Western Regional Climate Center (2019) Portland International Airport 1981-2010
Monthly Climate Summary. Available at https://wrcc.dri.edu/cgi-bin/cliMAIN.pl?or6751.
Zellner, M., Massey, D., Minor, E., and Gonzalez-Meler, M. (2016) Exploring the effects of green infrastructure placement on neighborhood-level flooding via spatially explicit simulations. Computers, Environment and Urban Systems, 59, 116-128.
Zimmerman, M.J., Barbaro, J.R., Sorenson, J.R., and Waldron, M.C. (2010) Effects of selected low-impact-development (LID) techniques on water quality and quantity in the Ipswich River Basin, Massachusetts—field and modeling studies. U.S. Geological Survey Scientific Investigations Report, 2010–5007, xiv, 110-113.