A COMPARISON OF SOIL MANAGEMENT SYSTEMS FOR URBAN AGRICULTURE
BY
ELIZABETH ANN MIERNICKI
THESIS
Submitted in partial fulfillment of the requirements for the degree of Master of Science in Crop Sciences
in the Graduate College of the
University of Illinois at Urbana-Champaign, 2017
Urbana, Illinois Master’s Committee:
Assistant Professor Samuel Wortman, Co-Chair Associate Professor Sarah Taylor Lovell, Co-Chair Associate Professor Anthony Yannarell
ABSTRACT
Soil contamination is a universal concern of urban agriculture. Reliable soil management systems are desirable in order to provide ideal growing conditions for urban crops. Due to concerns such as soil contamination, alternative soil management systems (e.g. raised-beds) are necessary to provide safe, fresh food for community members. The long-term benefits of raised-beds and similar soil management systems have not been explored in the scientific literature. Determining the agronomic and environmental benefits of soil management systems will aid in implementing design systems favorable to groups of plants requiring different environmental conditions. Crop-specific management practices will potentially allow optimal crop growing
conditions to be met. Importing soil resources into a city can be expensive, however, the long-term benefits of these soil systems may outweigh this initial resource investment. The objective of this study is to determine the effects of six soil management options on crop yield, soil biological, chemical, and physical properties, as well as ecosystem services including water and nutrient retention. Soil management systems studied include direct soil + synthetic fertilizer (DSF), direct soil + organic amendments (DSO), raised-bed mixture + synthetic fertilizer (RBMF), raised-bed mixture + organic
amendments (RBMO), raised-bed compost-only + synthetic fertilizer (RBCF), and raised-bed compost-only + organic amendments (RBCO). Crops grown in each
treatment include kale, garlic, pepper, cilantro, and radish. Crop yield was separated by quality (marketable vs. cull) and weighed. Data is collected for soil nutrients and organic matter, soil moisture, weed emergence, soil water infiltration rate and bulk density.
ACKNOWLEDGEMENTS
First and foremost, I would like to thank my adviser, Dr. Sam Wortman, for his assistance in both of my studies and patience with all of my research questions. I truly appreciate the opportunity to have been a member of the UIUC Urban Agriculture lab. Further, I would like to thank the other members of my research committee: Thank you to Dr. Sarah Taylor Lovell for her support and commentary on my work including my departmental seminar. Also, I would like to thank Dr. Tony Yannarell for his patience and assistance with lab work during my Suståne project as well as his suggestions and commentary on my work.
Next, I would like my lab group and lab tech Michael Douglass to know that my work would not have been possible without them. I truly enjoyed working alongside Michael and creating a new field work skillset from him. The summer work crews also deserve recognition for their assistance in data collection and ability to make field work a little less monotonous.
Thank you to my family for their genuine interest in my research and constant support throughout my schooling. I would also like to extend thanks to Kelsey Mehl and Jenwei Tsai for their continual encouragement and ongoing support throughout both of my degrees and life itself. Also, shout out to Boswell Hutson for his endless support and understanding of my graduate student work schedule.
Finally, I would like to thank the PSL vending machine for supplying me endless amounts of Gardetto’s Original Recipe Snack Mix in order to get through writing and help satisfy late night snack cravings. Money well spent.
TABLE OF CONTENTS
Chapter One: The long-term effects of urban soil management systems on
soil biological, chemical, and physical properties ...1 Chapter Two: The long-term effects of urban soil management systems on
crop yield and weed emergence ... 22 Tables and Figures... 35 Literature Cited ... 53
CHAPTER ONE
The long-term effects of urban soil management systems on soil biological, chemical, and physical properties
Introduction
The challenge of providing a reliable food source for the increasing population is consistently growing. Food deserts, large geographic areas with limited access to affordable and healthy food, are prevalent and add a level of complexity to the food demands of urban communities (Dutko et al., 2012). Urban food deserts are commonly comprised of higher densities of fast food restaurants (Block et al., 2004), liquor stores (La Veist and Wallace, 2000), and lower densities of grocery stores (Chung and Myers, 1999). Urban agriculture, the production and processing of food where it is consumed in a city, has the potential to increase food access to those facing food insecurity. Further, urban agriculture offers additional benefits aside from the provisioning of food
production, such as the recycling and re-use of organic and water wastes (de Zeeuq et al., 1999; Mok et al., 2014), mitigation of storm water impacts (Ackerman et al., 2014), carbon sequestration (Kulak et al., 2013), and increased fauna and flora biodiversity (Taylor and Lovell, 2014; Matteson et al., 2008).
Urban farmers and gardeners are increasingly interested in the use of raised-bed production systems due to a variety of environmental constraints. Two common raised-bed systems used for crop production are temporary (e.g. frameless) and permanent (e.g. walled) raised-beds. Temporary raised-beds do not involve constructing a
afford the cost of building materials. An additional benefit of these systems is that they are less labor-intensive (Cudnik, 2004). However, the need for reconstruction may occur due to soil erosion from the absence of walls. Permanent raised-beds are built on top of the native soil where a framework is constructed and filled with soil or soilless media (Cudnik, 2004). Permanent raised-bed systems are often desirable for urban food production because urban soils are often characterized by a range of agronomic
constraints such as low organic matter levels (Beniston and Lal, 2012), soil compaction (Scharenbroch et al., 2005), and pollutant contamination (Witzling et al., 2011).
Soil media types often used in raised-bed systems include mixtures of top soil and compost or solely compost. Compost is a versatile organic amendment that is capable of increasing porosity and enhancing water retention and availability to plants (Agnew and Leonard, 2003). Further, soil mixtures involving compost offer better soil conditions for water drainage (Cudnik, 2004) and increase nutrient content (Lopez-Mondejar et al., 2010).
Soil contamination is a common concern in urban gardens due to potential pollutant bioaccumulation within crops and potential inhalation of contaminated soil particles (Madrid et al., 2008). The history of a prospective growing site can inform the type of pollutants likely present in the soil. For example, soil contamination mainly occurs from anthropogenic sources including industrial activity (Howard and Shuster, 2015; Kim et al., 2014), industrial waste (Schuhmacher et al., 1997), and heavy traffic areas (Kim et al., 2014). Further, urban areas often contain common contaminants including polycyclic aromatic hydrocarbons (PAHs) (Motelay-Massei et al., 2004), and trace metals such as cadmium (Smolders, 2001), arsenic (Ramirez-Andreotta et al., 2013), and lead (Binns et
al., 2004; Zhu et al., 2003). Further, the availability of environmental contaminants to plants spatially varies in an urban landscape due to pollutant retention mechanisms which are regulated by the soil organic matter, pH, CEC, and oxides found within a soil (Pouyat et al., 2010).
Lead is considered one of the more ubiquitous pollutants due to its wide distribution in urban soils (Yaffe et al., 1983). The U.S. EPA upper limit for lead in soils is 400 ppm; thus, it is generally recommended to avoid growing edible crops in soils near or exceeding 400 ppm lead (USEPA, 2001). However, the threat of bioaccumulation is variable among crop species. Horticultural crops grown in contaminated soils may
become contaminated through plant uptake of lead or direct deposition of dust onto crop surfaces, at levels capable of causing health concerns (Finster et al., 2004; Rahlenbeck et al., 1999). Finster et al. (2004) examined the lead translocation pattern within crops grown in contaminated residential soils and discovered that the highest levels were within the root portion of the plant, followed by the shoot, and then the leaves. Further, only one fruiting vegetable (cucumber at 81 ppm) contained a detectable lead level within the edible portion.
Common exposure pathways to soil pollutants aside from crop consumption are through direct ingestion, inhalation, or dermal contact of soil (Kim et al., 2014).
Consumption of contaminated soil can negatively impact the health of the consumer in the form of nervous system damage and certain cancers (Kim et al., 2014). Further, toxic blood levels of lead ≥ 10 μg/dL-1 in children is of high concern due to lead’s
properties as a neurotoxin that inhibits development (Finster et al., 2004; Raymond and Brown, 2015). Due to these potential health concerns, mitigation practices for soil
contamination exposure are highly recommended and required in some municipalities. Common mitigation practices include raised-beds or “cap-and-fill” methods where a semi- or entirely impermeable barrier is applied over existing soil and topped with a growing media (e.g., compost, topsoil, or a mix of both) (Witzling et al., 2011; Wortman and Lovell, 2013). Not only do these soil management practices provide a barrier
between contaminated soil and the crops, they also play a role in improving soil physical properties for crop production.
An additional environmental challenge for urban crop production is soil
compaction (Gregory et al., 2006). Urban soils are known to be severely compacted due to disturbances from construction vehicle traffic (Gregory et al., 2006) and high rates of foot traffic (Millward et al., 2011). Disadvantages of compacted soils include restricted root growth, increased bulk densities, and decreased aeration (Kozlowski, 1999). The altered soil physical properties within urban environments may prove difficult for food production. Wolfe et al. (1995) showed a reduction of total biomass production of 30% and 14% in snap bean and cabbage in a controlled greenhouse soil compaction experiment which mirrored their field study. Further, high soil compaction levels may lower water infiltration rates (Bartens et al., 2012; Pit et al., 1999) which in turn may contribute to increased storm water runoff (Pitt et al., 2008). Raised-bed systems are often implemented in urban food production to improve soil physical properties for ideal growing conditions.
Urban soils are also characterized by having low levels of organic matter (Cogger, 2005) and decreased microbial activity (Scharenbroch et al., 2005). Soil nutrient concentrations in the landscape vary due to past soil disturbances and recent
management practices such as the use of fertilizer or organic amendments (Lewis et al., 2006). Advantages of using compost as a soil amendment in urban food production include increasing soil organic matter levels (Marmo, 2008) and microbial activity
(Guisquiani et al., 1995). Ge et al. (2013) showed greater microbial activity and diversity in organically managed cabbage-tomato systems applied with pig manure (40 t ha-1) than the conventionally managed systems. Further, microbial biomass was greatest in the plastic greenhouse system under organic management (Ge et al., 2013). Microbial communities play a significant role in nutrient cycling and decomposition processes in soil. For example, a carbon to nitrogen ratio (C:N) less than 20 in compost has the potential to release mineral N during decomposition which is desirable for plant uptake (Stofella et al., 1997).
Soils with high organic matter content have high water holding capacities due to soil aggregation and pore space distribution (Saxton and Rawls, 2006). Compost is a versatile organic amendment often used in urban agriculture and is capable of
increasing porosity and enhancing water retention and availability to plants (Agnew and Leonard, 2003). For example, Weindorf et al. (2006) observed increases in soil water content with elevated levels of landscape waste compost. Inappropriate management of nutrient-rich compost and other organic amendments may contribute to urban storm water pollution through leaching of nutrients (Lorenz, 2015).
The goal of this study was to determine the long-term effects of six soil
management systems on soil biological, chemical, and physical properties over a two year period. We hypothesized that the raised-bed systems, with their expected
growing conditions compared to the direct soil + synthetic fertilizer system. Results derived from this study can provide practical and essential scientific information to urban growers about the feasibility of urban food production.
Materials and Methods
Field experiments were conducted in 2015 and 2016 at the University of Illinois Sustainable Student Farm in Urbana, IL (40⁰4’56.63”N 88⁰12’40.39W). The dominant soil type at this site is silt loam. Cropping history before construction of the research plots involved corn (Zea mays) and soybean (Gylcine max) production for the previous three growing seasons.
Research plots were arranged in a randomized complete block design with a total of six treatments and four replicates. The soil management treatments included: 1) direct soil + synthetic fertilizer (DSF), 2) direct soil + organic amendments (DSO), 3) raised-bed mixture + synthetic fertilizer (RBMF), 4) raised-bed mixture + organic
amendments (RBMO), 5) raised-bed compost-only + synthetic fertilizer (RBCF), and 6) raised-bed compost-only + organic amendments (RBCO). Generally, soil management treatments were created to test differences between organic and conventional crop management in direct soil or raised-bed systems of variable composition.
The experimental units were 1.5 m2 permanent structures where an 8.89 cm wooden lip was installed for the direct soil plots and the raised-beds were filled with approximately 0.65 m3 of the appropriate soil media (Table 1). The direct soil + organic amendments treatment received a 0.002 m3 application of municipal compost which was incorporated into the native top soil to a depth of 10.16 cm using a Honda FG110
rototiller (American Honda Motor Co., Inc., Alpharetta, GA, USA). The topsoil and mushroom compost were sourced from Country Arbors Nursery in Urbana, IL and the municipal compost was purchased from the Landscape Recycling Center in Urbana, IL. An initial soil chemical analysis of the soil and compost substrates can be found in Table 2.
A total of five crops were grown in rotation including cilantro (Coriandrum sativum
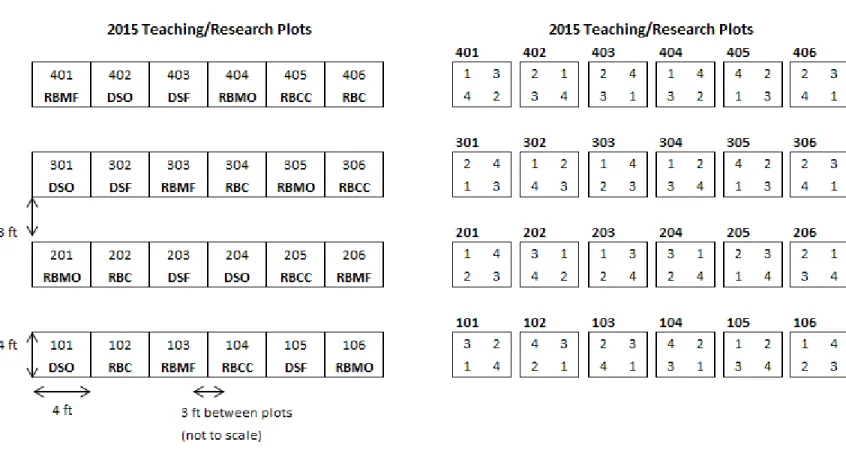
var. Calypso), kale (Brassica oleracea var. Toscano), and garlic (Allium sativum var. Music (2015); German Red (2016)), organic sweet pepper (Capsicum annuum var. Lunchbox Red), and radish (Raphanus sativus var. Red Meat). The experimental units were divided into four 0.19 m2 quadrants. Crops were rotated clockwise one quadrant within a plot each year (Fig. 1). Crop rotation treatments can be found in Table 3. All crops except for kale and pepper were direct seeded by hand. Kale and pepper plants were transplanted on appropriate planting dates (Table 4). Organic soybean (Glycine max) and hairy vetch (Vicia villosa) cover crop seeds were planted in the organic management treatments (DSO, RBMO, and RBCO) and followed garlic and pepper, respectively. (Table 3). Cilantro, soybean crop residue, and hairy vetch green manure were incorporated into the soil using a hand trowel during termination. All other crop resides were removed from the experimental plots, with the exception of the pepper and kale roots.
Experimental plots were irrigated using drip irrigation (Indiana Irrigation Co., Onward, IN, USA; DripWorks, Willits, CA, USA). Two emitter lines were used per plot in 2015. Due to inefficient water coverage in 2015, three emitter lines were installed in 2016. The spacing between the emitter holes in the emitter line was 15.24 cm for a total
of eight emitters per line. Surface soil moisture readings were used in conjunction with tensiometer readings to determine irrigation schedules. In 2015, the direct soil plots and all raised-beds received a total of 7069 and 6820 gallons of irrigation water,
respectively. In 2016, the direct soil plots, raised-bed mixes, and compost raised-beds received 4359, 3698, and 5299 gallons of irrigation water, respectively.
Soil sampling was performed using JMC soil probes consisting of a 1.9 cm bore (Clements Associates Inc., Newton, IA, USA) and an AMS soil probe consisting of a 2.54 cm bore (AMS Inc., American Falls, ID. USA). Soil sampling occurred two times per season at pre-plant (spring) and post-harvest (fall) for chemical analysis. Two cores per quadrant were collected at a depth of 20 cm for a total of eight cores per plot.
Samples were sent to Ward Laboratories in Kearney, NE and analyzed for soil pH, organic matter, cation exchange capacity (CEC) total nitrogen, NO3-N, P, K, Ca, Mg, SO4-S, and Na. Additional soil samples were collected prior to planting radish to determine nitrogen fertilizer needs. Two cores per radish quadrant were collected to a depth of 20 cm, aggregated, and analyzed for nitrate and ammonium (Ward
Laboratories, Kearney, NE, USA). Fertilization rates were calculated by averaging total N value per treatment (Table 5). The N critical threshold for leafy crops (cilantro, kale, garlic, and radish) was based on 50 lbs N/acre and 100 lbs N/acre for fruiting crops (pepper).
Additional soil sampling was conducted once per field season for microbial analysis. A total of four soil cores were pulled from a depth of 10 cm in each plot and stored at 4 ⁰C for a maximum of three weeks before analysis (Gonzalez-Quiñones et al., 2009). Soil microbial activity was measured using the MicroResp colormetric method
(The James Hutton Institute, Aberdeen, Scotland, UK; Campbell et al. 2003). A glucose and lignin substrate was used to induce microbial respiration from physiologically
distinct functional groups (e.g., bacterial and fungal communities). Using the MicroResp filling device, 96 deep-well plates were filled with the appropriate subsamples. There were a total of three technical reps per plot. The deep-well plates were stored at 4 ⁰C until needed and to equilibrate microbial communities. CO2 detection plates were created and placed in a desiccator until time of analysis. Detection plates include a cresol red + agar solution which changes color as a response to microbial respiration. Once the deep-well plates were filled with soil, 25 μL of a 0.1 mg/ml glucose solution and 0.05 mg/mL of a lignin solution was aliquoted into the appropriate soil subsamples. A silicone gasket was applied immediately after adding the substrates. Before
assembling the detection and deep-well plates for incubation, a T0 absorbance reading for the detection plates occurred. Once the detection plates, silicone gasket, and deep-well plates were assembled inside the MicroResp clamp, incubation occurred at room temperature for 6 hr. A Microplate spectrophotometer at 570 nm was used to measure the color change from CO2 exposure during the incubation period of 0h and 6 hr
(Epoch, Biotek Instruments, Inc., Winooski, VT, USA).
Surface soil moisture measurements were recorded weekly throughout each growing season. A total of four aggregate measurements were collected per plot using a four pronged TH2O portable soil moisture meter (Dynamax Inc., Houston, TX, USA).
Tensiometers (IRROMETER Company, Inc., Riverside, CA, USA) were installed to a depth of 15.2 cm in the center of each plot in early spring and removed after the last crop harvest in fall to avoid potential freeze damage. Tensiometers measure the
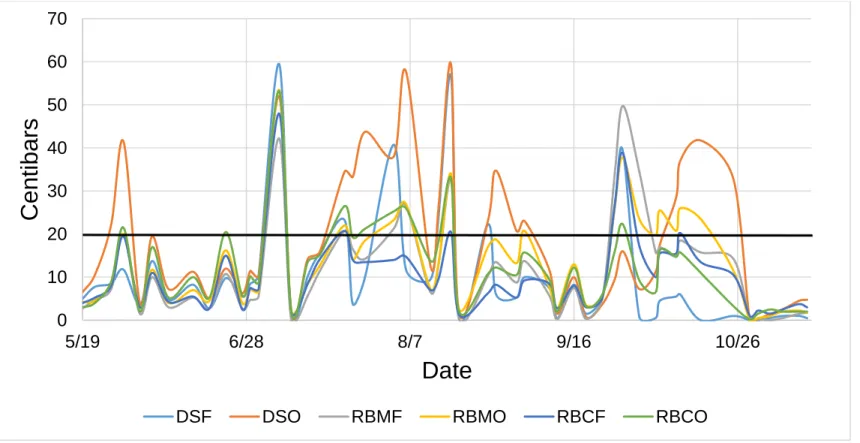
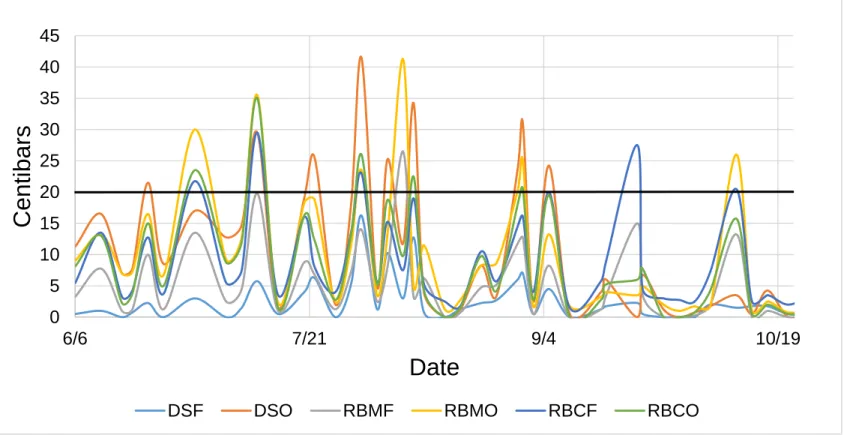
tension of water to the surrounding soil or compost substrates (Agnew and Leonard, 2003). Analog soil tension readings were recorded two times per week to inform irrigation scheduling. A soil is under nearly saturated conditions when a tensiometer reads 0-5 centibars and reflects field capacity at 5-20 centibars (Harrison, 2012). Further, irrigation is to occur when a tensiometer reads 20-60 centibars. Readings greater than 60 centibars indicates water stressed conditions. The tensiometers were serviced periodically throughout the growing season to prevent air build-up.
Water infiltration rates were measured using a Turf-tec infiltrometer (Turf-tec International Tallahassee, FL, USA). Two measurements were collected from pepper and kale quadrants at the beginning of each field season. If necessary, water was added to the sample area to achieve saturated conditions prior to collecting infiltration data. If there was no recent rain, direct soil plots (DSF and DSO) required
approximately 1.2 L to achieve saturation and raised-beds required approximately 3.6 L. If there was recent rain, the direct soil plots did not require pre-treatment, but raised-beds still required 2.4 L to achieve saturation. Using the handle grips, the double ring cutter blades were pushed into the soil surface until the Saturn ring lip reached the soil surface. The inner and outer rings were filled with water until the position of the pointer read zero on the inch scale. The position of the pointer was recorded after ten minutes had elapsed, or the time elapsed when the pointer reached the bottom of the scale.
Bulk density was measured at the beginning of each growing season. One soil sample per plot was collected at a depth of 7.6 cm using a 1.9 mm diameter cylinder ring. The volume of the cylinder was 93.3 cm3. Each soil sample was mixed by hand and a 1-2 oz subsample was extracted. Fresh weights were recorded and subsamples
were placed into an oven for 24 hours at 105 ⁰C to determine dry weight. Gravimetric water content (g/g) and soil porosity (%) were determined from the bulk density measurements.
Analysis of variance (ANOVA) was performed using the GLIMMIX procedure in SAS (v9.4, SAS Institute, Cary, NC, USA). Replication and year were treated as random effects unless there was a significant treatment interaction with year in preliminary analyses. Soil management treatment was treated as a fixed effect. Unless otherwise noted, most soil chemicals were analyzed by year due to a significant treatment by year interaction. Repeated measures analysis was used for tensiometer and surface
moisture data and time was a random effect. The Tukey-Kramer multiple comparisons test was used to determine the differences among least squares means at significance level of α=0.05.
Results and Discussion
Soil pH, organic matter content, and cation exchange capacity
In general, raised-bed treatments were higher in pH than the direct soil treatments across both years. In 2015, pH levels (p=0.0047) were greatest in the compost-only raised-bed treatments (Table 6). In 2016, pH levels (p=0.0014) were highest in the raised-bed mix treatments (Table 7). Depending on the pH of a compost and the native soil, the addition of the compost can raise the overall soil pH (Alexander, 2001). The varying pH levels of compost influence the chemical solubility and
Overall, organic matter content was highest in the compost-only raised-beds and lowest in the direct soil plots across both years. There was a 1.5× increase in organic matter in the compost-only raised-beds between 2015 (p<0.0001) and 2016 (p<0.05) (Table 6 & 7), which is not surprising given the inherently high organic matter content of compost. McSorley and Gallaher (1996) reported increased soil organic matter over time in treatments receiving yard waste compost. Soil organic matter serves multiple functions such as improving nutrient storage and structure of a soil (Lal, 2007). Management practices to improve soil organic matter in addition to organic
amendments are cover cropping (Hartwig and Ammon, 2002) and crop rotation (Watson et al., 2002).
In general, the soil media in the raised-bed treatments contained higher cation exchange capacity levels (p<0.0001) than the direct soil plots (Table 8). The compost-only treatments consisted of the highest cation exchange capacity levels. Organic matter and clay particles are capable of retaining positively charged ions due to negatively charged sites on the surface of the particles. Soils containing high CEC levels prevent soluble cations from leaching away from the plant root zone (Crouse 2016). Most increases in CEC levels are seen when organic matter is applied to sandy soils (Hortensine and Rothwell, 1968).
Macronutrients
Total nitrogen levels (p<0.0001) for the compost-only raised-bed treatments were about 3× higher than the raised-bed mixes and 4.5-5× higher than the direct soil plots (Table 8). The substantial nitrogen supply does not necessarily reflect the availability of mineral forms (nitrate and ammonium) for crop uptake (Cogger, 2005). However, given
the inherent nitrogen fertility of the compost-only and mixed raised-beds and sufficient nutrient mineralization rates, fertilizer applications were not necessary during the course of the experiment; this highlights a sustainability benefit of compost-based raised beds. Overall, the raised-beds contained the highest soil nitrate levels (Tables 6 & 7). Specifically, nitrate levels in the compost-only raised-beds were 4× greater than the direct soil plots. Available nitrogen depends on the type of feedstock used to create organic amendments and the decomposition of organic matter in soil. It is known that excessive nitrogen levels can result in extreme vegetative growth and poor fruit growth in vegetable crops (Wortman, 2015). Nitrate levels were most likely high in the compost-only raised-beds because of the slow release nature of a stable organic matter reservoir (Alexander, 2001).
Phosphorus levels in the raised-bed treatments with compost only were about 3.5× higher than the other treatments (p<0.0001). The direct soil plots and raised-bed mixes were statistically similar (Table 8). Phosphorus fertilization was not needed for any soil treatment during the two years of this experiment. The raised-beds systems inherently contained high levels of phosphorus while the direct soil plots had sufficient levels. The majority of vegetables grown on mineral soils will benefit from P fertilization when soil tests are less than 35-40 ppm P (Egel et al., 2017). P-based fertilizers are often used in urban food production due to their ability to stabilize lead and reduce plant uptake (Wortman and Lovell, 2014). However, the risk of inefficient use of P-based fertilizers, especially in direct soil production systems, can lead to surface runoff and surface water pollution (Moseley et al., 2008).
A decrease in potassium levels occurred across all treatments, but it was most notable in the raised-bed treatments (p<0.01). Potassium levels in the compost-only raised-beds experienced a 69% average decrease from 2015 to 2016 (Tables 6 & 7). This severe decrease is most likely due to crop removal and/or nutrient leaching. Alfaro et al. (2004) observed higher potassium losses in clay soils compared to sand and loam soils indicating high CEC environments may impact nutrient leaching. Further, the charge of a cation as well as its hydrated radius determines its adsorption ability to a soil colloid. For example, if calcium levels are high, calcium will displace other
exchangeable cations such as magnesium and potassium due to the soil colloid’s cation selectivity (Brady and Weil, 2010).
Calcium levels (p<0.01) within each treatment did not significantly fluctuate between years (Tables 6 & 7). Despite minor losses, the raised-bed treatments
consisted of the highest calcium levels. Bullock et al. (2002) experienced similar calcium levels in treatments with compost applications over a two year study. Calcium levels did not need to be improved through fertilization during both field seasons. A calcium
deficiency is rare for most plants (White and Broadley, 2003) and no deficiencies have been observed in Illinois for soils with a pH at or above 5.5 (Ferñandez and Hoeft, 2012).
Compared to the direct soil treatments, the raised-beds consisted of the highest magnesium levels despite minor losses between 2015 and 2016 (Tables 6 & 7). Bulluck III et al. (2001) observed a doubling of magnesium levels in soils amended with organic amendments compared to the soils treated with mineral fertilizers. This suggests that the organic matter applied via compost functions as a reservoir of macronutrients.
Magnesium does not leach easily from the soil due to its ability to remain bound to the surface of clay and organic matter particles (Schulte, 2004). Fertilization was not required due to sufficient magnesium levels within all soil treatments.
Overall, a similar trend for sulfur occurred with the highest loss seen in the compost-only raised-beds (p<0.01). However, these treatments also began with the highest levels of sulfate-S. Sulfates are the crop available form of sulfur and are subject to leaching due to its negative charge. Further, adsorption of sulfate is negligible at pH >6.5 which promotes leaching (Ajwa and Tabatabai, 1995). Sulfur levels were sufficient across all soil treatments and fertilization was not necessary. Soils low in organic matter (<2.5%) may face deficiencies because organic matter is the primary source of sulfur (Ferñandez and Hoeft, 2012).
Overall, sodium levels (p<0.0001) were highest in the raised-bed treatments (Tables 6 & 7). In general, the direct soil plots were lower in sodium, however, the direct soil + synthetic fertilizer treatment was statistically similar to the raised-beds.
Commercial composts tend to contain great amounts of soluble salts where excessive amounts can occur through repeated compost applications. High levels of soluble salts are known to stunt or kill salt sensitive crop species (Alexander, 2001); thus, salt
content of the compost source should be analyzed prior to installing compost-based raised beds.
Bulk Density
Bulk density was greatest in the direct soil + synthetic fertilizer treatment and the direct soil + organic amendments treatment was statistically similar (p<0.0001) to the
mixed raised-bed treatments (Table 9). Data suggest the addition of compost to the direct soil + organic amendments treatment provided physical improvements to a depth of three inches allowing for a lower bulk density. Beniston et al. 2014 reported similar results where the addition or presence of organic matter reduced compaction within the upper soil surface. However, bulk densities below 10 cm were not improved within the two-year study suggesting further management practices to enhance growing conditions in the subsoil (Beniston et al., 2014). Appropriate over crop management practices have the ability to alleviate soil compaction. Regardless of tillage practices, Williams and Weil (2004) observed higher soybeans yields following a forage radish + rye cover crop combination than no use of cover crops suggesting the cover crop root system improved the soil physical properties for crop growth.
The compost-only raised-beds were statistically similar and consisted of the lowest bulk densities (p<0.0001) (Table 9). Low bulk densities can be attributed to soil aggregate stability. Cogger (2005) defines soil aggregation as the binding of sand, silt, and clay particles into larger units known as peds. The particle aggregation in compost media potentially plays a role in improving the soil structure which in return lowers soil bulk density in the compost-only treatments. The soil porosity data supports this trend in which soil porosity is inversely related to bulk density (Arriaga et al., 2017). The
compost-only raised-bed treatments were statistically similar and consisted of the highest porosity percentages (<0.0001) (Table 9). The lowest percentage was seen in the direct soil + synthetic fertilizer treatment because the total pore volume within the soil becomes reduced as the percentage of micropores increases (Sharenbroch et al., 2004).
In general, gravimetric water content (p<0.0001) was highest in compost-only raised-beds and lowest in the direct soil plots (Table 9). Weather conditions and irrigation schedules potentially had an impact on gravimetric water content data due to varying soil textures and water holding capacity of the soil substrates. Soils with high organic matter content have high water holding capacities due to soil aggregation and pore space distribution (Saxton and Rawls, 2006). Despite having similar water holding capacity characteristics to organic matter, soils high in clay hold water more tightly within micropores and is often unavailable for plant uptake (Brady and Weil, 2010). Urban growers should expect irrigation scheduling to differ among soil media types due to texture variations. Compost-only containing media may have a high water holding capacity, but soil surface conditions may be more susceptible to moisture swings and can require more frequent irrigation than soil media containing top soil.
Soil Moisture
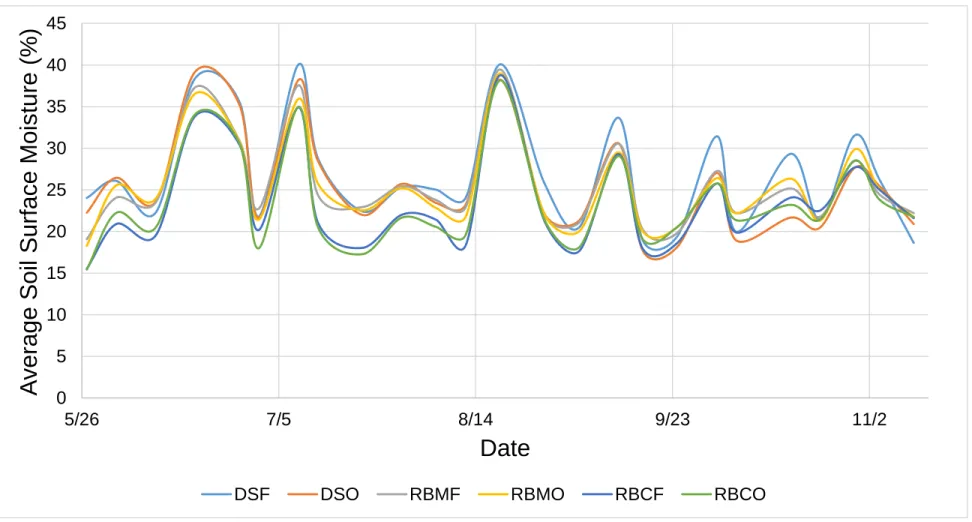
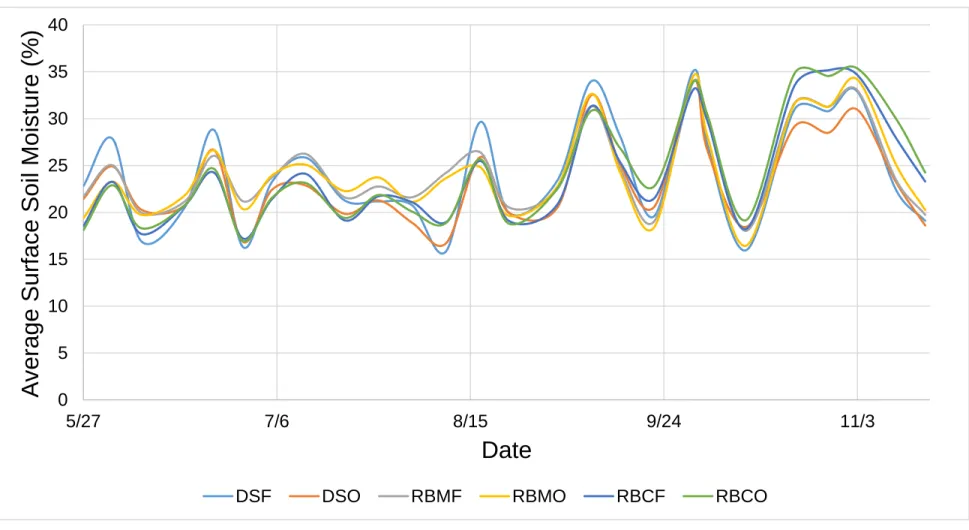
For surface soil moisture (p<0.0001), there were significant time and treatment interactions for both years (Fig. 2 & 3). In 2015, the direct soil + synthetic fertilizer
treatment on average had the highest surface soil moisture percentages (Table 10). The direct soil + organic amendments treatment and raised-bed mixes were statistically similar. Further, the compost-only raised-beds were statistically similar. In 2016, surface soil moisture was statistically similar across all treatments except direct soil + organic amendments, which on average had the lowest surface soil moisture (Table 10). Factors influencing surface moisture levels include soil structure and temperature, bulk density, organic matter content, and crop uptake. Differences between surface soil moisture levels can also be attributed to irrigation and rainfall events. Organic matter
and fine textured soils have high water holding capacities, however, water absorbed by organic matter is readily available for plant uptake compared to soils with a high clay content (Brady and Weil, 2010). Surface moisture by volume was lower in the compost-only treatments; thus, urban growers might expect to irrigate more frequently to avoid reduced seedling germination or crop water stress.
For subsurface tensiometer readings (p<0.0001), there was a significant effect of the interaction of time and soil management treatment (Fig. 4 & 5). In 2015, the direct soil + organic amendments treatment resulted in the highest tensiometer readings followed by the raised-bed mixture + organic amendments treatment, which was similar to the other raised-bed treatments except raised-bed compost-only + synthetic fertilizer (Table 11). The direct soil + synthetic fertilizer treatment had the lowest matric potential readings and was similar to the raised-bed compost-only + synthetic fertilizer treatment. In 2016, a similar trend was seen for the direct soil + organic amendment treatment, which resulted in the highest readings (Table 11). The direct soil + organic amendments treatment is statistically similar to raised-bed mixture + organic amendments treatment and raised-bed compost-only + synthetic fertilizer treatment. The raised-bed treatments were statistically similar except for RBMF. The lowest readings were in the direct soil + synthetic fertilizer treatment. It is possible for the direct soil + organic amendments treatment to reflect high moisture tension readings due to the incorporation of compost into the top 5 -10 cm of top soil. Soil porosity and surface area influences soil water holding capacity. The water holding capacity at a lower moisture tension is controlled by porosity, whereas higher moisture tensions are influenced by surface area (Cogger, 2005). The low matric potential readings in the direct soil + synthetic fertilizer treatment
could be attributed to pore size and continuity within the soil. Small pore size potentially slowed percolation and infiltration further into the soil profile, which was reflected in the low matric potential readings.
Water Infiltration
The highest water infiltration rates were present in the compost-only raised-bed treatments (p<0.0001). The raised-bed mixes and direct soil + organic amendments treatment were statistically similar and had moderate water infiltration rates (Table 9). The raised-bed mixture + synthetic fertilizer treatment was similar to the direct soil + synthetic fertilizer treatment which exhibited the lowest water infiltration rate. The large standard error accounts for the significant decrease in bulk density levels in the direct soil plots in 2016. Moisture movement throughout the soil profile is impacted by porosity and bulk density (Agnew and Leonard, 2003). Pit et al. (1999) observed increases in water infiltration rates and other soil physical properties due to compost applications. High water infiltration rates are desirable in urban food production to reduce storm water runoff. However, potential nutrient movement may occur at the base of a raised-bed. Further, site location may influence an urban agricultural system susceptibility to contaminated runoff due to nearby roads, parking lots, or industrial sites (Choe et al., 2002).
Soil Microbial Activity
Lignin induced microbial activity did not differ across all soil treatments (Table 12). Marschner et al. (2003) reported similar findings where long-term inorganic or organic treatments did not differ in fungal biomass. In general, microbial activity induced
by the glucose substrate was statistically similar except for the direct soil + synthetic fertilizer and raised-bed mixture + organic amendments treatments, where the direct soil + synthetic fertilizer treatment showed higher relative activity levels than the raised-bed mixture + organic amendments treatment (p<0.05)(Table 12). Multiple environmental factors including season, soil type, and management practices such as cover cropping significantly influence microbial activities (Schutter et al., 2001). Atiyeh et al. (2000) showed horticultural potting mixtures of marigold and tomato seedlings amended with pig and food vermicompost had significantly greater cumulative microbial activity
compared to the other treatments. Soil particle size also impacts microbial biomass and structure. Sessitsch et al. 2001 observed smaller size particle fractions (e.g. silt)
consisted of higher diversities of microbes than larger size particle. Thus, the larger particle size and reduced surface area of compost compared to clay soil may have reduced microbial activity in compost-based raised beds on a volumetric basis. Conclusion
In this study, the raised-bed systems contained the greatest nutrient levels and organic matter contents compared to the direct soil + synthetic fertilizer treatment. Compost and other organic amendment’s ability to retain high levels of nutrients is a benefit to urban growers because the need to fertilize decreases. Overall, the bulk density levels and infiltration rates in the raised-bed treatments were lower than the direct soil + synthetic fertilizer treatment. These results suggest the addition of organic amendments greatly improves soil structure and porosity, soil physical properties that often need to be altered in urban environments in order to successfully grow crops. Microbial activity was highest in the direct soil + synthetic fertilizer treatment, but this
result was likely driven by drastic differences in soil texture among management systems. Nonetheless, enhancing microbial activity in cropping systems is critical because nutrient cycling and decomposition processes can become improved. Based on evidence in this study, growers using a compost-only media should expect to irrigate more frequently than if native soil is used for crop production due to drier surface soil conditions. It is important to note that the raised bed-mix treatments had greater surface soil moisture, which could be beneficial for early crop establishment. Implementing management practices like residue covers or mulches can assist in preventing soil moisture loss through evaporation, which is particularly important for horticultural crops with shallow roots. Overall, results from this study suggest raised bed systems offer the best environmental conditions for productive crop growth. However, this experiment would need to continue to ultimately determine the long-term benefits of the soil management systems.
CHAPTER TWO
The long-term effects of urban soil management systems on crop yield and weed emergence
Introduction
Urban agriculture, the production of food where it is consumed in a city, has the potential to alleviate food insecurity. Approximately 15% to 20% of the world’s food is provided through urban agriculture (FAO, 2014; Lorenz, 2015). However, due to several definitions of urban agriculture, it is difficult to estimate its scale and yield contributions (CoDyre et al., 2015; Lorenz, 2015). Yield estimates tend to vary depending on the horticultural species and management techniques used. Compared to traditional cash crops (e.g. corn and soybean), horticultural crops have greater yield potential and can provide up to 50 kg of fresh produce per m2 per year (Drescher, 2004). Biointensive methods, management techniques to improve soil quality and high yields (Gittleman et al., 2012), include diverse crop rotations (Stockdale et al., 2001), and applying compost (Maynard, 2005). However, due to a variety of environmental concerns, urban growers are increasingly interested in the use of raised-bed production systems.
Two environmental challenges that threaten the production of urban food crops are soil degradation and weed competition, and both may be at least partially addressed through the construction of raised-bed systems. Temporary (i.e. frameless) and
permanent (i.e. walled) raised bed systems are popular in urban food production.
Temporary raised-bed systems lack a framework to hold the soil media, which may be a desirable benefit to growers who cannot afford the cost of building materials. Further,
these systems tend to be less labor intensive (Cudnik, 2004). However, reconstruction of the beds will be required if soil erosion is to occur. A permanent raised-bed system is placed on top of the native soil where a framework is constructed and filled with soil or mixtures of media (Cudnik, 2004). Soil media types commonly utilized in raised-bed systems contain mixtures of top soil and compost or solely compost. Not only do these soil management practices provide a barrier between degraded soil and the crops, they also play a role in weed suppression.
Weed management is another widespread challenge faced in urban cropping systems. Weedy species are introduced into urban areas by both natural means (e.g. wind and animals), and by human activity such as the use of contaminated plant and soil materials (Janik and Stearns, 1987). Raised-beds and composts are often used to create a growing environment that is relatively weed free. In general, there are a low number of weed seeds in compost compared to mineral soils due to the thermophilic decomposition stage of composting (Grundy et al., 1998). Research by Wiese et al. (1998) on weed seed viability showed that all species except field bindweed were killed within a three-day composting process at a temperature of 72 ⁰C or higher. Even if some weed seeds persist after the composting process, the number is still low compared to an average field soil (Grundy et al., 1998).
Agricultural management systems have the ability to influence weed community composition. Menalled et al. (2001) research on different agricultural systems over a six-year period showed the conventional systems with the lowest species density and diversity and the organic systems with the highest. Over time, the number of weed seeds within the organic system declined while seedling emergence and species
density increased in the conventional systems. McCloskey et al. (1996) saw similar results where the plowed treatments had a lower total weed density but a greater range of species compared to the tillage treatments. It is critical for growers to be aware that the source of top soil to be used in raised-bed systems can greatly influence weed pressure due to its land use and management history.
Compost is often used as a soil amendment to improve the growing environment in cropping systems. The compost feedstock or base materials are often derived from organic materials such as yard and plant wastes, spent mushroom compost, municipal solid waste, and compost wood wastes (Maher et al., 2008). Growers within urban environments have access to abundant organic waste materials that can become composted and utilized in raised bed cultivation (Beniston and Lal, 2012). A significant benefit of adding compost into a cropping system is its potential to increase crop yields. Maynard (2005) showed the ability of leaf compost to increase the yields of carrot (up to 46 percent) and beet (up to 149 percent) in compost-amended plots compared to non-amended control plots. However, other studies have shown the addition of compost had no effect on crop yields. For example, Manzuela and Urrestarazu (2009) showed the addition of vegetable waste compost did not affect melon crop yields. Potential factors influencing yield responses could be varying compost feed stock and maturity, rates and application method, and even crop species (Roe, 1998). A meta-analysis conducted by Wortman et al. (2017) developed a global estimate of first-season crop yield responses to organic amendments. By taking into account the effect of crop type, amendment characteristics, and soil properties on yield response, crop yield increased by an average of 43±7% within the first field season follow organic amendment application.
The goal of this study was to determine the long-term effects of six soil
management systems on the yield of six horticultural crops and weed abundance over a two-year period. We hypothesized that the raised-bed systems, with their expected associated benefits (e.g. improved soil quality), would provide ideal growing conditions compared to the conventionally managed direct soil system.
Materials and Methods
Field experiments were conducted in 2015 and 2016 at the University of Illinois Sustainable Student Farm in Urbana, IL (40⁰4’56.63”N 88⁰12’40.39W). The dominant soil texture at this location is silt loam. Cropping history before the assembly of the research plots involved corn (Zea mays) and soybean (Gylcine max) production for the previous three growing seasons.
Twenty-four research plots were arranged in a randomized complete block design with a total of six treatments and four replicates. The soil management treatments included: 1) direct soil + synthetic fertilizer (DSF), 2) direct soil + organic amendments (DSO), 3) raised-bed mixture + synthetic fertilizer (RBMF), 4) raised-bed mixture + organic amendments (RBMO), 5) raised-bed compost-only + synthetic fertilizer (RBCF), and 6) raised-bed compost-only + organic amendments (RBCO). Generally, soil management treatments were created to test differences between organic and conventional crop management in direct soil or raised-bed systems of variable composition.
The experimental units were 1.5 m2 permanent structures where an 8.89 cm wooden lip was installed for the direct soil plots and the raised-beds were filled with approximately
0.65 m3 of the appropriate soil media (Table 1). The direct soil + organic amendments treatment received a 0.002 m3 application of municipal compost which was incorporated into the native top soil. The topsoil and mushroom compost was sourced from Country Arbors Nursery in Urbana, IL and the leaf compost was purchased from the Landscape Recycling Center in Urbana, IL. An initial soil chemical analysis of the soil and compost substrates can be found in Table 2.
A total of five crops were grown in rotation including cilantro (Coriandrum sativum
var. Calypso), kale (Brassica oleracea var. Toscano), garlic (Allium sativum var. Music (2015); German Red (2016)), organic sweet pepper (Capsicum annuum var. Lunchbox Red), and radish (Raphanus sativus var. Red Meat). Seeding rates were adjusted to ensure germination. The experimental units were divided into four 0.19 m2 quadrants. Crops were rotated clockwise one quadrant within a plot each year (Fig. 1). Crop rotation treatments can be found in Table 3. All crops except for kale and pepper were direct seeded by hand. Kale and pepper plants were transplanted on appropriate planting dates (Table 4). Organic soybean (Glycine max) and hairy vetch (Vicia villosa) cover crop seeds were planted in the organic management treatments (DSO, RBMO, and RBCO) and followed garlic and pepper, respectively. (Table 3). Cilantro, and soybean crop residue, and hairy vetch green manure were incorporated into the soil using a hand trowel during termination. All other crop resides were removed from the experimental plots, with the exception of the pepper and kale roots.
Experimental plots were irrigated using drip irrigation (Indiana Irrigation Co., Onward, IN, USA; DripWorks, Willits, CA, USA). Two emitter lines were used per plot in 2015. Due to inefficient water coverage in 2015, three emitter lines were installed in
2016. The spacing between the emitter holes in the emitter line was 15.24 cm for a total of eight emitters per line. Surface soil moisture readings were used in conjunction with tensiometer readings to determine irrigation schedules. In 2015, the direct soil plots and all raised-beds received a total of 7069 and 6820 gallons of irrigation water,
respectively. In 2016, the direct soil plots, raised-bed mixes, and compost raised-beds received 4359, 3698, and 5299 gallons of irrigation water, respectively.
Soil sampling was performed using JMC soil probes consisting of a 1.9 cm bore (Clements Associates Inc., Newton, IA, USA) and an AMS soil probe consisting of a 2.54 cm bore (AMS Inc., American Falls, ID. USA). Soil sampling occurred two times per season at pre-plant (spring) and post-harvest (fall) for chemical analysis. Two cores per quadrant were collected at a depth of 20 cm for a total of eight cores per plot.
Samples were sent to Ward Laboratories in Kearney, NE and analyzed for soil pH, organic matter, cation exchange capacity (CEC) total nitrogen, NO3-N, P, K, Ca, Mg, SO4-S, and Na. Additional soil samples were collected prior to planting radish to determine nitrogen fertilizer needs. Two cores per radish quadrant were collected to a depth of 20 cm, aggregated, and analyzed for nitrate and ammonium (Ward
Laboratories, Kearney, NE, USA). Fertilization rates were calculated by averaging total N value per treatment (Table 5). The N critical threshold for leafy crops (cilantro, kale, garlic, and radish) was based on 50 lbs N/acre and 100 lbs N/acre for fruiting crops (pepper).
Due to pest damage, pesticide applications occurred when appropriate for the kale plants. Pepper plants were sprayed in 2015 with a fungicide due the presence of disease which was confirmed as Bacterial Canker (Clavibacter michiganensis
michiganensis) in 2016. A summary of pesticide and fungicide application information can be found in Table 13.
Data collected
All crops (excluding cover crops) were harvested by hand or by using harvesting knives. Each harvest was separated by marketable and non-marketable yield and counted. Fresh weights were recorded and reported in grams.
Leaf area measurements were collected for kale using a LI-3100 area meter (Li-Cor, Inc., Lincoln, Nebraska, USA). Three kale leaf subsamples were collected per plot once every field season and measured.
Weed emergence was measured within a 0.09 m2 quadrat located in the center of each plot every two weeks. Grasses and broadleaves were counted within the quadrat and recorded. After counting, all weeds within the quadrat and the plot were removed by hand or with a hand trowel.
Analysis of variance (ANOVA) was performed using the GLIMMIX procedure in SAS (v9.4, SAS Institute, Cary, NC, USA). Soil management treatment was treated as a fixed effect. Replication and year were treated as random effects unless there was a significant treatment interaction with year in preliminary analyses, in which case, year was treated as a fixed effect. Repeated measures analysis was used for weed
emergence and time was a random effect. The Tukey-Kramer multiple comparisons test was used to determine the differences among least squares means at significance level of α=0.05.
Results and Discussion
Crop Yield Garlic
Garlic yields (p>0.05) were similar across all soil treatments (Table 14). Similarly, Filippini et al. (2012) did not observe garlic yield differences at an organic amendment application rate of 4 Mg ha-1. However, Argüello et al. (2006) showed a significant increase in bulb fresh weight in experimental plots amended with vermicompost
compared to the unamended control. Despite having no treatment differences, a factor that may impact bulb growth of hardneck garlic varieties includes scape removal.
Orlowski et al. (1994) and Rosen and Tong (2001) showed the removal of garlic scapes before harvest had a significant effect on garlic bulb production. A 15% increase in bulb yield and size occurred due to the removal of scapes in a low organic matter site
relative to a 5% increase observed in the high organic matter site (Rosen and Tong, 2001). Decay and rot of garlic bulb in soil reduced marketable yield, particularly in 2015 due to numerous rainfall events.
Pepper
In general, the highest pepper yields (p<0.01) were observed in the direct soil plots in 2015 (Table 14). The direct soil + synthetic fertilizer treatment consisted of the highest yields overall and the direct soil + organic amendments treatment was similar to the raised-bed soil treatments. In 2016, the direct soil + organic amendments treatment yielded the most followed by the raised-bed mixture + synthetic fertilizer treatment. The raised-bed compost-only + synthetic fertilizer treatment produced the lowest yields in
both years (Table 14). Soil nitrogen levels may have influenced the proportion of vegetative to reproductive growth of pepper plants. Wortman (2015) observed only a minor increase in pepper yields in a high nitrogen treatment relative to the low nitrogen treatment due to excessive vegetative growth. Similar observations occurred in both years of this experiment where, for example, pepper plants in the raised-bed compost-only + synthetic fertilizer and raised-bed mixture + organic amendments treatments either did not produce fruit or only produced fruit in the beginning of the field season. Pest damage and disease incidence are additional factors that potentially impacted pepper yield.
Radish
Years were analyzed separately because of missing data for the direct soil plots in 2016 (Table 14). The raised-bed treatments produced higher yields than the direct soil plots in 2015 with the raised-bed compost-only + organic amendments treatment having the highest yield (p<0.0001). In 2016, total radish yields were similar across all soil treatments (p>0.05) with the exception of the direct soil plots. No data were
collected for the direct soil plots due to poor emergence or absence of germination. Total radish yields were 2-3× lower in 2016 and the highest yield was observed in the raised-bed compost-only + synthetic fertilizer treatment. Maynard (2005) showed a yield increase of carrot (up to 46 percent) and beet (up to 149 percent) in leaf
compost-amended plots compared to uncompost-amended control plots. Findings from Wortman et al. (2017) revealed greater yield responses to organic amendment application for leafy vegetable crops compared to root, tuber and bulb crops where yield gains were more moderate. Despite the direct soil plots being statistically significant in 2015, the
compost-amended treatment (direct soil + organic amendments) yields were 9× greater, suggesting organic amendments have the ability to increase crop yields. Further, the improved soil physical quality of the direct soil + organic amendments treatment, due to the addition of compost, may have influenced radish yields.
Cilantro
The compost-only raised-bed treatments produced the greatest cilantro yields (p<0.0001). The direct soil plots plus the raised-bed mixes were statistically similar (Table 15). Leafy vegetable crops and herbs tend to be more responsive to increasing fertility than fruiting, cereal and bulb crops (Wortman et al., 2017). Vadiraj et al. (1998) saw a significant increase in cilantro yield with the application of vermicompost at 15-20 t/ha compared to an unamended control. Yields were also comparable to the chemical fertilization treatment suggesting compost-based organic amendments can serve as an alternative nutrient source for cilantro production (Vadiraj et al., 1998).
Kale and Leaf Area
In general, there was a significant yield decrease from 2015 to 2016 (p<0.0001) (Table 15). The raised-bed treatments were similar and produced greater yields than the direct soil plots in 2015 and 2016. The highest total kale yield in 2015 was observed in the raised-bed compost-only + organic amendments treatment while the highest yielding treatment in 2016 was raised-bed mixture + organic amendments treatment. Wortman (2015) observed similar results in which kale yields were greatest in the high fertility treatment (ideal hydroponic fertility treatment). Kale leaf area data measured during both field seasons support kale biomass fresh weights seen within the raised-bed
systems. Overall, leaf area values were larger in the raised-bed treatments than the direct soil plots even with a significant decrease in leaf area between 2015 and 2016 (Table 16). In 2015, the largest leaf area values were observed in the compost-only raised-bed treatments while the direct soil plots displayed the smallest leaf areas. In 2016, the raised-bed mix treatments consisted of the largest leaf area values and the direct soil plots experienced a similar trend to the one observed in 2015. Similarly, Tavarini et al. (2011) observed a significant increase of leaf lettuce fresh weight in treatments amended with green compost.
Weed Emergence
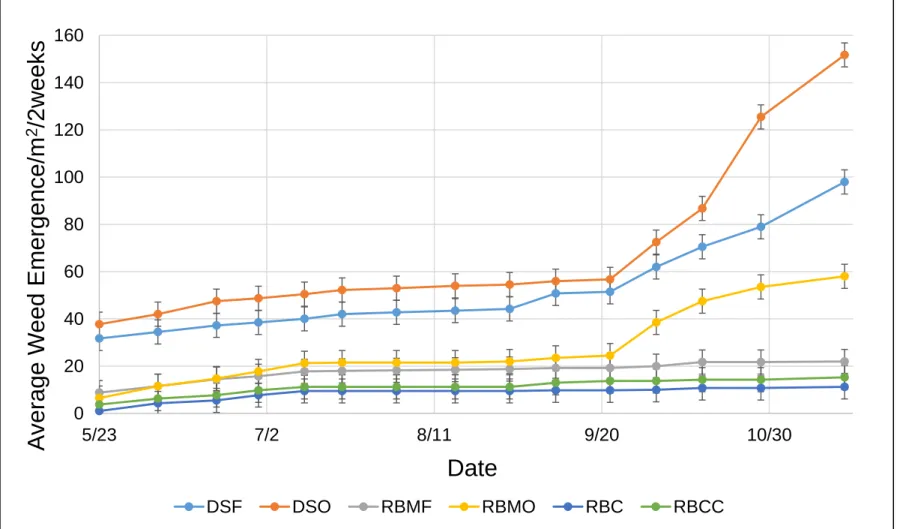
In general, weed populations increased between 2015 and 2016. Broadleaf emergence dominated the direct soil plots each year and the largest broadleaf
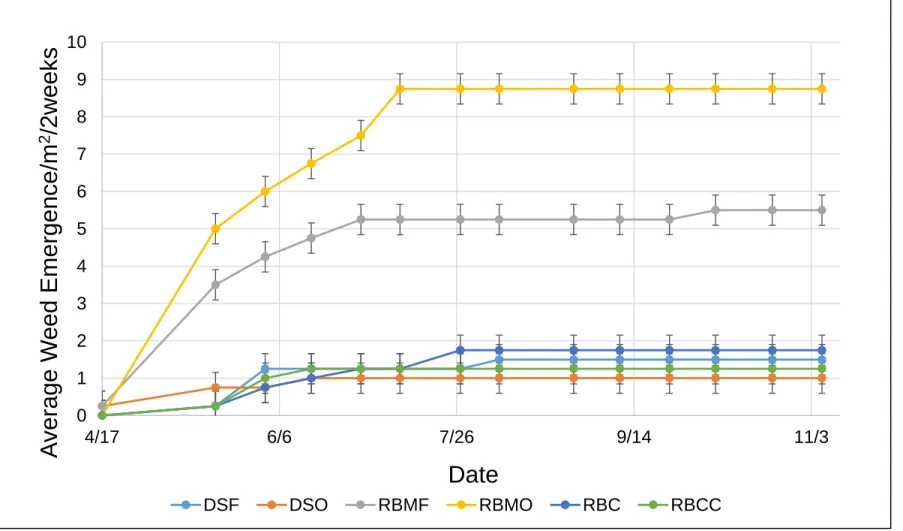
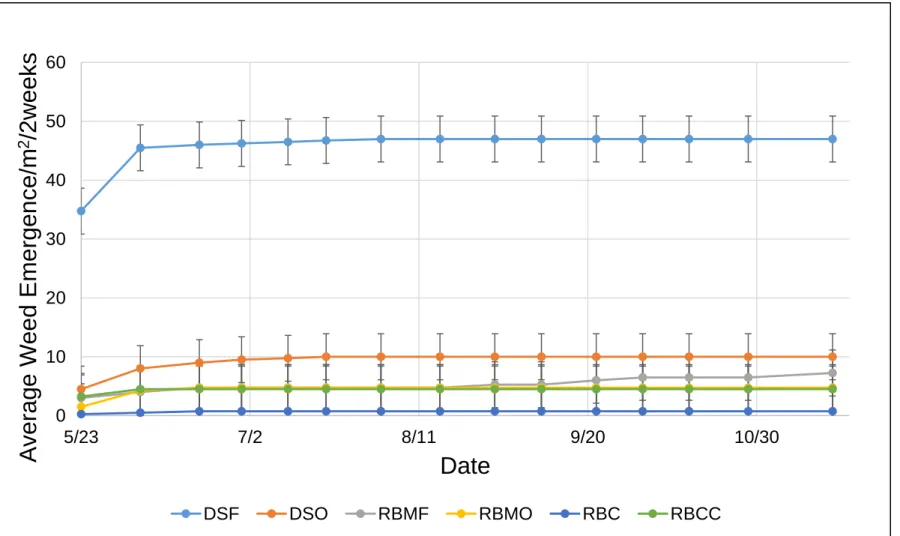
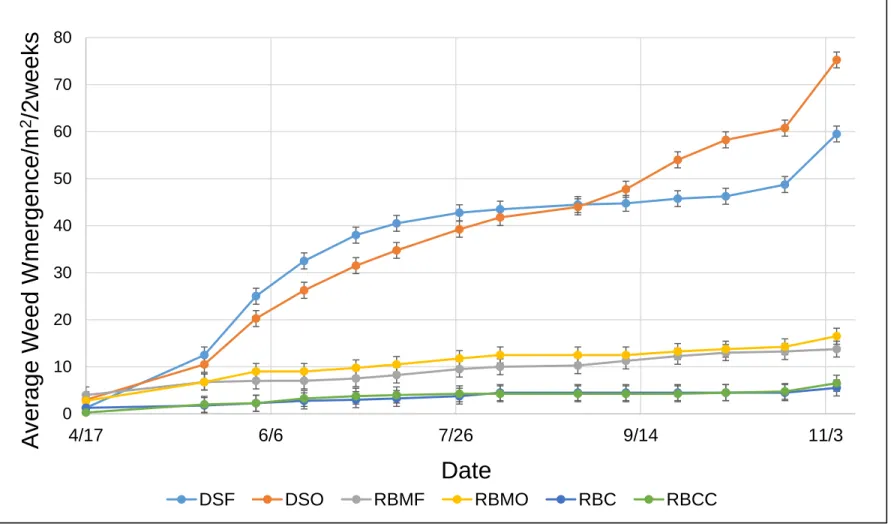
populations were observed in the direct soil + organic amendments treatment for both field seasons (Table 17). Further, weed emergence was insignificant in the compost-only raised-beds. Despite low populations in 2015, grasses were most prevalent in the raised-bed mix treatments (p=0.0002). In 2016, grass emergence was greatest in the direct soil + synthetic fertilizer treatment (p>0.05) (Table 18). De Cauwer et al. (2010) observed similar results where the total weed seed bank density was lowest in the plots amended with food waste and garden compost compared to cattle slurry and mineral N treatments. The largest flush of grass emergence for the direct soil treatments occurred at the beginning of the growing season (Fig. 6). This flush was most notable in 2016 (p<0.05) (Fig. 7). Further, broadleaf emergence increased throughout the 2015 (p=0.0047) (Fig. 8) and 2016 (Fig. 9) seasons. The raised bed mix treatments
season (Fig. 6). Overall, broadleaf emergence within both raised bed treatments was minimal and remain constant throughout the 2015 (Fig. 8) and 2016 (Fig. 9) seasons. If urban growers devote time to hand-weeding in the first 6-8 weeks of the growing
season, managing weed emergence in the last couple months of the season will improve. Weed population shifts are usually not seen within the first season under organic management (Ngouajio and McGiffen, Jr., 2002). Continuation of this experiment would potentially show a weed density shift in the direct soil + organic amendments treatment. Further, the addition of organic matter may have benefited weed germination by providing a source of plant-available nitrogen (i.e. nitrate) to stimulate weed growth. Results from this study suggest urban growers should utilize organic amendments in their cropping systems to suppress weed growth. Further, growers can alter their management techniques to include cover crops which have the ability to reduce weed seed germination (Hutchinson and McGiffen, Jr., 2000).
Conclusion
In general, raised-bed management increased yield for kale, radish, and cilantro, but not garlic. In contrast, pepper yield was generally greater in direct soil systems compared to raised-beds. The varying nutrient availability of the soil media and amendments used, combined with crop nutrient demands may explain these species-specific yield responses. Growers should consider which crop species to use before selecting a soil management system to ensure optimal yields. Once crop species are selected, growers can design systems with management zones for groups of plants benefitting from different soil conditions. Also, due to poor germination of some
direct-seeded crops, it is important to note that sufficient soil moisture levels are critical for ensuring successful crop establishment after planting.
Broadleaf weeds were most prevalent in the direct soil plots for both field seasons, and grass populations were generally low with the exception of the direct soil + synthetic fertilizer treatment. Also, weed emergence was negligible in the compost-only raised-bed treatments which is a desirable agronomic benefit to growers. However, weed contamination can still occur due to improper composting procedures or wind dispersal of weed seeds. As a result, urban growers should be wary of purchasing soil media without first checking the overall quality.
TABLES AND FIGURES
Table 1: Summary of soil treatment components. The use of organic amendments in the DSO, RBMO, and RBCO treatments included compost applications (if needed) and cover crops.
Soil Treatments
DSF Direct soil + synthetic fertilizers
DSO Direct soil + organic amendments [2-3’ initial application of municipal compost]
RBMF Raised-bed soil/compost mix + synthetic fertilizer [4 top soil mix : 3 munic. compost : 1 mush. compost] RBMO Raised-bed soil/compost mix + organic amendments [4 top soil mix : 3 munic. compost : 1 mush. compost] RBCF Raised-bed compost + synthetic fertilizer [3 munic. compost : 1 mush. compost]
RBCO Raised-bed compost + organic amendments [3 munic. compost : 1 mush. compost]
Table 2: Summary of initial soil chemical characteristics of each soil media component before creating appropriate soil treatments. All nutrients are presented as ppm and CEC is presented as meq/100 g. Further, organic matter content is expressed as a percentage.
Soil Chemical Characteristics Soil Media Texture Sand
% Silt % Clay % pH CEC OMC NO3-N Total N P K Ca Mg SO4-S Na Municipal Compost Sandy Loam 55 30 15 7.8 34.2 28.6 70.8 12919 215 1453 4339 1020 82 60 Mushroom Compost Sandy Loam 68 19 13 7.7 37.7 36.1 0.1 13491 28 2180 5145 649 389 227 Topsoil Clay Loam 23 48 29 5.8 20.7 3.8 9.3 1809 15 135 2752 504 12 10
Table 3: Summary of crop rotation treatments for both field seasons. Spinach data was omitted from thesis due to poor germination or overall growth.
2015 & 2016 Rotation Treatments
1 Lunch box pepper (followed by winter legume cover crop in DSO, RBMO, and RBCO treatments) 2 Kale followed by Radish
3 Cilantro followed by Garlic
4 Garlic (followed by spinach in DSF, RBMF, and RBCF treatments or soybean cover crop in DSO, RBMO, and RBCO treatments
Table 4: Summary of crop species and planting guidelines for both field seasons. Seeding rate is expressed as seeds per meter row.
Crop Species Seeding
Rate Plant Date Harvest Date
Cilantro 394 Mid-May Early-July
Garlic 33 Early-Oct Late-July
Kale 10 Late-April Late-July
Sweet Pepper 10 Mid-June Early-Sept
Radish 39 Mid-Aug Mid-Oct
Soybean 79 Early Aug .
Table 5: Summary of nitrogen fertilization characteristics for the 2015 and 2016 field season. Topdressing applications occurred for all fertilizers and were immediately incorporated.
Year Treatment Crop Application
Rate Fertilizer Type
2015 DSF -z 18.1 g Urea
Radish 2.2 g Urea
DSO Radish 416 g Vermicompost (wet)
2016 DSF Cilantro 3.4 g Urea
Kale 3.4 g Urea
Garlic 3.4 g Urea
Pepper 6.8 g Urea
Radish 1.9 g Urea
DSO Cilantro 175.5 g Turkey Compost (wet) Kale 175.5 g Turkey Compost (wet) Garlic 175.5 g Turkey Compost (wet) Pepper 351.5 g Turkey Compost (wet)
RBMF Cilantro 0.8 g Ureay
Kale 0.8 g Ureay
Garlic 0.8 g Ureay
Pepper 1.5 g Ureay
z Fertilizer was applied to the entire research plot y Fertilizer was applied in split applications
Table 6: Soil chemical data with significant treatment by year interactions using repeated measures analysis for 2015. Different Tukey-Kramer groupings indicate differences among treatments. All nutrients are presented as ppm and CEC is presented as meq/100 g. Further, organic matter content is expressed as a percentage.
2015 Soil Chemical Characteristics
Soil Treatment pH OMC NO3-N K S Ca Mg
DSF 7.5 d 3.5 d 6.7 d 257.3 c 9.7 d 2406.1 d 258.6 d DSO 7.6 c 5.2 c 11.6 d 396.6 b 16.3 c 2877.3 c 397.9 c RBMF 7.7 bc 11.5 b 26.7 c 332.5 bc 31.7 b 4095.5 b 755.6 b RBMO 7.8 abc 12.0 b 32.2 c 374.1 b 33.5 b 4405.5 ab 822 ab RBCF 7.9 a 20.1 a 44.8 b 637.3 a 54.3 a 4534.6 a 870.9 a RBCO 7.8 ab 19.8 a 58.5 a 693.4 a 67.0 a 4495.1 ab 890 a SE 0.03 -* 2.1 22.9 -* 92.9 19.8
*Denotes missing standard error due to data transformation
Table 7: Soil chemical data with significant treatment and time interactions using repeated measures analysis for 2016. Different Tukey-Kramer groupings indicate differences among treatments. All nutrients are presented as ppm and organic matter content is expressed as a percentage.
2016 Soil Chemical Characteristics
Soil Treatment pH OMC NO3-N K S Ca Mg
DSF 7.7 b 3.3 d 7.5 d 207.5 b 7.7 d 2358.5 d 303.4 d DSO 7.7 b 5.0 c 15.5 cd 293.1 a 13.6 c 2825.3 c 425.1 c RBMF 7.9 a 9.7 b 18.3 bc 191.8 b 23.1 b 3827.1 b 708.9 b RBMO 7.9 a 10.5 b 26.7 b 204 b 23.9 b 3884.4 b 735.6 ab RBCF 7.8 a 28.3 a 41.9 a 185.5 b 32.1 a 4384.4 a 771.8 ab RBCO 7.8 a 28.0 a 48.9 a 219.8 b 32.4 a 4538.8 a 813.8 a SE 0.03 -* 2.1 10.4 -* 64.7 19.3
Table 8: Pooled soil chemical data with year treated as a random effect. Different Tukey-Kramer groupings indicate differences among treatments. All nutrients are presented as ppm and CEC is presented as meq/100 g.
Soil Chemical Characteristics Soil
Treatment Na CEC P Total N
DSF 51.5 b 15.1 d 141.1 b 1764 d DSO 58.3 ab 18.8 c 159.5 b 2609 c RBMF 63.2 a 26.9 c 157.9 b 4848 b RBMO 64.7 a 28.2 b 167.1 b 5247 b RBCF 64.0 a 30.5 a 347.9 a 12044 a RBCO 63.9 a 31.1 a 329.5 a 12277 a SE 9.24 0.9 12.1 367.7
Table 9: Summary of soil physical properties. Different Tukey-Kramer groupings indicate differences among treatments.
z Bulk density expressed as (g/cm3)
y Soil water content expressed as (g/g) x Soil porosity presented as a percentage w Water infiltration expressed as (mm/hr)
Soil Treatment Bulk Densityz Soil Water Contenty Soil Porosityx Water Infiltrationw DSF 1.3 a 0.15 c 0.52 c 226 c DSO 0.87 b 0.27 b 0.67 b 2017 b RBMF 0.85 b 0.19 bc 0.68 b 1520 bc RBMO 0.89 b 0.20 bc 0.67 b 1832 b RBCF 0.32 c 0.52 a 0.89 a 4596 a RBCO 0.35 c 0.49 a 0.87 a 4290 a SE 0.04 - 0.01 805.8
Table 10: Volumetric soil surface moisture expressed as a percentage. Different Tukey-Kramer groupings indicate differences among treatments.
Table 11: Tensiometer data presented in centibars (matric potential). Different Tukey-Kramer groupings indicate differences among treatments.
Table 12: Microbial activity presented as differences in pre- and post-absorbance values using glucose and lignin substrates. Different Tukey-Kramer groupings indicate
differences among treatments. Soil Treatment 2015 2016 DSF 26.8 a 24.2 a DSO 25.6 b 23.3 b RBMF 25.6 b 24.7 a RBMO 25.4 b 24.4 a RBCF 23.4 c 24.1 a RBCO 23.5 c 24.5 a SE 0.19 0.22 Soil Treatment 2015 2016 DSF 10 c 3 d DSO 18 a 10 a RBMF 12 bc 5 c RBMO 13 b 10 ab RBCF 10 c 9 ab RBCO 12 bc 9 b SE 0.6 0.9 Soil
Treatment Glucose Lignin DSF 0.30 a 0.27 a DSO 0.29 ab 0.28 a RBMF 0.27 ab 0.28 a RBMO 0.25 b 0.26 a RBCF 0.26 ab 0.28 a RBCO 0.28 ab 0.30 a SE 0.04 0.04
Table 13: Summary of pesticide and fungicide application information.
Year Crop Species Application Rate Chemical Type Total Applications
2015 Kale 3.75 ml/32 oz H2O Bt thuricide 1
Pepper 4 oz/25 gal H2O Champ WP 1
2016 Kale 3.75 ml/32 oz H2O Bt thuricide 2
Table 14: Average total yields of fruiting crops expressed as g/m2. Different Tukey-Kramer groupings indicate differences among soil treatments.
Crop Yield
Garlic Pepper Radish
Soil Treatment -z 2015 2016 2015 2016 DSF 3407 a 1771 a 1316 abc 576 c -y DSO 3827 a 1270 ab 2476 a 4594 bc -y RBMF 3391 a 945 ab 2112 ab 8146 ab 4308 a RBMO 3323 a 492 b 538 bc 8695 ab 3843 a RBCF 3245 a 452 b 458 c 7877 ab 5471 a RBCO 3148 a 918 ab 1154 abc 10433 a 3157 a SE 108.7 76.3 130.2 333.8 256.4 z Pooled data y Missing data
Table 15: Average total yields of leafy crops expressed as g/m2. Different Tukey-Kramer groupings indicate differences among soil treatments.
Cilantro Kale Soil Treatment -z 2015 2016 DSF 2137 b 4666 b 1176 bc DSO 1725 b 4276 b 931 c RBMF 2099 b 10204 a 2616 ab RMBO 2758 ab 9809 a 4658 a RBCF 37212 a 10107 a 3983 a RBCO 3622 a 11337 a 3687 a SE 259.5 198.3 -x z Pooled data
y Missing data due to no seed germination
x Denotes missing standard error due to data transformation
Table 16: Average leaf area expressed as cm2 for three subsamples of kale.
Soil Treatment 2015 2016 DSF 252.5 c 121.5 b DSO 324.6 bc 99.0 b RBMF 390.5 ab 190.3 ab RBMO 423.2 ab 299.2 a RBCF 444.9 a 153.0 b RBCO 484.4 a 179.4 ab SE 28.2 33.1
Table 17: Average number of broadleaves/m2/two weeks using repeated measures analysis.
Table 18: Average number of grasses/m2/two weeks using repeated measure analysis. Soil Treatment 2015 2016 DSF 46 a 70 ab DSO 58 a 109 a RBMF 11 b 16 bc RBMO 13 b 42 bc RBCF 4 b 9 c RBCO 5 b 11 c SE 1.7 5.1 Soil Treatment 2015 2016 DSF 1 b 33 a DSO 1 b 9 a RBMF 4 ab 6 a RBMO 7 a 3 a RBCF 1 b 1 a RBCO 1 b 3 a SE 0.41 3.9