IZA DP No. 2532
Demand for Higher Education Programs:
The Impact of the Bologna Process
Ana Rute Cardoso Miguel Portela Carla Sá Fernando Alexandre DISCUSSION P APER SERIES Forschungsinstitut zur Zukunft der Arbeit December 2006
Demand for Higher Education Programs:
The Impact of the Bologna Process
Ana Rute Cardoso
IZA and University of Minho
Miguel Portela
Tinbergen Institute, NIPE-University of Minho and IZA
Carla Sá
Tinbergen Institute and NIPE-University of Minho
Fernando Alexandre
NIPE-University of Minho
Discussion Paper No. 2532
December 2006
IZA P.O. Box 7240 53072 Bonn Germany Phone: +49-228-3894-0 Fax: +49-228-3894-180 E-mail: [email protected]Any opinions expressed here are those of the author(s) and not those of the institute. Research disseminated by IZA may include views on policy, but the institute itself takes no institutional policy positions.
The Institute for the Study of Labor (IZA) in Bonn is a local and virtual international research center and a place of communication between science, politics and business. IZA is an independent nonprofit company supported by Deutsche Post World Net. The center is associated with the University of Bonn and offers a stimulating research environment through its research networks, research support, and visitors and doctoral programs. IZA engages in (i) original and internationally competitive research in all fields of labor economics, (ii) development of policy concepts, and (iii) dissemination of research results and concepts to the interested public.
IZA Discussion Paper No. 2532 December 2006
ABSTRACT
Demand for Higher Education Programs:
The Impact of the Bologna Process
*The Bologna process aims at creating a European Higher Education Area where inter-country mobility of students and staff, as well as workers holding a degree, is facilitated. While several aspects of the process deserve wide public support, the reduction of the length of the first cycle of studies to three years, in several continental European countries where it used to last for four or five years, is less consensual. The paper checks the extent of public confidence in the restructuring of higher education currently underway, by looking at its implications on the demand for academic programs. It exploits the fact that some programs have restructured under the Bologna process and others have not, in Portugal. Precise quantification of the demand for each academic program is facilitated by the rules of access to higher education, in a nation-wide competition, where candidates must list up to six preferences of institution and program. We use regression analysis applied to count data, estimating negative binomial models. Results indicate that the programs that restructured to follow the Bologna principles were subject to higher demand than comparable programs that did not restructure, as if Bologna were understood as a quality stamp. This positive impact was reinforced if the institution was a leader, i.e. the single one in the country that restructured the program. Still an additional increase in demand was experienced by large programs that restructured to offer an integrated master degree, thus conforming to Bologna principles while not reducing the program duration.
JEL Classification: I28, I21, F15
Keywords: education policy, European Higher Education Area, economic, social and cultural integration, count data
Corresponding author: Ana Rute Cardoso IZA P.O. Box 7240 53072 Bonn Germany E-mail: [email protected]
1
Introduction
The Bologna process is a far-reaching reform, involving currently 45 countries, which aims at the creation of an European Higher Education Area by 2010. Major steps in that direction, currently underway, include the creation of a comparable structure of academic degrees, mutual recognition of diplomas and course units, the assessment of academic institutions and programs based on common quality
standards, and direct incentives to geographical mobility of students and staff.
Implementation of a common structure of academic degrees means that some
con-tinental European countries are having to move from a four- orfive-yearfirst cycle
of studies into a shorter three-year one, which led to controversy. On one hand, the advantages of having a degree recognized in a wider geographical space are praised, together with the redevelopment of curricula that makes learning more student-centered and enables entering the labor market earlier. On the other hand, distrust has been expressed over the academic contents and adequacy to labor market needs of the competencies transmitted in a shorter three-year program, with fears that the employability of graduates will be reduced, when compared to graduates of the longer cycle.
This study aims at checking the degree of public confidence in the restructuring
of thefirst cycle of higher education studies currently underway under the Bologna
process. More precisely, we concentrate on the reaction of students, to analyze the
change in demand for academic programs by candidates to thefirst cycle of higher
education, comparing programs that have already restructured to those that have not.
We take advantage,first of all, of the legal setting in Portugal, where institutions
were given the option to adjust their academic programs to the Bologna curricula starting in the academic year 2006/07, or to defer adjustment to one of the two following years. Therefore, in 2006/07 a group of early implementers coexists with a group of programs that still have not undergone change, and students are free to choose where they would like to be admitted. Secondly, the analysis is facilitated by the system of access to higher education in Portugal. Candidates must clearly rank
up to six choices of institution and academic program, and a national competition follows, run by the Ministry of Education, which allocates candidates based on their relative performance and the number of available vacancies posted by each institution for each program. Thirdly, we have a good dataset on the application process, which renders this analysis feasible.
Section 2 describes the main characteristics of the Bologna process. Section 3 explains its implementation in Portugal, clarifying how it provides good condi-tions for economic analysis, and describes the system of access to higher education. Section 4 presents the data set and section 5 describes the method and major prob-lems to be tackled. Section 6 discusses the results, before concluding comments are presented.
2
The Bologna process
The Bologna process aims at creating a European Higher Education Area, where
internal mobility of students, teachers, and administrative staffis facilitated, whose
competitiveness attracts students from outside and contributes to the broader aim of turning Europe into a leading knowledge-based society. The main pillars of the process include:
• Comparability of the degree structure, based on three cycles: the bachelor
degree (three years, according to the dominant model), the master (normally two years), and the doctorate.
• Mutual recognition of degrees, other awards, and course units. Further to a
comparable degree structure, a system of academic credits was created, whose accumulation and transferability across countries is guaranteed, enabling
mu-tual recognition of degrees, other academic qualifications, and periods of study
abroad. In the same line, a Diploma Supplement was introduced, which
de-scribes the degree and qualifications obtained, in terms of workload, level,
and learning outcomes. The overall aim is to improve transparency of higher
education degrees and to render more flexible progression into further
European higher education system.
• Assessment and accreditation of institutions and academic programs based
on shared quality standards and procedures.
• Development of mobility programs by student, teaching, research and
admin-istrative staff, including measures such as the portability of national loans
and grants.
• External dimension of the process, through exchange and cooperation with
other parts of the world (for example, Latin American and the Caribbean).
Major steps in the definition of this strategy were taken in Ministerial
Con-ferences at Sorbonne 1998, Bologna 1999, Prague 2001, Berlin 2003, and Bergen 2005.
Even though the process is far-reaching and multifaceted, much attention has been devoted to the changes in the degree structure. Indeed, according to the
model that predominated in several continental European countries, thefirst higher
education degree was obtained after four to five years of successful study.
There-fore, the curricula changes necessary to bring the first degree down to three-years
are being implemented amidst some controversy.
On one hand, the advantages of having a comparable degree structure are stressed, as the system becomes more transparent and obstacles to the mobil-ity of students and workers are reduced. However, the new curricula are often interpreted as a compressed version of the longer courses, and critics claim that
there will not be enough time for assimilation, reflection and a critical approach
to learning, which will undermine the quality of the degree. Under these circum-stances, the employability of the new graduates might be reduced, when competing
with graduates from the previous system of a longerfirst cycle. Moreover, there is
the fear that public funding will be restricted to the first (three-year) cycle, thus
imposing a higher burden on students if they want to progress beyond the first
degree, when compared to the system that used to guarantee public funding for four or five years.
The relevance attached to this issue varies across scientificfields, with the prob-lem usually not raised in the humanities, while it is highlighted in several countries for occupations regulated by professional bodies (Reichert and Tauch, 2005: 13)
and subject to specific European Union coordination mechanisms (see the case of
architecture and health sciences).
Between optimism and scepticism, it is not certain how the behavior of stu-dents and labor market agents will change during the period of adjustment to the Bologna changes in higher education curricula.
3
The Portuguese setting
3.1 Implementation of the Bologna curriculum changes
Portugal subscribed to the Bologna declaration in 1999. The process was regulated by national legislation on the quality of higher education (in 2003), on the credit
and classification systems, the Diploma Supplement, and other instruments for
geographical mobility (in 2005). Like in other continental European countries, the restructuring of the system of degrees, with the reduction of the length of the
first cycle of studies, was one of the more debated changes. In fact, the common
duration of a higher education degree used to be in Portugal five years, until
1997, when it was reduced to four years; the Bologna process further imposes a reduction to three years, translated into general national legislation in 2005 and further regulated in 2006.
There is nevertheless the possibility to keep the duration of a program longer.
Whereas the first cycle (licenciatura) has a normal duration of three years and
the second cycle (mestrado) has a normal duration of one and a half or two years,
in special cases it is feasible to offer a combined degree, the so-called integrated
master, lasting for five to six years.
Institutions could choose to start implementing the Bologna changes to the program curricula in the academic year of 2006/07 or one of the two following years.1
1Changes taking effect in 2006/07 had to be sent to the Government until March 31, 2006, and changes to take effect in 2007/08 have to be sent until November 15, 2006.
This restructuring of curricula was received with the mixture of optimism and scepticism previously highlighted in the general description of the Bologna process.
As a result, different higher education institutions adopted different strategies in
terms of the starting year chosen to adopt the new system, in a framework of increasing competition to attract students. Some saw the prompt implementation of the Bologna changes as an opportunity to establish or reinforce a reputation of
an up-to-date institution, whose graduates would benefit from the opportunities
of a wider labor market. Institutions taking the lead might gain a comparative
advantage over the late-comers, not just attracting more applicants in thefirst year
after restructuring, but also gaining a reputation beneficial for future years. Other
institutions, instead, opted to delay the process, arguing that changes should be thought over, and that the labor market would penalize the graduates from the new shorter first cycle.
For example, the Academic Senate of the University of Coimbra adopted a general rule deferring to 2007/08 the adoption of the new model (with exceptions authorized for programs on which a national consensus for change had been reached among institutions). This decision contrasted to that of Universidade Nova de Lis-boa, which moved ahead restructuring most of its programs, even before national legislation regulating the process was passed.
In this framework, with a group of institutions and programs clearly affected
by the Bologna restructuring of the first cycle of studies, and a control group,
not adopting that model, students may themselves have opted for contrasting strategies. Some may associate Bologna with a quality stamp and a guarantee of recognition of the degree in a wider geographical space, yielding better employment opportunities, whereas others may attach a higher reputation to a more established older program.
Under this setting, Portugal provides favorable conditions to test the degree of public understanding or trust in the Bologna process. In particular, candidates to a higher education degree will be the agent we consider, and their demand for university programs the precise indicator under scrutiny, contrasting programs that have adjusted to the Bologna process with those that have not yet.
This analysis is rendered feasible by the fact that admission into higher edu-cation in Portugal is strictly regulated and implemented through a nation-wide competition, where candidates must clearly state their preferences for institutions
and academic programs. Demand can thus be quantified in an unequivocal way.
3.2 Access to higher education
Public higher education comprises in Portugal the University and Polytechnic
sys-tems.2 This study concentrates on the University subsystem, given that it has a
more homogenous set of rules in the national competition to allocate students.
Enrollment in higher education is limited by a system ofnumerus clausus. The
number of vacancies is defined yearly by each institution, subject to communication
to the Ministry of Science, Technology and Higher Education.3 The application
process takes place at the centralized national level. Each candidate ranks up to six priorities, each comprising a pair institution/program. The nation-wide com-petition that follows allocates the candidates based on their grade point average and the stated ranking of preferences.
Successful completion of secondary education is a prerequisite for admission
into higher education by students younger than 23 years.4 In addition, candidates
must pass national admission exams. Definition of the number of exams, their
subjects, the minimum classification required, the weighting scheme to compute
thefinal grade point average, and the minimum grade point average required, rests
with each institution.5 In any case, the number of exams required must be one or
two, and the computation of thefinal grade point average (expressed in a scale of
0 to 200) for ranking the applicants to each institution and program must obey the following rules: the grade point average at completion of secondary school,
which takes into consideration the three final years of secondary school, must have
a weight of at least 50 percent; the specific national admission exam(s) must have
2As well as the military and police institutions.
3Who can, under special circumstances, change the proposal. For a few programs, joint approval by this Ministry and a second one is required.
425 years old, until 2005. Older candidates who do not hold a secondary school degree are subject to a different set of exams specific to each program.
5In special cases where physical, vocational or other abilities are relevant, other specific admission requirements may apply (pr´e-requisitos).
a weight of at least 35 percent.6
Certain admission exams are known to place tougher requirements on the ap-plicants. Traditionally hard subjects are: mathematics, where only 26% of the students obtained in 2006 a passing grade (27% in 2005, and 31% in 2004 and 2003); physics, where the share of students passing the exam was 30%, 47%, 37%, and 22%, respectively in 2006, 2005, 2004, and 2003; and chemistry, where those shares were, respectively, 35%, 52%, 41% and 53%.
The allocation of candidates comprises two major phases: the first one takes
place in July; the second takes place in August and includes the vacancies that
have not been filled in the first phase. Students who were not successful in the
first phase, or who were successful but wish to change the institution/program
where they were placed, and those who had not applied in the first phase (either
because they did not yet fulfill all the requirements or because, though fulfilling
the requirements, had decided not to apply), are eligible to apply in the second phase.7
4
Data set
The data used is made publicly available by the Ministry of Science, Technology and Higher Education, on a web site of the Department of Higher Education (DGES) dedicated to announce the results of the allocation of candidates to higher
education programs.8
Data for the academic years 2003/2004 until 2006/2007 have been collected. The following variables are available: overall demand for each program (total number of students listing the pair institution/program among their preferences, irrespective of its ranking), as well as the number of students who have selected
each program as their first choice, second choice and so forth (up to a maximum
6If other special requirements apply, they cannot be attached a weight larger that 15 percent.
7In the first phase, there is a small share of vacancies on which specific kinds of candidates are given pref-erence: handicapped individuals, Portuguese emigrants returning home, those under a military work contract (contingentes especiais), and those coming from specific regions (Azores or Madeira islands). In the case of Poly-technic schools, further priority is assigned to candidates living in the geographic area of influence of the school (preferˆencia regional) or those having completed specific tracks that are more work-oriented, in the secondary education (preferˆencias habilitacionais). Institutions where vacancies remain after the second phase may decide to have a third phase, run at the institution level.
of six that can be listed); number of vacancies available for each program in each of the two stages of the application process; national admission exams required by the program, with the major ones being mathematics, physics, chemistry, biology
and portuguese; the field of study of the program.9
The appendix provides descriptive statistics on the dataset.
5
Model under estimation
The dependent variable in our model is a nonnegative integer: the demand for university programs, i.e the number of candidates who choose the program. The distribution of the variable is skewed to the left. As such, an adequate tool to model the process is the count data regression analysis. Given the panel structure
of the data, we considered both the fixed effects Poisson and the negative
bino-mial regression models, to take into account the unobserved heterogeneity across academic programs.
From the descriptive statistics we learn that the dependent variable shows raw overdispersion. This indicates that the negative binomial regression model might be more appropriate for our data, since it relaxes the hypothesis of equal mean and variance, which we tested by comparing both models through a likelihood ratio test. The results indeed indicate clearly that the negative binomial model is more
appropriate and therefore we just report its results.10
The negative binomial model withfixed effects is specified as
Pr (Yit=yit|δi) = Γ(λit+yit) Γ(yit)Γ(yit+ 1) µ 1 1 +δi ¶λità δi 1 +δi !yit (1)
where yit is the count for our dependent variable for the ith group (academic
program) in period t, λit = exp(xitβ), δi is the dispersion parameter, and xit is a
vector of regressors. This specification assumes constant dispersion within groups,
equal to 1 +δi. The mean and variance ofyit are defined asδiλit and δiλit(1 +δi), 9We have consistently used the classification adopted by the Ministry in 2006, which includes ten areas: agriculture, architecture, natural sciences, law and social sciences, economics and business, sports and arts, education, humanities, health, and technologies.
respectively.11
The vector of regressorsxit, the program attributes, includes whether it requires
a national admission exam in a particular subject (dummy variables for
mathemat-ics, physmathemat-ics, chemistry, biology and portuguese) and its scientificfield (captured by
9 dummy variables, interacted with year dummy variables). We moreover control for the phase of the application process, with a dummy variable equal to one in the
second phase. Given sharp differences in the dimension of the different programs
and across different institutions, we must also control for the size of the program
(number of vacancies posted). The crucial variable,Bologna06, achieves the value
one if the program was restructured to adapt to the Bologna principles, and zero otherwise.
Controlling for the subjects required as admission exams is particularly relevant. Indeed, a generally poor performance in the admission exam in a certain subject reduces the size of the population that can potentially apply to programs requiring that exam.
Also, different scientific fields reacted differently to the implementation of the Bologna process (consider for example the contrast between humanities and other
fields). Estimation of the model includingfield-specific effects can control for these differences.
Two alternative concepts are used to quantify the demand for each program at an institution12:
• Hits: number of applicants who placed that program in that institution among
their choices (irrespective of its ranking, from first to sixth).
• First choice: number of applicants who placed that institution and program
as theirfirst choice.
Three alternatives were used to define the group affected by the Bologna
cur-riculum changes, to capture differences in the extent to which a program can be
11The estimation of thefixed effects negative binomial regression model was implemented through conditional maximum likelihood using the Stata command xtnbreg.
12The comments on the distribution of the dependent variable, made at the beginning of this section, apply to either variable.
affected as a result of having been restructured (intuitively, it would be like having
different intensities of treatment):
• Bologna implementer: a program at an institution, which has been
restruc-tured according to the Bologna process.
• Bologna leader: a Bologna implementer that was the only institution in the
country that restructured that program. This group corresponds to the early-implementers, who made an early move expecting to gain from its timing. It
is a group more likely to be affected (either gaining or losing) by the change,
since candidates wishing to enter this program can choose to go for a Bologna program or not.
• Bologna implementer without shortening the duration of the program (
inte-grated master): the possibility used by some institutions to restructure a
pro-gram while nevertheless keeping a duration longer than the normal Bologna
duration for the first cycle is explicitly taken into account. We distinguish
between programs that reduced their duration and those that, though
hav-ing restructured to conform to the Bologna principles, offer a joint first and
second cycle degree, thus keeping a longer duration.
Comparison of thefirst and last specifications allows in particular to check the
relevance attached by candidates to the stamp associated with Bologna and its
reputation, and to the change in the duration of the program.
The different alternatives used to quantify demand and to define the affected
group provide robustness checks on our results. Nevertheless, several potential
problems must still be tackled by the empirical specification. First of all, there
could have been endogenous adoption on the new academic model. The timing and extent of adaptation to the Bologna principles may be viewed as a political decision by the institutions, who may self-select into restructuring promptly or delaying adjustment, based on, among other factors, expectations about demand
for their programs. Our specification controls for this possibility, as it includes
other than its strategy, such as the amount of resources, reputation, or regional conditions.
Moreover, the time trend in demand may be different across programs offered by
different institutions. If so, the impact captured may reflect underlying trends
tak-ing place across programs irrespective of the adoption of the Bologna changes. For example, in a framework of increasing competition among institutions to attract
students, it is likely that universities perceived as having lower quality will suffer
declining demand, irrespective of whether they implement the Bologna restructur-ing. To control for this possibility, we will consider also the pre-intervention period.
We will therefore repeat the exercise, checking whether the affected group
(pro-grams that underwent change in 2006), were already before that period subject to
different demand. This specification can thus provides an answer to the question:
If no change in the curricula had taken place, would we nevertheless have seen a
different trend in demand for the programs that adopted the Bologna changes in
2006 and those that did not? We would expect the estimated coefficient on the
Bologna variable for 2005 and its interactions to be statistically non-significant.
6
Impact of the Bologna process
Table 1 reports on the estimation of alternative specifications of the model, in every
case using the variable hits to quantify the demand for a program, i. e. the total
number of candidates that list the program among their preferences, irrespective of its rank position.
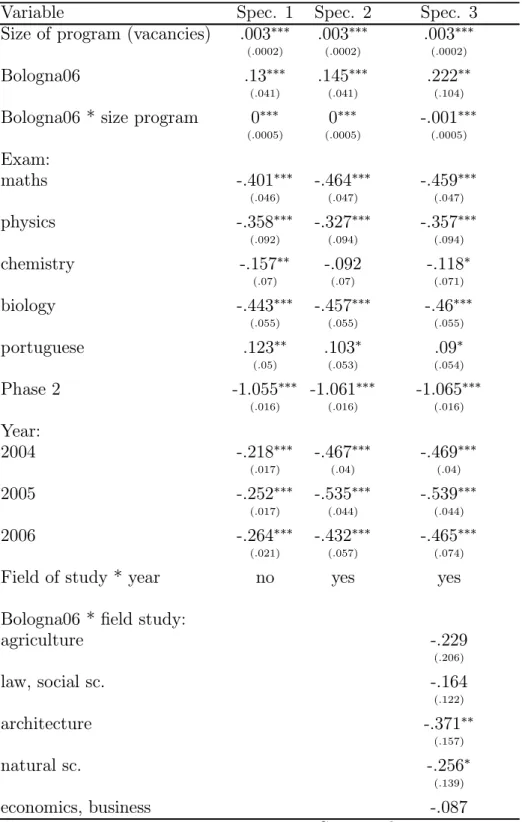
Table 1: Demand for academic programs (total number of students choosing the program), negative binomial model
Variable Spec. 1 Spec. 2 Spec. 3
Size of program (vacancies) .003∗∗∗ .003∗∗∗ .003∗∗∗
(.0002) (.0002) (.0002)
Bologna06 .13∗∗∗ .145∗∗∗ .222∗∗
(.041) (.041) (.104)
Bologna06 * size program 0∗∗∗ 0∗∗∗ -.001∗∗∗
(.0005) (.0005) (.0005) Exam: maths -.401∗∗∗ -.464∗∗∗ -.459∗∗∗ (.046) (.047) (.047) physics -.358∗∗∗ -.327∗∗∗ -.357∗∗∗ (.092) (.094) (.094) chemistry -.157∗∗ -.092 -.118∗ (.07) (.07) (.071) biology -.443∗∗∗ -.457∗∗∗ -.46∗∗∗ (.055) (.055) (.055) portuguese .123∗∗ .103∗ .09∗ (.05) (.053) (.054) Phase 2 -1.055∗∗∗ -1.061∗∗∗ -1.065∗∗∗ (.016) (.016) (.016) Year: 2004 -.218∗∗∗ -.467∗∗∗ -.469∗∗∗ (.017) (.04) (.04) 2005 -.252∗∗∗ -.535∗∗∗ -.539∗∗∗ (.017) (.044) (.044) 2006 -.264∗∗∗ -.432∗∗∗ -.465∗∗∗ (.021) (.057) (.074)
Field of study * year no yes yes
Bologna06 *field study:
agriculture -.229 (.206) law, social sc. -.164 (.122) architecture -.371∗∗ (.157) natural sc. -.256∗ (.139) economics, business -.087
... table 1 continued
Variable Spec. 1 Spec. 2 Spec. 3
(.139) sports, arts .218 (.211) education .341∗ (.199) health -.058 (.262) technologies .184 (.123) N 3745 3745 3745 N-g 665 665 665 LL -13868.21 -13766.12 -13748.34 g-avg 5.6 5.6 5.6
Significance levels: ∗: 10% ∗∗: 5% ∗ ∗ ∗: 1%. (Standard errors in parentheses). N is the number of observations, N-g is the number of groups institution/program, LL stands for log-likelihood, and g-avg is the average number of observations per group.
As expected, larger programs (posting more vacancies) are subject to larger
demand. The demand for a higher education program is strongly affected by the
performance of the candidates in the national admission exams. Indeed, require-ment of an entry exam on biology, mathematics, physics or chemistry lowers the demand for the program. Controlling for the second phase of the application process is relevant since, as described in section 3.2, this is a residual phase, for
vacancies not previouslyfilled and students who were not placed in the first phase
or who wish to be placed elsewhere. Therefore, the second phase gathers, quite naturally, a remarkably lower number of applications. Overall demand for uni-versity programs declined in 2004 (relative to 2003, the omitted category) and it
remained stable ever since (note that the estimated coefficients for the years 2004
onwards are not significantly different).
Programs that restructured to follow the Bologna principles were subject to an increase in demand, when compared to programs that did not restructure. Indeed,
those that restructured were subject to 13% higher demand (see specification 1).
mag-nitude of the coefficient on the number of vacancies interacted with the Bologna
dummy variable). The previous result is robust to the introduction (in specifi
-cation 2) of controls for the different trend over time in demand across scientific
fields.
Specification 3 further allows the impact of the adoption of the Bologna
princi-ples to be heterogenous across scientific fields. This is particularly relevant if one
keeps in mind that different areas welcomed with different degrees of enthusiasm or
skepticism the changes. The findings in column 3 indicate that in humanities (the
omitted category), restructuring of the programs according to the Bologna process
was associated with a 22% increase in demand (see the coefficient on the overall
Bologna dummy); that impact was not significantly different for programs in law,
economics, health, sports and arts, and agriculture. The impact was negative for
programs in the architecture area13, whereas it was statistically insignificant in
the natural sciences (as the sum of the coefficients on this dummy and the overall
Bologna dummy is not statistically different from zero). Education was
unequiv-ocally the area in which candidates perceived the Bologna changes as most of an opportunity, as suggested by the sharp increase in demand.
Table 4 in appendix reports comparable results considering as dependent
vari-able the number of applicants who ranked the program as their first choice only.
Specifications 1 and 2 report findings very similar to the previous ones: having
restructured to follow Bologna is associated with a 11% to 14% increase in the
de-mand for a program. Specification 3 highlights the positive impact of the Bologna
restructuring on thefirst choice of programs by candidates in thefields of education
and technologies.
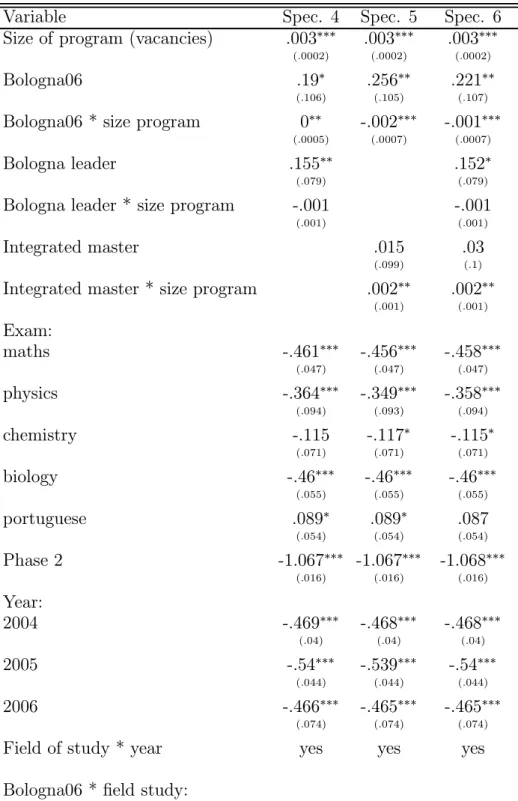
We further checked whether the impact of the Bologna process could be diff
er-ent, depending on theintensity of the changes. First of all, we considered whether
being a national leader in a certain program implementing the Bologna curricula
is associated with some benefit (or penalty) in terms of demand by prospective
students. Secondly, we checked whether restructuring to offer a joint first and
second cycle degree (the so-called integrated master) of a longer duration yields 13Which includes not just strictly architecture, but also programs such as design.
some benefit in terms of demand.
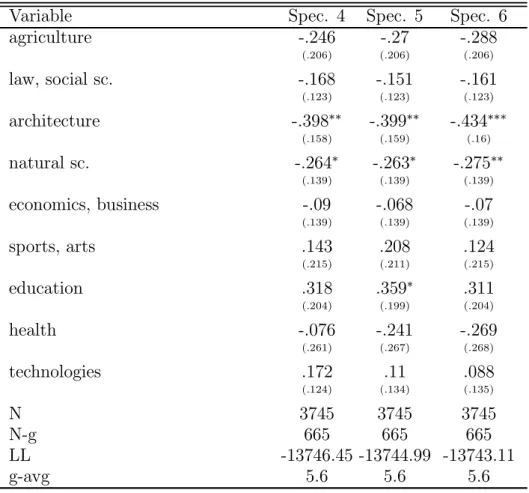
In table 2, specification 4 indeed reveals that being a leader in the
implementa-tion of the Bologna curricula changes led to an increase in demand for a program,
above the increase experienced by Bologna implementers in general. This effect
holds irrespective of the size of the program.
Specification 5 considers the impact of restructuring to offer an integrated
mas-ter program. Results indicate that there was indeed a positive impact on demand for programs that restructured and kept a long duration, above the impact for Bologna implementers in general; however, this increase in demand took place only for large programs.
Once we check jointly the impact of being a Bologna leader and the impact of
having restructured to offer a long integrated master program (specification 6),
the previous results hold: national leaders in the adaption of the curricula to the Bologna principles attracted more applicants than Bologna changers in general, and a further increase in demand was directed at large programs that became an integrated master under the Bologna setting.
Table 2: Demand for academic programs (total num-ber of students choosing the program), including Bologna leader and integrated master variables, negative binomial model
Variable Spec. 4 Spec. 5 Spec. 6
Size of program (vacancies) .003∗∗∗ .003∗∗∗ .003∗∗∗
(.0002) (.0002) (.0002)
Bologna06 .19∗ .256∗∗ .221∗∗
(.106) (.105) (.107)
Bologna06 * size program 0∗∗ -.002∗∗∗ -.001∗∗∗
(.0005) (.0007) (.0007)
Bologna leader .155∗∗ .152∗
(.079) (.079)
Bologna leader * size program -.001 -.001
(.001) (.001)
Integrated master .015 .03
(.099) (.1)
Integrated master * size program .002∗∗ .002∗∗
(.001) (.001) Exam: maths -.461∗∗∗ -.456∗∗∗ -.458∗∗∗ (.047) (.047) (.047) physics -.364∗∗∗ -.349∗∗∗ -.358∗∗∗ (.094) (.093) (.094) chemistry -.115 -.117∗ -.115∗ (.071) (.071) (.071) biology -.46∗∗∗ -.46∗∗∗ -.46∗∗∗ (.055) (.055) (.055) portuguese .089∗ .089∗ .087 (.054) (.054) (.054) Phase 2 -1.067∗∗∗ -1.067∗∗∗ -1.068∗∗∗ (.016) (.016) (.016) Year: 2004 -.469∗∗∗ -.468∗∗∗ -.468∗∗∗ (.04) (.04) (.04) 2005 -.54∗∗∗ -.539∗∗∗ -.54∗∗∗ (.044) (.044) (.044) 2006 -.466∗∗∗ -.465∗∗∗ -.465∗∗∗ (.074) (.074) (.074)
Field of study * year yes yes yes
Bologna06 *field study:
... table 2 continued
Variable Spec. 4 Spec. 5 Spec. 6
agriculture -.246 -.27 -.288 (.206) (.206) (.206) law, social sc. -.168 -.151 -.161 (.123) (.123) (.123) architecture -.398∗∗ -.399∗∗ -.434∗∗∗ (.158) (.159) (.16) natural sc. -.264∗ -.263∗ -.275∗∗ (.139) (.139) (.139) economics, business -.09 -.068 -.07 (.139) (.139) (.139) sports, arts .143 .208 .124 (.215) (.211) (.215) education .318 .359∗ .311 (.204) (.199) (.204) health -.076 -.241 -.269 (.261) (.267) (.268) technologies .172 .11 .088 (.124) (.134) (.135) N 3745 3745 3745 N-g 665 665 665 LL -13746.45 -13744.99 -13743.11 g-avg 5.6 5.6 5.6
Significance levels: ∗: 10% ∗∗: 5% ∗ ∗ ∗: 1%. (Standard errors in parentheses). N is the number of observations, N-g is the number of groups institution/program, LL stands for log-likelihood, and g-avg is the average number of observations per group.
Table 5 in appendix shows results of the same specifications, considering as
dependent variable the number of candidates who chose the program as their
first option only. Results highlight that the impact of the Bologna changes was
more pronounced in education and technologies, while being a leader or having
restructured to become an integrated master does not yield a significant impact
on the first option listed by candidates.
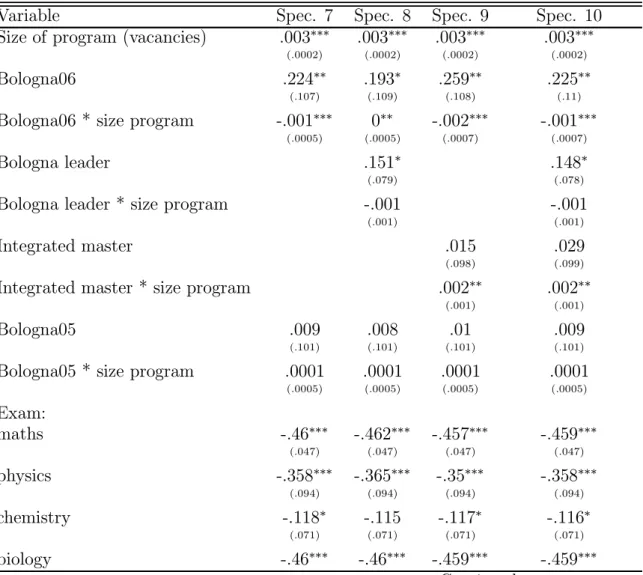
Onefinal issue remains to be tackled, that of checking if the impact we are
cap-turing was indeed a result of the Bologna changes or a trend taking place anyhow, due to factors other than Bologna, which would have taken place even if the pro-gram had not been restructured. We therefore run the previous models including a
new variable, Bologna05, which assumes the value 1 in the year 2005 (previous to the implementation of any Bologna changes) for the programs that later (in 2006)
were restructured. We expect the estimated coefficients on this variable and its
interactions to be non-significant, meaning that programs implementing Bologna
in 2006 were not subject to a different trend in demand already before that period.
Table 3 adds this variable and its interactions to the final specification in table 1
(calling it specification 7) and to the specifications in table 2 (specifications 8 to 10).
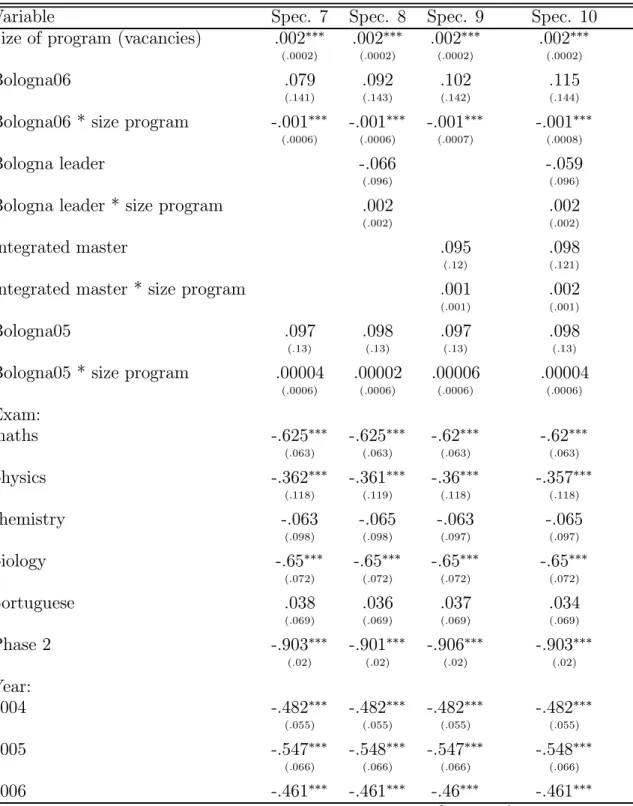
Table 3: Demand for academic programs (total number of students choosing the program), including Bologna 2005 variable, negative binomial model
Variable Spec. 7 Spec. 8 Spec. 9 Spec. 10
Size of program (vacancies) .003∗∗∗ .003∗∗∗ .003∗∗∗ .003∗∗∗
(.0002) (.0002) (.0002) (.0002)
Bologna06 .224∗∗ .193∗ .259∗∗ .225∗∗
(.107) (.109) (.108) (.11)
Bologna06 * size program -.001∗∗∗ 0∗∗ -.002∗∗∗ -.001∗∗∗
(.0005) (.0005) (.0007) (.0007)
Bologna leader .151∗ .148∗
(.079) (.078)
Bologna leader * size program -.001 -.001
(.001) (.001)
Integrated master .015 .029
(.098) (.099)
Integrated master * size program .002∗∗ .002∗∗
(.001) (.001)
Bologna05 .009 .008 .01 .009
(.101) (.101) (.101) (.101)
Bologna05 * size program .0001 .0001 .0001 .0001
(.0005) (.0005) (.0005) (.0005) Exam: maths -.46∗∗∗ -.462∗∗∗ -.457∗∗∗ -.459∗∗∗ (.047) (.047) (.047) (.047) physics -.358∗∗∗ -.365∗∗∗ -.35∗∗∗ -.358∗∗∗ (.094) (.094) (.094) (.094) chemistry -.118∗ -.115 -.117∗ -.116∗ (.071) (.071) (.071) (.071) biology -.46∗∗∗ -.46∗∗∗ -.459∗∗∗ -.459∗∗∗
... table 3 continued
Variable Spec. 7 Spec. 8 Spec. 9 Spec. 10
(.055) (.055) (.055) (.055) portuguese .089∗ .088 .087 .086 (.054) (.054) (.054) (.054) Phase 2 -1.065∗∗∗ -1.067∗∗∗ -1.068∗∗∗ -1.069∗∗∗ (.016) (.016) (.016) (.016) Year: 2004 -.469∗∗∗ -.469∗∗∗ -.469∗∗∗ -.469∗∗∗ (.04) (.04) (.04) (.04) 2005 -.542∗∗∗ -.543∗∗∗ -.542∗∗∗ -.543∗∗∗ (.048) (.048) (.048) (.048) 2006 -.466∗∗∗ -.467∗∗∗ -.466∗∗∗ -.467∗∗∗ (.074) (.074) (.074) (.074)
Field of study * year yes yes yes yes
Bologna06 * field study:
agriculture -.26 -.275 -.302 -.318 (.213) (.213) (.213) (.213) law, social sc. -.158 -.163 -.147 -.156 (.126) (.127) (.126) (.127) architecture -.376∗∗ -.4∗∗ -.404∗∗ -.437∗∗∗ (.164) (.165) (.165) (.166) natural sc. -.265∗ -.271∗ -.272∗ -.283∗∗ (.144) (.144) (.144) (.144) economics, business -.036 -.039 -.017 -.019 (.145) (.145) (.144) (.145) sports, arts .213 .14 .203 .121 (.228) (.233) (.228) (.233) education .436∗∗ .415∗∗ .453∗∗ .407∗ (.206) (.21) (.205) (.21) health -.049 -.064 -.223 -.25 (.276) (.275) (.279) (.28) technologies .226∗ .214∗ .151 .13 (.127) (.128) (.137) (.138)
Bologna05 * field study:
agriculture -.116 -.111 -.118 -.112 (.204) (.204) (.204) (.204) natural sc. -.032 -.027 -.035 -.03 (.143) (.143) (.143) (.143) architecture -.017 -.013 -.017 -.014 (.159) (.159) (.159) (.159)
... table 3 continued
Variable Spec. 7 Spec. 8 Spec. 9 Spec. 10
economics, business .171 .17 .169 .169 (.142) (.142) (.142) (.142) sports, arts -.015 -.014 -.016 -.016 (.264) (.264) (.264) (.264) education .292 .295 .292 .294 (.21) (.21) (.21) (.21) law, social sc. .014 .013 .01 .01 (.121) (.121) (.121) (.121) health .008 .013 .031 .034 (.267) (.266) (.265) (.265) technologies .132 .132 .131 .131 (.118) (.118) (.118) (.118) N 3745 3745 3745 3745 N-g 665 665 665 665 LL -13742.13 -13740.31 -13738.68 -13736.88 g-avg 5.6 5.6 5.6 5.6 χ2 (11) 12.67 12.54 12.86 12.72
Significance levels: ∗ : 10% ∗∗: 5% ∗ ∗ ∗ : 1%. (Standard errors in parentheses). N is the number of observations, N-g is the number of groups institution/program, LL stands for log-likelihood, and g-avg is the average number of observations per group. Theχ2
(11)is the joint test on the Bologna 2005 variable and its interactions.
It is reassuring to find that, as expected, belonging to the affected group of
programs before the restructuring was implemented, did not have any significant
impact on the demand for a degree. Table 3 indeed shows that the coefficients
on the Bologna05 variable and its interactions are non-significant. Therefore, the
demand for Bologna and non-Bologna degrees was not undergoing different trends
before the institutional changes were implemented, pointing to the validity of the exercise we performed.
7
Conclusion
We have checked the impact on the demand for academic programs resulting from the remarkable changes in the curricula currently taking place under the Bologna process. The relevance of the issue follows from the mix of enthusiasm and some
education used to last for four orfive years and is now reduced to a normal duration of three years. Analysis of the issue is feasible in Portugal, since the procedure of application to higher education takes place at the centralized national level and candidates must clearly list their preferences in terms of programs and institutions. We explored the fact that in the academic year 2006/07, some programs underwent restructuring, whereas other did not.
Results clearly indicate that programs that changed their curricula to conform with the Bologna principles were subject to an increase in demand by prospective students. That positive impact on demand was more pronounced if the institution took the lead, being the only institution in the country that restructured the program. We also found that large programs that changed their curriculum to
offer an integrated master, thus conforming to the Bologna principles while not
reducing the duration of the program, were subject to a further increase in demand.
Moreover, we have confirmed that the impact we are capturing is not due to trends
taking place irrespective of the adoption of the Bologna principles. Indeed, our tests indicate that the demand for Bologna and non-Bologna degrees was not
undergoing different trends before the institutional changes were implemented.
References
Cameron, A. Colin and Pravin K. Trivedi(1998). Regression Analysis of
Count Data. Cambridge: Cambridge University Press.
Mas-Colell, Andreu(2003). The European space of higher education:
incen-tive and governance issues. Rivista di Politica Economica, 11-12: 9-27.
Reichert, Sybille and Christian Tauch(2005). Trends IV: European
Uni-versities Implementing Bologna. Brussels: European University Association.
Table 4: Demand for academic programs (number of
stu-dents choosing the program as theirfirst choice), negative
binomial model
Variable Spec. 1 Spec. 2 Spec. 3
Size of program (vacancies) .002∗∗∗ .002∗∗∗ .002∗∗∗
(.0002) (.0002) (.0002)
Bologna06 .111∗∗ .143∗∗∗ .054
(.049) (.05) (.137)
Bologna06 * size program 0∗ 0∗∗ -.001∗∗∗
(.0006) (.0006) (.0006) Exam: maths -.599∗∗∗ -.626∗∗∗ -.621∗∗∗ (.063) (.063) (.063) physics -.317∗∗∗ -.323∗∗∗ -.364∗∗∗ (.115) (.118) (.118) chemistry -.1 -.037 -.06 (.096) (.097) (.097) biology -.644∗∗∗ -.654∗∗∗ -.648∗∗∗ (.071) (.072) (.072) portuguese .104 .072 .044 (.066) (.069) (.069) Phase 2 -.897∗∗∗ -.898∗∗∗ -.902∗∗∗ (.02) (.02) (.02) Year: 2004 -.214∗∗∗ -.483∗∗∗ -.48∗∗∗ (.02) (.055) (.055) 2005 -.26∗∗∗ -.523∗∗∗ -.526∗∗∗ (.021) (.059) (.059) 2006 -.281∗∗∗ -.498∗∗∗ -.454∗∗∗ (.026) (.076) (.094)
Field of study * year no yes yes
Bologna06 *field study:
agriculture -.244 (.293) law, social sc. .082 (.156) architecture -.172 (.196) natural sc. -.223 (.186)
... table 4 continued
Variable Spec. 1 Spec. 2 Spec. 3
economics, business .074 (.174) sports, arts .121 (.271) education .772∗∗∗ (.234) health -.117 (.333) technologies .435∗∗∗ (.163) N 3745 3745 3745 N-g 665 665 665 LL -9461.225 -9399.144 -9379.973 g-avg 5.6 5.6 5.6
Significance levels: ∗: 10% ∗∗: 5% ∗ ∗ ∗: 1%. (Standard errors in parentheses). N is the number of observations, N-g is the number of groups institution/program, LL stands for log-likelihood, and g-avg is the average number of observations per group.
Table 5: Demand for academic programs (number of
stu-dents choosing the program as their first choice),
includ-ing Bologna leader and integrated master variables, neg-ative binomial model
Variable Spec. 4 Spec. 5 Spec. 6
Size of program (vacancies) .002∗∗∗ .002∗∗∗ .002∗∗∗
(.0002) (.0002) (.0002)
Bologna06 .065 .077 .088
(.139) (.138) (.14)
Bologna06 * size program -.001∗∗∗ -.001∗∗∗ -.001∗∗∗
(.0006) (.0007) (.0008)
Bologna leader -.061 -.054
(.097) (.097)
Bologna leader * size program .001 .002
(.002) (.002)
Integrated master .097 .1
(.121) (.123)
Integrated master * size program .001 .002
(.001) (.001) Exam: maths -.621∗∗∗ -.616∗∗∗ -.616∗∗∗ (.063) (.063) (.063) physics -.363∗∗∗ -.362∗∗∗ -.359∗∗∗ (.118) (.118) (.118) chemistry -.061 -.06 -.061 (.097) (.097) (.097) biology -.648∗∗∗ -.648∗∗∗ -.648∗∗∗ (.072) (.072) (.072) portuguese .042 .043 .04 (.069) (.069) (.069) Phase 2 -.9∗∗∗ -.904∗∗∗ -.902∗∗∗ (.02) (.02) (.02) Year: 2004 -.48∗∗∗ -.48∗∗∗ -.48∗∗∗ (.055) (.055) (.055) 2005 -.526∗∗∗ -.525∗∗∗ -.526∗∗∗ (.059) (.059) (.059) 2006 -.454∗∗∗ -.454∗∗∗ -.454∗∗∗ (.094) (.094) (.094)
Field of study * year yes yes yes
Bologna06 *field study:
... table 5 continued
Variable Spec. 4 Spec. 5 Spec. 6
agriculture -.239 -.309 -.308 (.293) (.294) (.294) law, social sc. .08 .091 .085 (.157) (.156) (.157) architecture -.17 -.214 -.224 (.198) (.198) (.201) natural sc. -.224 -.225 -.23 (.186) (.186) (.186) economics, business .077 .089 .093 (.174) (.174) (.174) sports, arts .146 .111 .123 (.277) (.272) (.278) education .76∗∗∗ .782∗∗∗ .747∗∗∗ (.242) (.234) (.241) health -.106 -.345 -.345 (.335) (.343) (.344) technologies .436∗∗∗ .326∗ .315∗ (.163) (.176) (.177) N 3745 3745 3745 N-g 665 665 665 LL -9379.601 -9377.576 -9376.9 g-avg 5.6 5.6 5.6
Significance levels: ∗: 10% ∗∗: 5% ∗ ∗ ∗: 1%. (Standard errors in parentheses). N is the number of observations, N-g is the number of groups institution/program, LL stands for log-likelihood, and g-avg is the average number of observations per group.
Table 6: Demand for academic programs (number of
stu-dents choosing the program as their first choice),
includ-ing Bologna 2005 variable, negative binomial model
Variable Spec. 7 Spec. 8 Spec. 9 Spec. 10
Size of program (vacancies) .002∗∗∗ .002∗∗∗ .002∗∗∗ .002∗∗∗
(.0002) (.0002) (.0002) (.0002)
Bologna06 .079 .092 .102 .115
(.141) (.143) (.142) (.144)
Bologna06 * size program -.001∗∗∗ -.001∗∗∗ -.001∗∗∗ -.001∗∗∗
(.0006) (.0006) (.0007) (.0008)
Bologna leader -.066 -.059
(.096) (.096)
Bologna leader * size program .002 .002
(.002) (.002)
Integrated master .095 .098
(.12) (.121)
Integrated master * size program .001 .002
(.001) (.001)
Bologna05 .097 .098 .097 .098
(.13) (.13) (.13) (.13)
Bologna05 * size program .00004 .00002 .00006 .00004
(.0006) (.0006) (.0006) (.0006) Exam: maths -.625∗∗∗ -.625∗∗∗ -.62∗∗∗ -.62∗∗∗ (.063) (.063) (.063) (.063) physics -.362∗∗∗ -.361∗∗∗ -.36∗∗∗ -.357∗∗∗ (.118) (.119) (.118) (.118) chemistry -.063 -.065 -.063 -.065 (.098) (.098) (.097) (.097) biology -.65∗∗∗ -.65∗∗∗ -.65∗∗∗ -.65∗∗∗ (.072) (.072) (.072) (.072) portuguese .038 .036 .037 .034 (.069) (.069) (.069) (.069) Phase 2 -.903∗∗∗ -.901∗∗∗ -.906∗∗∗ -.903∗∗∗ (.02) (.02) (.02) (.02) Year: 2004 -.482∗∗∗ -.482∗∗∗ -.482∗∗∗ -.482∗∗∗ (.055) (.055) (.055) (.055) 2005 -.547∗∗∗ -.548∗∗∗ -.547∗∗∗ -.548∗∗∗ (.066) (.066) (.066) (.066) 2006 -.461∗∗∗ -.461∗∗∗ -.46∗∗∗ -.461∗∗∗
... table 6 continued
Variable Spec. 7 Spec. 8 Spec. 9 Spec. 10
(.094) (.094) (.094) (.094)
Field of study * year yes yes yes
Bologna06 * field study:
agriculture -.297 -.292 -.361 -.36 (.302) (.302) (.302) (.302) law, social sc. .071 .069 .079 .073 (.161) (.162) (.161) (.162) architecture -.239 -.238 -.28 -.291 (.204) (.206) (.206) (.208) natural sc. -.212 -.213 -.215 -.22 (.192) (.193) (.192) (.193) economics, business .08 .082 .095 .099 (.18) (.18) (.18) (.18) sports, arts .125 .154 .114 .13 (.29) (.296) (.291) (.296) education .712∗∗∗ .698∗∗∗ .721∗∗∗ .686∗∗∗ (.246) (.253) (.246) (.253) health -.156 -.145 -.377 -.377 (.355) (.356) (.361) (.362) technologies .496∗∗∗ .498∗∗∗ .388∗∗ .378∗∗ (.168) (.168) (.18) (.182)
Bologna05 * field study:
agriculture -.199 -.2 -.201 -.201 (.279) (.279) (.279) (.279) natural sc. .031 .029 .029 .028 (.184) (.184) (.184) (.184) architecture -.23 -.232 -.23 -.232 (.198) (.198) (.198) (.198) economics, business .003 .003 .002 .003 (.174) (.174) (.174) (.174) sports, arts -.017 -.013 -.019 -.014 (.301) (.3) (.301) (.3) education -.223 -.225 -.223 -.225 (.272) (.272) (.272) (.272) law, social sc. -.05 -.049 -.052 -.051 (.151) (.151) (.151) (.151) health -.131 -.133 -.125 -.125 (.308) (.308) (.307) (.307)
... table 6 continued
Variable Spec. 7 Spec. 8 Spec. 9 Spec. 10
technologies .189 .189 .188 .189 (.152) (.152) (.152) (.152) N 3745 3745 3745 3745 N-g 665 665 665 665 LL -9371.509 -9371.066 -9369.098 -9368.335 g-avg 5.6 5.6 5.6 5.6 χ2 (11) 16.95 17.09 16.98 17.15
Significance levels: ∗ : 10% ∗∗: 5% ∗ ∗ ∗ : 1%. (Standard errors in parentheses). N is the number of observations, N-g is the number of groups institution/program, LL stands for log-likelihood, and g-avg is the average number of observations per group. Theχ2
(11)is the joint test on the Bologna 2005 variable and its interactions.
Table 7: Summary statistics
Variable Mean or Pct. Std. Dev.
Demand: number ofhits 139.1 207.8
Demand: first option 31.9 61.7
Bologna06 0.116 0.32
Bologna leader 0.05 0.218
Integrated master 0.02 0.141
Phase 2 0.49
Size of the program (vacancies) 32.7 39.7
Exams: maths 0.377 physics 0.046 chemistry 0.083 biology 0.111 portuguese 0.083 Field of study: agriculture 0.054 architecture 0.070 natural sciences 0.131
law, social sciecnes 0.148
economics, business 0.073 sports, arts 0.033 education 0.078 humanities 0.154 health 0.042 technologies 0.217 N 3745