IJEM
International Journal of Economics and Management Journal homepage: http://www.econ.upm.edu.my/ijem
JUDHIANA A. GHANIa,*, BHAJAN GREWALb, ABDULLAHI
D. AHMEDc AND NORASHIDAH MOHD NOORd
aDepartment of Economics, Faculty of Economics and Management, University Putra Malaysia, Serdang, 43400, Selangor, Malaysia. bVictoria Institute of Strategic Economic Studies, Victoria University, 300,
Flinders St, PO Box 14428, Melbourne, VIC.8001, Australia.
cSchool of Accounting, Royal Melbourne Institute of Technology, 445 Swanston St, Melbourne VIC 3000 Australia
dDepartment of Economics, Faculty of Economics and Management, University Putra Malaysia, Serdang, 43400, Selangor, Malaysia.
ABSTRACT
By analyzing state governments’ efficiency in allocating fiscal resources, this study evalu-ates the efficiency of state public finances under the Malaysian fiscal federalism. This is reflected in the policies, strategies and decisions made to allocate public expenditure as this measurement would enable us to explain the institutional quality of the public sector in re-spect of the concept of regional competitiveness. In particular, states play important role in supporting the private sector and the market-based economy. The Data Envelopment Analy-sis (DEA) under the dynamic condition and Tobit panel data regression model are conducted on data for all the thirteen states in Malaysia from 1990 to 2009. The results of DEA reveal evidence that the current centralized fiscal federalism system has been unable to create a competitive environment among state governments, resulting in low levels of efficiency in the states. As an extension of the DEA, Tobit panel data regression model is needed to identify the factors that influence technical efficiency in Malaysia and the result showed evidence that fiscal decentralization had positive and significant influence on state efficiency level, but that further efficiency gains could have been realized with greater decentralization. Thus, this study supports the
Efficiency Analysis of State Governments In The Malaysian
Fiscal Federalism
Article history:
Received: 7 November 2016 Accepted: 20 August 2017
INTRODUCTION
In recent years, growing attention has been given to efficiency in the government sector (Tirtosuharto 2009) and many countries have turned to decentralization as a particularly effective way to promote efficiency. Build-ing on the classic works of Tiebout (1956), Musgrave (1959) and Oates (1972), Brennan and Buchanan (1980) have posited that fiscal decentraliza-tion leads to increase in government efficiency through allocative/consumer and producer/ technical efficiency. Despite lack of empirical evidence this idea has won widespread acceptance (Martinez-Vazquez and McNab 2003; Thieben 2003; Loehr and Manasan 1999).
Fiscal decentralization is one of the major principles of the Market Pre-serving Federalism (MPF) model that emphasizes the importance of healthy competition among the lower governments (Jin, Qian, and Weingast 2005). Specifically, the cornerstone of the MPF model is a set of market-based prin-ciples that emphasizes the role of hard budget constraints, local autonomy, fiscal accountability and operational transparency (Grewal and Sheehan 2004). Past studies show that fiscal decentralization provides a greater incen-tive structure for state governments to become more efficient in allocating fiscal resources (Tirtosuharto 2009). In line with the concept of regional competitiveness, this study will evaluate the efficiency of state public financ-es under the Malaysian fiscal federalism.
Compared to other federations in both developed and developing countries, the federal system in Malaysia tends towards a more centralized structure as the distribution of functions is highly skewed towards federal government particularly in conducting financial relations (A Ghani 2014). The federal government collects relatively more revenue than the consolidat-ed state revenue by retaining all major revenue sources and powers of bor-rowing. Indeed, the monopoly of the revenue system provides a fundamental basis for the strong political power of the federal government and fosters a permanent dependency of the state governments on the federal government for development funds/transfers. This means that the centralized federal sys-tem in Malaysia empowers the federal government not only in regulating the development and location of industries but also in controlling the state’s share of expenditure allocation. In terms of expenditure assignment, the federal government incurs larger shares of total government expenditure, including all important functions such as education, health, transport and communica-tion. This leaves development of the states to be very much at the
contention that fiscal decentralization provides incentive struc-tures to support higher state efficiency levels. The findings echo the main argument of Mar-ket Preserving Federalism theory that states become more efficient if more power is devolved to them whilst ensuring that they spend within their fiscal capacity.
JEL Classification : H72; H77; E62; F34
Keywords: Efficiency, fiscal federalism, fiscal decentralization, market
discretion of the center. This is different from most other federations where the states are constitutionally responsible for the major areas of spending, particularly in the education and health arenas. Given this background, it is worth consid-ering whether MPF principles can place state governments in higher degree of responsibility, accountability and competition with one another, so the state governments become efficient and competitive which are crucial for promot-ing pro-development policies achieving higher regional economic growth.
LITERATURE REVIEW
Economists have long argued that federalism places subnational govern-ments in competition with one another (Brennan and Buchanan 1980; Oates 1972; Tiebout 1956). Competition gives subnational governments the incen-tive to foster local economic prosperity rather than costly market interven-tion, service to interest groups, and corruption. Market Preserving Federalism (MPF) highlights its belief in the value of competition as the most stable means of economic growth and that such competition can be created through the promotion of markets (Weingast 2009). Market preserving federalism (MPF) is a new addition to the growing literature on fiscal federalism, and represents an ideal (according to its proponents) type of fiscal federalism which seeks to re-establish government institutions and intergovernmental relations on market-based principles and to minimize rent-seeking behavior of governments (A Ghani 2014). In relation to the MPF concept, North (1995) has emphasized about the importance of efficient markets, which are impera-tive for the competitiveness and growth. Efficient markets require institu-tions, particularly the rule of law, and governments to provide positive market incentives by rewarding economic successes and punishing economic fail-ures. Competition derived from decentralization would be able to control and limit the central government‘s interference in the lower level governments. More importantly, competition between subnational governments in attract-ing capital to their regions creates an externality which increases the oppor-tunity cost of subsidizing ailing firms, which in turn reduces the incentives to be bailed-out. Put another way, interjurisdictional competition provides polit-ical officials with strong fiscal incentives to pursue policies that provide for a healthy local economy. Reducing conditions of competition among the states would result in the absence of state policy experimentation and innovation.
From the viewpoint of regional competitiveness, decentralization is im-perative for increasing the power and capacity of a subnational government, sustain economic growth and improve standards of living. Viewed in this light, state government efficiency eventually is found to be the determining factor of competitiveness and growth at the regional level (Tirtosuharto 2009). The concept of regional competitiveness focuses on the capacity of subnational governments in stimulating and sustaining economic growth and development. Subnational governments can play an important role in support-ing the private sector and preserving a market economy. Hence, it is neces-sary to have in place a supportive system of governance, which will allow a subnational government to foster the process of development. Based on the competitiveness and allocative efficiency concepts, fiscal decentralization supports economic efficiency and intergovernmental competition (Bardhan 2002). Fiscal decentralization
is associated with expenditure and revenue allocation to accommodate district or regional economies for ensuring effi-cient delivery of public service provisions (Rao 2003).
An efficient economy is measured by its ability to efficiently allocate or distribute resources. This implies that states should optimize the use of their limited fiscal resources to serve the welfares of both individual citizens and firms, which is consistent with the principles of the Neoclassical theory. When measuring efficiency, a distinction can be made between technical and allocative allocative efficiency. According to Economic and Financial affairs (2008), technical efficiency measures the pure relation between inputs and outputs taking the production possibility frontier into account. Technical effi-ciency gains are a movement towards this production possibility frontier (best practice). However, not every form of technical efficiency makes economic sense, and this is captured by allocative efficiency. Allocative efficiency re-flects the link between the optimal combination of inputs taking into account costs and benefits and the output.
There are also some counterarguments showing a decline in efficiency under decentralized systems. Firstly, if subnational governments operate on a lower production frontier than the central government, then decentralization leads to a decline in the quantity or quality of public good output, and is like-ly to retard economic growth. Also, it is not always possible to accurately measure the tastes of preferences as the allocative efficiency gains from de-centralization of service provision at local levels would then be much less than anticipated (McNab 2001). Whether fiscal decentralization actually leads to allocative efficiency in practice or not is questionable, particularly in situations where subnational governments lack the technical expertise or re-sources to translate their knowledge of local preferences into effective poli-cies. There is no apparent consensus in the literature that fiscal decentraliza-tion results in increased producer/technical efficiency, and there is also little discussion on how potential efficiency gains can be translated into increased economic growth. In fact, Prud‘homme (1995) argues that fiscal decentraliza-tion can increase disparities, jeopardize stability and undermine efficiency. Indeed Tanzi (2000) argued that higher incidences of moral hazard can occur at the state level, particularly when states lack the ability to manage debt, budget deficits exist, and good incentives to encourage the efficient alloca-tion of resources, hence offsetting the benefit of fiscal decentralization as well as increasing the risk to the fiscal and macroeconomic stability of both federal and state government.
Based on the framework of fiscal decentralization, the allocation of fiscal resources is primarily related to state spending or expenditure. The choices made by the state government for expenditure determine the degree of public capital accumulation which is identified as the key factor of growth and de-velopment by both Classical and Neoclassical theory. Samuelson (1954) pre-sented the idea of common public goods that focused on optimal public spending rather than taxation. In particular, the importance of public expendi-ture in the economy is related to the major role played by the government. However, Tiebout (1956) extended such concept by linking public expendi-ture and Neoclassical theory of capital stock. Capital stock plays a key role in determining output levels, and will change over time as a result of additional investments and depreciation of capital stock. In Solow‘s (2000) growth mod-el, capital along with the growth of the labor force, are found to be the main factors of production. The production function in the Solow model is based on the extent of efficiency or productivity
of labor and capital. Although, there was lack of discussion on the role of public capital, Neoclassical theory pro-vides a basis to understand the key issues of public capital and output growth. Accumulation of public capital stock provides a rationale for government involvement in the market economy through public investments as an attempt to support private sector production. Public expenditure influences economic growth through three channels: aggregate demand, resource allocation and income distribution. First, public inputs through government expenditure in-crease production and aggregate demand as the Neoclassical theory views public capital stock as a function of the marginal utility theory with respect to consumption (Tiebout 1956; Samuelson 1954). As a result of higher produc-tivity, production increases as consumers derive utilities from public capital stock (Arrow 1970). Thus, it is imperative for state governments to provide incentives for the private sector to invest and produce (Aschauer 1989). Barro (1990) emphasized that public capital is considered an input to production and a complement of private capital, hence allocation of state fiscal resources in productive public capital investment would reduce the costs of production and increase output of firms due to higher productivity. Therefore, regions compete to support higher return on capital investments to the private sector (Siebert 1996; Munnell 1992). However, increasing public expenditure can lower the aggregate investment and consumption in the private sector. This situation is referred to crowding-out in which public capital acts as a substi-tute to private capital and at the same time hinders incentives for private sec-tor investment. Subsequently, increase in public expenditure results in the cost of higher taxes to finance public investments. Empirical studies suggest that there should be a balance between investments from public and private capital (Munnell 1992). Since the government intervention reduces the opti-mality of resource allocation, the questions are whether the share of public spending is significantly large compared to the national economy and wheth-er the government should be directly involved in production, which could increase inefficiencies from waste spending, rent seeking, and corruption practices. Such issues are imperative for the implementation of fiscal decen-tralization particularly in developing countries where the extent of inefficien-cy is greater than in developed countries (Tirtosuharto 2009).
METHODOLOGY
A two-stage Data Envelopment Analysis (DEA) method is used to esti-mate technical efficiency of state governments. In the first stage, the efficient frontier and the state government-level efficiency scores are first estimated using DEA under dynamic condition. This dynamic condition or time de-pendent setting in DEA is able to observe excessive use of resources that are intended to produce future outputs (Charnes, Cooper, and Gorlarry 1985). In the second stage, the estimated DEA efficiency scores are regressed on some institutional and contextual/ environmental variables using a Tobit model for all the thirteen states in Malaysia from 1990 to 2009.
Data Envelopment Analysis is an important non-parametric method that measures the relative performance of certain decision making units (DMU) through a multifactor productivity analysis module for measuring the relative efficiency on DMUs. In other words, it is an
analytical tool which assists the identification of best practices in the use of resources among a group of or-ganisations. Charnes, Cooper, and Rhodes (1978) pioneered the method of DEA which is based on a mathematical programming production frontier approach. In this model called the CCR model, the frontier is constructed using a piecewise linear combination that has connection with the set of ‘best practices observations’ in the sample, yielding a convex efficient frontier, and existent values of DMUs are compared to the constructed frontier. The major advantage of the DEA approach is that it does not require any assumption about the function form, making it particularly suitable for analysing multiple inputs and multiple outputs production systems (Rayeni 2012).
According to (Farrel 1957), technical efficiency refers to a condition when given a set of outputs, a minimum quantity of inputs are required and vice versa. The technical efficiency of a DMU is computed as the ratio of output produced to input consumed as shown below.
Technical Efficiency = ∑weighted outputs/∑ weighted inputs (1) In general, the basic concept of efficiency measurement is based on the ratio of total outputs to total inputs with the objective to select a set of input and outputs that are relevant to the evaluation of performance and show a moderate statistical relationship (Al Eraqi, Mustafa, and Khader 2010). Tech-nical efficiency as measured by DEA can be identified by using an input or output orientation. In this study, DEA model is based on input orientation as it pertains to the capability of state governments in maximizing output gener-ated from a limited amount of public spending as input. In the input-oriented model, inputs are controllable and DMUs are deemed to generate a given amount of outputs with the smallest possible amount of inputs. The technical efficiency score is measured with state revenue and private investments as the outputs of the model, while state spending, including capital expenditure and current expenditure, are considered as the input variables.
Following a number of suggestions in the literature, this study employed public expenditure as the input to measure efficiency of states (Tirtosuharto 2009; Herrera and Pang 2005). Although DEA measures relative efficiency, each DMU is assumed to have a sufficient number of units with absolute technical efficiency and the DEA analysis is seen capable of continuously improving their performance (Thanassoulis 2001). In the first step, Granger causality test is performed to identify a stronger causal relationship between the input and output variables. Homogeneity is the main criterion of DMU as it uses the same input resources to produce output and yet, each unit of as-sessment has a ‘decision’ control mechanism to convert inputs into outputs. Therefore, this technical efficiency analysis is actually an analysis of spend-ing or expenditure efficiency. The input and output data were obtained from the state governments (eg. State financial report), Ministry of Finance (MOF) and National Audit Department (eg. Auditor’s general report).
In state spending, the variable of capital expenditure includes spending on various public investments, such as infrastructure, health and education, and current expenditure includes other non-investment expenditures on opera-tions and public goods provision. Because of the nature of typical public fixed investments where there is a time lag for a project or program to be fully op-erated, the data used has a one year lag. Spending on capital investment pro-jects or services generates revenue for states either directly through fees or charges, or indirectly
through tax collections driven by private sector devel-opment. The level of private investment is also affected by state decisions to invest in capital projects, particularly in connection with public service deliv-ery. The availability of infrastructure, such as transportation networks, tele-communication, and electricity would be part of the consideration when mak-ing a decision to invest in a region. The expansion of state expenditure will also boost government consumption, expand market demand, and potentially induce private investment in the region. This is similar to the concept of the multiplier effect which posits that government spending can lead to higher economic growth. The two output variables in the DEA model are state reve-nue and private domestic investment. State revenue includes taxes, fees and charges, but it excludes transfers from the federal government. Some of the state revenue also comes from profits generated by state owned enterprises (SOEs), such as state local banks and public utilities organizations.
Specifically for this study, The DEA under dynamic condition (time de-pendent method), which is also known as window analysis, has been used to measure changes in performance of the states over time. The properties of the window analysis are measured as below: With thirteen DMUs (n) and twenty years of observation (k), this study uses a five year window length (p) to ex-amine the consistency of the scores. The numerical illustration that defines the application of window analysis is:
Formula Application
No. of windows w = k – p + 1 , w = 20 – 5 +1 = 16 No. of DMUs in each window = np /2 , 13 x 5 / 2 = 32.5
No. of different DMUs = np (k – p + 1), 13 x 5 (20 – 5 +1) = 1040
Since this study covers a twenty-year period (k=20), substantial differ-ences can be expected in state governments because there would have been a lot of changes in the laws and policies, technology employed and other struc-tural changes in the market place in that period. The window length (width or p) is selected on a trial and error basis, so a five- year window (width = 5) was found to be appropriate as it coincides with the five year-duration of econom-ic planning followed in the New Economic Policy (NEP). A different set of data is made for each window and each state is represented as a different DMU at each interval of five successive years. Thus, following Pjevcevic et al. (2011), the results of various DMUs per five-year window are derived to measure differences in efficiency-performance of states. With this method, the performance of DMU in one period is compared not only with the perfor-mance of other DMUs but also with its own perforperfor-mance in other periods. Sixteen windows are represented as sixteen rows per one state based on w = k- p +1. The test was conducted on variable return to scale (VRS) where a rise in inputs is expected to result in disproportionate rise in outputs (Banker, Charnes, and Cooper 1984) because DMUs cannot operate optimally due to limited resources, imperfect competition and institutional issues.
As an extension of the DEA, Tobit panel data regression model is needed to identify the factors that influence technical efficiency in Malaysia. More importantly, it also identifies factors that attributable to the efficiency in MPF. The two output variables in the DEA model are state revenue and pri-vate investment. In this regression model, the average efficiency levels of thirteen states in Malaysia over the twenty years (1990-2009) are treated as the dependent
variable (EFF), while FD, lnCAPEX, lnOPEREX, lnSGDPPC, lnEXPPC and LESSDUM are the independent variables.
A variety of regression techniques have been applied in the second stage to estimate the impact of contextual factors on efficiency, including the ordi-nary least squares (OLS) and the maximum likelihood (ML) based probit, logit, and truncated regression (Tobit). A debate has been ranging between two views over the statistical properties of the two-stage DEA estimator. Si-mar and Wilson (2007) argue that because DEA output scores are biased and contextual/ environmental variables are correlated to output and input varia-bles, the conventional statistical inferences are invalid in the second-stage regression, and recommend use of bootstrap methods.
On the other hand, Ramalho et al.(2010), McDonald (2008) and Ruggiero (2004) have argued that econometric models such as probit, logit, and truncated regression (To-bit) can be used for second-stage estimation of the impact of contextu-al/environmental variables on efficiency. Afonso and Aubyn (2011) argue that “Even if Tobit results are possibly biased, it is not clear that bootstrap estimates are necessarily more reliable, based on a set of assumptions con-cerning the data generation process and the perturbation term distribution that may be distributed (p.1429).” In their empirical study, the censored normal Tobit results and bootstrap algorithms yielded very similar results. We esti-mated the Tobit model (or censored normal regression model) because DEA efficiency estimates are bounded between 0 and 1.
In the Tobit model, for computational convenience it is preferable to as-sume a censoring point at zero (Greene 1993). The Tobit model is formulated as follows (McDonald and Moffit 1980):
y* = βixi + εi
yi = yi* if yi* >0
yi = 0 if yi* ≤0 i=1,2,…,N (2)
where: N is the number of observations; yi is the observed inefficiency score, i.e. dependent variable; y* is the latent dependent variable; βi is the kx1 vector of unknown parameters; x1 is the kx1 vector of explanatory/independent variables; and εi is an independently distributed error term assumed to be normal with zero mean and constant variance σ2.
Some relevant institutional and operating environment variables were omitted due to the dearth of data. Therefore, the estimated empirical model was:
Eff=α+β1FD+β2CAPEX+β3OPREX+β4SGDPPC+ β5EXPPC+β6LESSDUM+ εi (3) where: EFF is the efficiency score; FD is the degree of fiscal decentralization from the revenue dimension which has the advantage of incorporating the aspect of tax collection in fiscal decentralisation (Ebel and Yilmaz 2003; Fisman and Gatti 2000; Davoodi and Zou 1998); CAPEX is the capital ex-penditure; OPREX is the operating expenditure; SGDPPC is state gross do-mestic income per capita; EXPPC is expenditure per capita; LESSDUM is less developed state dummies; α is the intercept term; β1 is the vector of un-known parameters or coefficients; and ε1 is the stochastic/random error term. The magnitude of likelihood for each factor determinant is measured by the marginal effect and relevant factors are identified according to the degree of significance (z-ratio). As Tobit panel data model is inherently
non-linear in the coefficients, its estimated parameter does not by themselves respect mar-ginal effects of the explanatory variable on the dependent variable.
RESULTS AND DISCUSSION
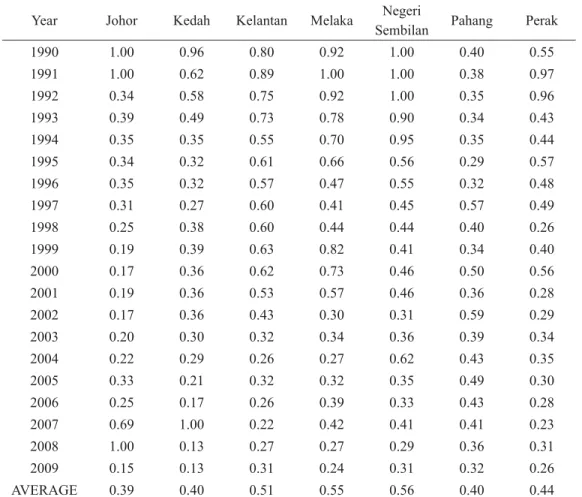
Table 1a and 1b compile the results of the window analysis for seven and six Malaysian’s states respectively where technical efficiency scores have been calculated as the average score in each window year. The VRS efficiency score represents pure technical efficiency, which is a measure of efficiency without scale efficiency (Avkiran 2001). The states that have an efficiency score of 1.00 or 100% are considered to be efficient and they lie on the effi-cient frontier. A higher technical efficiency score indicates a higher spending efficiency level or can be simply interpreted as a better allocation efficiency of fiscal resources by state governments. The results for both Tables (Table 1a and Table 1b) show that the average efficiency level for all states in Ma-laysia was less than 1.00 with fluctuating trends over the twenty year period (1990-2009).
Table 1a. Technical Efficiency In Malaysia’s States 1990-2009 INPUT Indicators: (1) Capital Expenditure, (2) Current Expenditure
OUTPUT Indicators: (1) State Government Revenue, (2) Private Investments
Year Johor Kedah Kelantan Melaka SembilanNegeri Pahang Perak
1990 1.00 0.96 0.80 0.92 1.00 0.40 0.55 1991 1.00 0.62 0.89 1.00 1.00 0.38 0.97 1992 0.34 0.58 0.75 0.92 1.00 0.35 0.96 1993 0.39 0.49 0.73 0.78 0.90 0.34 0.43 1994 0.35 0.35 0.55 0.70 0.95 0.35 0.44 1995 0.34 0.32 0.61 0.66 0.56 0.29 0.57 1996 0.35 0.32 0.57 0.47 0.55 0.32 0.48 1997 0.31 0.27 0.60 0.41 0.45 0.57 0.49 1998 0.25 0.38 0.60 0.44 0.44 0.40 0.26 1999 0.19 0.39 0.63 0.82 0.41 0.34 0.40 2000 0.17 0.36 0.62 0.73 0.46 0.50 0.56 2001 0.19 0.36 0.53 0.57 0.46 0.36 0.28 2002 0.17 0.36 0.43 0.30 0.31 0.59 0.29 2003 0.20 0.30 0.32 0.34 0.36 0.39 0.34 2004 0.22 0.29 0.26 0.27 0.62 0.43 0.35 2005 0.33 0.21 0.32 0.32 0.35 0.49 0.30 2006 0.25 0.17 0.26 0.39 0.33 0.43 0.28 2007 0.69 1.00 0.22 0.42 0.41 0.41 0.23 2008 1.00 0.13 0.27 0.27 0.29 0.36 0.31 2009 0.15 0.13 0.31 0.24 0.31 0.32 0.26 AVERAGE 0.39 0.40 0.51 0.55 0.56 0.40 0.44
The efficiency levels were even worse during the economic crises in 1997-1998 and in 2008-2009 and decreased significantly in those times1. The results for the efficiency level for
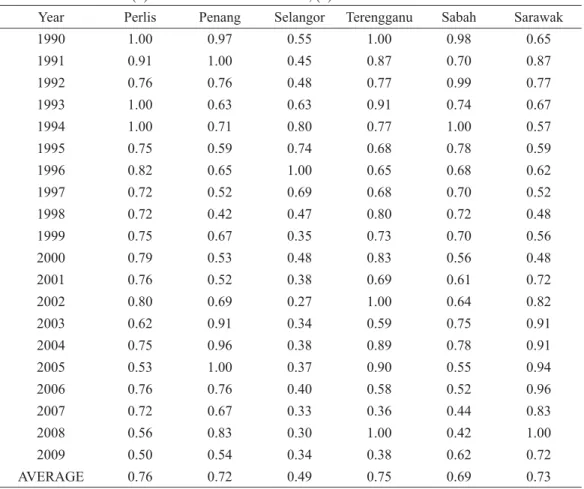
each state are mixed, but overall the aver-age efficiency level for thirteen states was around 0.56 or 56%, which can also be interpreted as 44% shortfall with reference to the efficiency frontier. Among the developed states (Selangor, Penang, Johor, Melaka, Negri Sembilan and Perak), surprisingly, Selangor which is known as the richest state in the country, had an average efficiency level around 0.49 over the twenty years and this level has not surpassed 0.5 since 1997. Johor was the most inefficient compared to other states as it had an average around 0.39. In contrast, Penang appeared to be the most efficient among the states as the efficiency level was an average of 0.72, followed by Negri Sembilan and Melaka (0.56 and 0.55 respectively).
Table 1b. Technical Efficiency In Malaysia’s States 1990-2009 INPUT Indicators: (1) Capital Expenditure, (2) Current Expenditure
OUTPUT Indicators: (1) State Government Revenue, (2) Private Investments
Year Perlis Penang Selangor Terengganu Sabah Sarawak
1990 1.00 0.97 0.55 1.00 0.98 0.65 1991 0.91 1.00 0.45 0.87 0.70 0.87 1992 0.76 0.76 0.48 0.77 0.99 0.77 1993 1.00 0.63 0.63 0.91 0.74 0.67 1994 1.00 0.71 0.80 0.77 1.00 0.57 1995 0.75 0.59 0.74 0.68 0.78 0.59 1996 0.82 0.65 1.00 0.65 0.68 0.62 1997 0.72 0.52 0.69 0.68 0.70 0.52 1998 0.72 0.42 0.47 0.80 0.72 0.48 1999 0.75 0.67 0.35 0.73 0.70 0.56 2000 0.79 0.53 0.48 0.83 0.56 0.48 2001 0.76 0.52 0.38 0.69 0.61 0.72 2002 0.80 0.69 0.27 1.00 0.64 0.82 2003 0.62 0.91 0.34 0.59 0.75 0.91 2004 0.75 0.96 0.38 0.89 0.78 0.91 2005 0.53 1.00 0.37 0.90 0.55 0.94 2006 0.76 0.76 0.40 0.58 0.52 0.96 2007 0.72 0.67 0.33 0.36 0.44 0.83 2008 0.56 0.83 0.30 1.00 0.42 1.00 2009 0.50 0.54 0.34 0.38 0.62 0.72 AVERAGE 0.76 0.72 0.49 0.75 0.69 0.73
Note: Efficiency scores are within the range of 0 to 1, with 1 means the most efficient
It is often assumed that developed states are more competent in man-aging their fiscal allocation due to their strengths in human resources, man-agement system and technologies.
1 During the financial crises, there were greater constraints on fiscal resources resulting from lower revenue and limited
transfers from the federal government. At the same time, the need for spending kept increasing which led to cut in capital expenditure that was allocated for supporting critical infrastructures. As a result, private investment and state resources de-clined as state became less competitive.
They are also expected to have a higher productivity of public capital investments because of economies of scale and positive externalities driven by them (Tirtosuharto 2009). These figures pro-vide evidence that more developed states have weak incentives and low de-centralization in planning an effective strategy and priority to utilize their fiscal resources to support development. This could be the case with a state like Selangor which has had little incentive.
In order to achieve high efficiency despite achieving high growth and better local economic performance compared to other states. Being the clos-est to the capital city of Kuala Lumpur and administration center Putrajaya, Selangor shares land and developments with federal government. It has bene-fitted from many federal government projects and attracts many foreign in-vestors as well as highly skilled and educated labors. But, Selangor was among the least efficient states indicating that more expenditure for the state also created more room for fiscal leakages and misallocation of resources and inefficiencies.
The situation is again similar to that found in Indonesia by Tirtosuharto (2009) where resource-rich states were not always more efficient as higher levels of state spending leads to higher levels of inefficiency. In the case of less-developed states (Pahang, Kedah, Kelantan, Perlis, Terengganu, Sabah and Sarawak)2, three oil-producing states with high revenue were
more effi-cient than other states in Malaysia, with Terengganu being the highest with 0.75 followed by Sarawak 0.73 and Sabah 0.69. Kelantan, which is considered the poorest state, has an average efficiency level of 0.51 that is almost equivalent to other states. Despite being ruled by the opposition party for more than two decades, Kelantan has managed to allocate their resources as efficiently as other state governments, even under the constraint of possible hostility and discrimination from the federal government, which has been alleged in the past. Surprisingly, Perlis, which is known to have fewer re-sources, was the most efficient state in Malaysia with an average efficiency level of 0.76 over the twenty years and scored 1.00 three times in the 1990s. Perlis seems to have had the capability to allocate expenditure and resources to productive investments that contribute to the growth of the private sector and the market economy at the state level. Sabah and Sarawak (Borneo states) have a special position in the Federal Constitution (Jalil 2008) and have been devolved more resources with special grants and more responsibilities com-pared to other states in Peninsular Malaysia, so it seems inappropriate to make any comparison between them and other states.
All of the oil-producing states actually enjoyed 5% petroleum royalties from the federal government giving them more revenue to spend on their de-velopment. Specifically, Terengganu managed to achieve full efficiency level of 1.00 in 1990 and 2002, indicating that the capital expenditure was effi-ciently allocated and the cost of operating expenditure successfully mini-mized. With the advantage of being one of the highest revenue recipient states, Terengganu had more incentives to expand its scope of expenditure that could address specific needs of its people, deliver basic public services and maintain state‘s assets. The results are inconclusive, so that the level of state efficiency will be determined by the state‘s fiscal capacity is not proved by the data. This is consistent with the findings of Tirtosuharto (2009) in In-donesia who also found that not all developed states are efficient and not all less developed states are inefficient. The results have shown that in a central-ized system, the federal government has
2 These states have lower real SGDP than the developed states that are located in the west coast of Peninsular Malaysia.
This was caused by the lag of development and the fact that states in eastern region (except for Kedah and Perlis are in northern region) are geograph-ically and historically disadvantages.
failed to address specific needs of each state resulting in low efficiency level, the decrease in the efficiency and effectiveness of state resource allocations. Therefore, the findings support the importance of fiscal decentralization for fulfilling the requirements of MPF theory.
In general, under the current system of fiscal federalism, all states, whether more or less developed, are not able to utilize their abundant fiscal resources efficiently. Some states that are rich in resources have a tendency to spend more in proportion to their large fiscal capacity which leads to higher level of efficiency. It can be concluded that the efficiency of different states can fluctuate over time to different extents, and as a whole, the efficiency levels in state governments had no improvement over the twenty year period. Lack of competitiveness among the state governments from greater centrali-zation is identified as the primary factor of the low efficiency level. Indeed, less fiscal competition discourages spending on public inputs, including spending to attract mobile labor and capital, as found in a study on German counties by Borck (2005). Limited revenue resources as well as soft budget constraint are among the factors that demotivate them, especially their state officials, from becoming more innovative and efficient in allocating their resources. Thus, fiscal leakages due to corruption or rent seeking behavior would arise as a result of failure to satisfy the MPF requirements, particularly, decentralization in economic authority and hard budget constraints.
Table 2, the results of Tobit panel data regression reveal the factors that determine the technical efficiency of the state governments. The average ef-ficiency levels of thirteen states in Malaysia over the twenty years (1990-2009) are treated as the dependent variable (EFF), while FD, lnCAPEX, lnOPEREX, lnSGDPPC, lnEXPPC and LESSDUM are the independent varia-bles.
Table 2. Determinants of state technical efficiency in Malaysia, 1990- 2009
Dependent Variable: EFF N*T = 260 Observations (13 States)
Variables Coefficient z-ratio Marginal
FD (Fiscal Decentral-ization) 0.182 3.280*** 0.182
lnCAPEX (Capital Expenditure) -0.108 -4.640*** -0.107
lnOPREX (Operating Expenditure) 0.005 0.230 -0.005
lnSGDPPC (Real SGDP Per capita) 0.037 0.860 0.037
lnEXPPC (Expendi-ture Per capita) 0.134 3.340*** 0.134
LESSDUM (Less Developed State Dummies) 0.063 1.400 0.062
Constant 1.222 -
-Log-Likelihood -20.183
Wald Chi2 44.25
Note: *** denotes significance at 1% level, ** for 5% level and * for 10% level. Instead, the marginal effects are functions of both the parameters and the data (Wooldridge 2006; McDonald and Moffit 1980).
In the Tobit panel data regression model, the magnitude of likelihood for each factor determinant is measured by the marginal effect and relevant fac-tors are identified according to the degree of significance (z-ratio). As Tobit panel data model is inherently non-linear in the coefficients, its estimated parameter does not by themselves respect marginal effects of the explanatory variable on the dependent variable. All the coefficients in the model, except for
real SGDP per capita (SGDPPC), operating expenditure (OPREX) and less developed state dummies (LESSDUM), are significant at the 1% level.
This reveals that technical efficiency is influenced by all the remaining determinants and confirms the robustness of the twenty year observations model for identifying these factors. The coefficient FD has a positive sign with the highest marginal effect of 0.182 and significant at 1% level indicat-ing that fiscal decentralization is the most important factor for the technical efficiency level compared to other factors. This demonstrates that when state governments are given the opportunity to determine their spending according to their needs and priorities, they avoid unnecessary spending and achieve higher efficiency. This advantage is consistent with MPF literature which stipulates that devolution of fiscal freedom to states provides them the incen-tives to allocate their fiscal resources efficiently.
From the dimension of revenue, states that are able to generate their own revenue/ have extra revenues tend to not be dependent on federal government transfers, for example, the oil producing states are more likely to be more efficient in managing the level of fiscal decentralization (see Table 1a and Table 1b, DEA results). In addition, higher fiscal decentralization implies that states‘ administrators could become more responsible to ensure that more revenues can be generated for state budgets, particularly in generating reve-nues to close the fiscal gap in their budget. More importantly, local revenue generation makes local governments more responsive to citizens, reduces corruption and increases the incentives to provide market enhancing public goods as claimed by the Second Generation of Fiscal Federalism Theories (SGFF) (Weingast 2009). Therefore, the result demonstrates that fiscal decen-tralization provides incentives for states to become more efficient in allocat-ing fiscal resources.
The results for productive spending as proxied by capital expenditure (CAPEX) is negative and significant at 1% level, which means that it is likely to reduce the technical efficiency level. Productive spending (capital ex-penditure) is an important variable indicating the ability of states to allocate resources efficiently for public welfare and long term development. Since capital expenditure (CAPEX) shows negative association, this could mean that there are leakages in capital spending and the state governments have no proper spending in allocating the resources in the states. This is reflected in the case of Selangor which has been endowed with many development pro-jects, but has low efficiency level due to inefficiencies in the allocation of capital expenditure. Therefore, productive spending shows unexpected in-verse correlation than the assumption of productive spending leads to higher level of state efficiency. Generally, effective spending is assumed to indicate the ability of the state in allocating resources sufficiently, particularly for public welfare and long term development. The model demonstrates that the level of expenditure per capita is positively associated with technical effi-ciency level. The level of spending per capita (EXPPC) has a positive mar-ginal effect and is significant at 1% level.
Lastly, SGDPPC, OPREX and LESSDUM variables have neutral effects on the increase in technical efficiency score. The results for the less devel-oped states‘ dummy variable (LESSDUM) indicate that there are no differ-ences in terms of technical efficiency levels between states (developed and less developed) despite variances in the capability and capacity of state to manage fiscal affairs and public capital investments. This validates the find-ing in the
last section which shows that efficiency is not related to the devel-opment level of the state and also means that a separate panel model for less developed states is not needed in this analysis. In conclusion, fiscal decentral-ization is an important determinant of technical efficiency in Malaysia. It could provide incentives to state governments to become more competitive and more efficient.
The results of DEA reveal evidence of the inefficiency of Malaysian state governments particularly from the aspect of public expenditure. In this case, Malaysia‘s centralized fiscal federalism system has been unable to create a competitive environment among Malaysian state governments resulting in low levels of efficiency in Malaysian states. The dependency of states on the federal government for transfers/grants or soft budget constraints has encour-aged improper fiscal discipline in the states as they spend money without hav-ing responsibility to raise additional own revenue. However, this analysis does not capture other causes of inefficiencies such as corruption or rent-seeking behavior that might take place in the system due to less state gov-ernment incentives. The Tobit panel data regression identified many determi-nants of state efficiency. State governments which have failed to mobilize their tax potentials to the maximum and continue to rely on federal grants/transfers 247 show lower efficiency. Federal grants/transfers may stimulate more spending by state governments leading them to increase their spending beyond their means, engage in more corruption, provide non-remunerative benefits to interest groups and give endless subsidies to ineffi-cient enterprises. These tests provide evidence that fiscal decentralization with hard budget constraints can improve state efficiency levels.
POLICY IMPLICATIONS AND CONCLUSION
One policy that can raise state efficiency levels is the decision to allow states to generate their own revenues (strengthening fiscal capacities). States' finances need to be strengthened to minimize states' dependence on the center for funds. It is necessary to reassign independent sources of revenue to the state for strengthening a state finances. By appropriate reassignment of feder-ally controlled taxes to states, states would be guaranteed a stable revenue inflow. Certain taxes, particularly those taxes that are localized in nature, are better assigned to the states as states can manage and collect them more effi-ciently. Among revenue sources which could be reassigned to the state based on this principle are property tax, stamp duties, and road tax (tax on vehicles) as well as production and consumption taxes as such excise duties, sales and service taxes (Musgrave 1983). Since land matters are the responsibility of the states, any taxes related to landed property, such as estate duty, real prop-erty gains tax and stamp duty on land transfers, are appropriately assigned to the states, with policy determined by the federal authority for uniformity pur-poses. The respective state governments could then determine their own tax rates, depending on prevailing local economic preferences.
It is important to support policies that promote good governance. These policies should encourage transparency, accountability and the rule of law. In many developing countries, one factor that has negatively influenced the effi-ciency and productivity of public capital
expenditure is corruption and rent-seeking activities 3. State institutions should have strong
good governance policies in place, otherwise decentralization will not be effective 4.
Growth policies at the state level should take into consideration the in-vestment needs of the private sector. Private capital investment at the state level is affected by labor and population growth in addition to public goods and services that are provided by the state. From the supply side, skilled labor is a key production input for firms and enterprises. From the demand side, the private sector‘s decision to invest is driven by population growth, which ulti-mately determines what and where to produce.
Here, our findings echo the main argument of Market Preserving Federal-ism (MPF) theory that states become more efficient if more power is de-volved to them whilst ensuring that they spend within their fiscal capacity. When the federal government loosens the constraints on states, states have the incentive to become innovative and competitive, and fiscal independence and economic growth can be improved significantly. More importantly, the im-portance of grants will be diminished, but fiscal responsibility and fiscal ac-countability will be increased. Malaysia also needs to take rigorous steps to improve state governments efficiency level through the system of fiscal de-centralization and incentives proposed by the MPF theory.
REFERENCES
Abd Ghani, Judhiana. (2014). Market Preserving Federalism: Implications for Malaysia (Doctoral dissertation). VISES, Victoria University, Melbourne, Australia.
Afonso, A, M. Aubyn. (2011). Assessing health efficiency across countries with a two-step and bootstrap
analysis. Applied Economics Letters, 18(15):1427–1430.
Al Eraqi, A.S., A.Mustafa and A.T. Khader. (2010). An Extended DEA windows analysis: Middle East and East African seaports. Journal of Economics Studies, 37(2):208-218.
Arrow, K.J. (1970). Social Choice and Individual Values, New York: Yale University Press.
Aschauer, D. (1989). Is public expenditure productive? Journal Of Monetary Economics, 23(2):177–220. Avkiran, N.(2001). Investigating technical and scale efficiencies of Australian universities through Data
Envelopment Analysis. Socio-Economic Planning Sciences, 35(1):57-80.
Banker, R.D, A. Charnes and W.W. Cooper. (1984). Some models for estimating technical and scale inefficiencies in Data Envelopment Analysis. Management Science, 30(9):1078-1092.
Bardhan, P. (2002). Decentralization of governance and development. Journal of Economic Perspectives,
16(4):185-205.
Barro, R. J. (1990). Government spending in a simple model of endogenous. Journal of Political
Economy, 98(5):102-125.
Borck, R. (2005). Fiscal competition, capital–skill complementarity, and the composition of public spending. Finanz Archif / Public Finance Analysis, 61 (4):488-499.
3 These illegal activities increase transaction costs and cause the regions to be less competi-tive. The role
of institutions is important and cannot be considered as an exogenous factor anymore since it determines the quality of institutions and development process as a whole (Bodmer, Kobler, and Borner 2004)
4 In a democratic system, decentralization should ensure the accountability of state govern-ment as demanded by the
Borner, S., F. Bodmer and M. Kobler. (2004). Institutional efficiency and its determinants: The role of
political factors in economic growth. OECD Devel-opment Centre, Paris.
Brennan, G., and J. Buchanan. (1980). The Power to Tax: Analytical Federalism of a Fiscal Constitution.
New York : Cambridge University Press.
Buchanan, J. (1950). Federalism and fiscal equity. The American Economic Review, 40(4):583-599. Charnes, A., W.W. Cooper and E. Rhodes. (1978). Measuring the inefficiency of decision making units.
European Journal of Operational Research, 2:429- 444.
Charnes, A., W. Cooper and B. Gorlany. (1985). Foundation of Data Envelopment Analysis for Pareto-Koopmans efficient empirical production. Journal of Economics, 30:91-107.
Davoodi, H., and H. Zou. (1998). Fiscal decentralisation and economic growth: A cross- country study.
Journal of Urban Economics, 2(43):244-257.
Dollery, B. (2002). A century of vertical fiscal imbalance in Australian federalism. History of Economic
Review, 36:26-43.
Ebel, R., and S. Yilmaz. (2003). Fiscal decentralization in developing countries: Is it happening? How do we know?. In: J. Alm and J. Martinez-Vazquez (Eds.), Studies in fiscal federalism and state-local
finance. Cheltenham, UK: Edward Elgar Press.
Farrel, M. (1957). The measurement of productivity efficiency. Journal of the Royal Statistical Society,
120(3):253-290.
Fisman, R. and R. Gatti. (2000). Decentralization and corruption: cross country and cross- state evidence,
World Bank. Prem Advisory.
Greene,W.H. (1993). Econometric analysis. New York: Macmillan.
Grewal, B. and P. Sheehan. (2004). Understanding the evolution of constitutional federalism: the case of Australia. Public Finance and Management, 4(4):559-91.
Herrera, S. and G. Pang (2005). Efficiency of public spending in developing countries: An efficiency frontier approach. World Bank Policy Research Working Paper No. 3645. Washington: World Bank. Jalil, A.Z.A. (008). Decentralization, subnational governments' behavior and macroeconomic instability:
The case of Malaysia (Doctoral dissertation). Centre d' Etudes de Recherches sur le Developpement
International, Université d' Aurvergne, Clermont- Ferrand.
Jin, H., Y. Qian and B.R. Weingast. (2005). Regional decentralization and fiscal incentives: Federalism,
Chinese style. Journal of Public Economics, 89(9):1719-42.
Jin, J. and H.-F. Zou. (2001). How does fiscal decentralization affect aggregate, national, and subnational government size?. Journal of Urban Economics, 52: 270-293.
Loehr, W. and R. Manasan. (1999). Fiscal decentralization and economic efficiency: Measurement and
evaluation, Manila:USAID.
Martinez-Vazquez, J., and R. McNab. (1997). Fiscal decentralization, economic growth, and democratic
governance. International Center for Public Policy Working Paper Series, at AYSPS, GSU paper 970.
Atlanta: International Center for Public Policy, Andrew Young School of Policy Studies, Georgia
State University.
McDonald, J.F. and R.A. Moffit. (1980). The uses of Tobit analysis. The Review of Economics and
McDonald, J. (2009). Using least squares and Tobit in second stage DEA effi-ciency analyses. European
Journal of Operational Research, 197:792–798.
McNab, R. M. (2001). An empirical examination of the outcomes of fiscal decentralisation. Andrew
Young School of Policy Studies, Georgia State University.
Ministry of Finance, Malaysia. (1991). Economic Report 1991/1992. Kuala Lumpur: Government Printer. ———, Malaysia. (1993). Economic Report 1993/1994. Kuala Lumpur: Government Printer. ———, Malaysia. (1995). Economic Report 1995/1996. Kuala Lumpur: Government Printer. ———, Malaysia. (1996). Economic Report 1996/1997. Kuala Lumpur: Government Printer. ———, Malaysia. (1997). Economic Report 1997/1998. Kuala Lumpur: Government Printer. ———, Malaysia. (1998). Economic Report 1998/1999. Kuala Lumpur: Government Printer. ———, Malaysia. (1999). Economic Report 1999/2000. Kuala Lumpur: Government Printer. ———, Malaysia. (2000). Economic Report 2000/2001. Kuala Lumpur: Government Printer. ———, Malaysia. (2001). Economic Report 2001/2002. Kuala Lumpur: Government Printer. ———, Malaysia. (2003). Economic Report 2002/2003. Kuala Lumpur: Government Printer. ———, Malaysia. (2011). Economic Report 2010/2011. Kuala Lumpur: Government Printer. ———, Malaysia. (2012). Economic Report 2011/2012. Kuala Lumpur: Government Printer. ———, Malaysia. (2013). Economic Report 2012/2013. Kuala Lumpur: Government Printer.
Munnell, A.H. (1992). Policy watch: infrastructure investment and economic growth. The Journal of
Economic Perspectives, 6(4):189-198.
Musgrave, R.A. (1959). The theory of public finance. New York: McGraw-Hill New York.
Musgrave, R.A. (1983). Who should tax, where, and what?. In: McLure, C.E. (Eds.),Tax assignment in
federal countries. Canberra: Centre for Research on Federal Financial Relations, Australian National
University.
North, D.C. (1995). The new institutional economics and third world devel-opment. In: John Harriss, Janet Hunter and Colin M.Lewis (Eds.), The new institutional economics and third world development.
London and New York: Routledge.
Oates, W.E., and R.M. Schwab. (1996). The theory of regulatory federalism: The case of environmental management. In: O. Wallace (Eds.), The economics of environmental regulation (pp. 319-331).
London, UK: Edward Elgar.
Pjevcevic, D., A. Radonjic, Z. Hrle, and V. Colic (2011). DEA window analysis for measuring port efficiencies in Serbia. Traffic Management Review 24, (1):63-72.
Prud'homme, Remy. (1995). The dangers of decentralization. The World Bank Research Observer,
10(2):201-220.
Qian, Y., and B. R. Weingast. (1997). Federalism as a commitment to perserving market incentives. The
Journal of Economic Perspectives, 11(4) :83-92.
Qian, Y. (1999). The institutional foundations of China’s market transition. Working Paper, Palo Alto: Stanford University.
Rao, G.M. (2003). Fiscal decentralization in China and India: A comparative perspective. Asia-Pacific
Development Journal, 10(1):25-45.
Ramalho E.A., J.J.S. Ramalho, P.D. Henriques. (2010). Fractional regression models for second state DEA efficiency analyses. Journal of Product Analysis, 34(3):239–255.
Rayeni, M. M. (2012). A study on benchmarking based on window analysis. International Journal of
Business and Management Tomorrow, 2(4):1-7.
Ruggiero, J. (2004). Data envelopment analysis with stochastic data. Journal of the Operational Research
Society, 55:1008–1012.
Siebert, H. (1996). On the concept of locational competition. Kiel Working PaperNo. 731, Kiel.
Solow, R. M. (2000). Growth theory: An exposition. Oxford: Oxford Univer-sity Press.
Tanzi, V. (ed) (2000). Some Politically Incorrect Remarks on Decentralization and Public Finance,
Boston: Kluwer Academic Publishers.
Thanassoulis, E. (2001). Introduction to the theory and application of Data Envelopment Analysis.
Dordrecht: Kluwer Academic Publishers.
The National Audit Department Malaysia. (1991). General Audit Report 1990. Kuala Lumpur: Malaysia. ——— Malaysia.(1993). General Audit Report 1992. Kuala Lumpur: Malaysia.
——— Malaysia. (1995). General Audit Report 1994. Kuala Lumpur: Malaysia. ——— Malaysia. (1997). General Audit Report 1996. Kuala Lumpur: Malaysia. ——— Malaysia. (1999). General Audit Report 1998. Kuala Lumpur: Malaysia. ——— Malaysia. (2001). General Audit Report 2000. Kuala Lumpur: Malaysia. ——— Malaysia. (2003). General Audit Report 2002. Kuala Lumpur: Malaysia. ——— Malaysia.(2005). General Audit Report 2004. Kuala Lumpur: Malaysia. ——— Malaysia. (2007). General Audit Report 2006. Kuala Lumpur: Malaysia. ——— Malaysia. (2009). General Audit Report 2008. Kuala Lumpur: Malaysia. ——— Malaysia. (2010). General Audit Report 2009. Kuala Lumpur: Malaysia.
Tiebout, C. (1956). A Pure Theory of Local Expenditures. Journal of Political Economy, 64:416-424. Tirtosuharto, D. (2009). Regional competitiveness in Indonesia: the Incen-tives of fiscal decentralization
on state efficiency and economic growth (Doc-toral dissertation). George Mason University, Fairfax,
VA. United States: UMI Dissertation Publishing.
Thieben, U. (2003, August). Fiscal decentralization and economic growth in high income OECD
countries. Paper presented at the 18th Annual Congress of the European Economic Association,
SE-Stockholm.
Weingast, B.R. (2009). Second generation fiscal federalism: The implications of fiscal incentives. Journal
of Urban Economics, 6:279–293.
Wooldridge, J.M. (2006). Introductory econometics: A modern approach. Mason: Thomson