JIA, G., MILLER, P., HONG, X., KALUTARAGE, H. and BAN, T. 2019. Anomaly detection in network traffic using dynamic
graph mining with a sparse autoencoder. In Proceedings of
18th Institution of Electrical and Electronics Engineers
(IEEE) International trust, security and privacy in computing and communications conference
, co-located with
13th
Institution of Electrical and Electronics Engineers (IEEE) International big data science and engineering conference
(TrustCom/BigDataSE), 5-8 August 2019, Rotorua, New Zealand
. Piscataway: IEEE [online], pages 458-465. Available
from:
https://doi.org/10.1109/trustcom/bigdatase.2019.00068
Anomaly detection in network traffic using
dynamic graph mining with a sparse
autoencoder.
JIA, G., MILLER, P., HONG, X., KALUTARAGE, H. and BAN, T.
2019
This document was downloaded from
https://openair.rgu.ac.uk
© 2019 IEEE. Personal use of this material is permitted. Permission from IEEE must be obtained for all other
uses, in any current or future media, including reprinting/republishing this material for advertising or
promotional purposes, creating new collective works, for resale or redistribution to servers or lists, or reuse of
any copyrighted component of this work in other works.
Anomaly Detection in Network Traffic Using
Dynamic Graph Mining with a Sparse Autoencoder
Guanbo Jia, Paul Miller, Xin Hong
The Centre of Security Information Technologies,
Queen’s University Belfast, UK
Harsha Kalutarage
School of Computing Science and Digital Media, Robert Gordon University, UK
Tao Ban
Information Security Research Centre, National Institute of Information and Communications Technology, Japan
Abstract—Network based attacks on ecommerce websites can have serious economic consequences. Hence, anomaly detection in dynamic network traffic has become an increasingly important research topic in recent years. This paper proposes a novel dy-namic Graph and sparse Autoencoder based Anomaly Detection algorithm named GAAD. In GAAD, the network traffic over contiguous time intervals is first modelled as a series of dynamic bipartite graph increments. One mode projection is performed on each bipartite graph increment and the adjacency matrix derived. Columns of the resultant adjacency matrix are then used to train a sparse autoencoder to reconstruct it. The sum of squared errors between the reconstructed approximation and original adjacency matrix is then calculated. An online learning algorithm is then used to estimate a Gaussian distribution that models the error distribution. Outlier error values are deemed to represent anomalous traffic flows corresponding to possible attacks. In the experiment, a network emulator was used to generate representative ecommerce traffic flows over a time period of 225 minutes with five attacks injected, including SYN scans, host emulation and DDoS attacks. ROC curves were generated to investigate the influence of the autoencoder hyper-parameters. It was found that increasing the number of hidden nodes and their activation level, and increasing sparseness resulted in improved performance. Analysis showed that the sparse autoencoder was unable to encode the highly structured adjacency matrix structures associated with attacks, hence they were detected as anomalies. In contrast, SVD and variants, such as the compact matrix decomposition, were found to accurately encode the attack matrices, hence they went undetected.
Index Terms—anomaly detection, network traffic, network security, bipartite graph, sparse autoencoder, dynamic graph
I. INTRODUCTION
In recent years, the Internet has become indispensable in many aspects of daily life. However, modern society’s depen-dency on the Internet means that attacks exploiting security vulnerabilities can have enormous impact in terms of cost. Currently, new widespread security breaches break out on a monthly basis [1]. Incidents caused by malware such as Mirai, Heartbleed and WannaCry attacks, have a significant media profile and security breaches of large companies, including Sony Pictures and Yahoo, have brought cyber security front and centre to the public view.
For the ecommerce industry, website security is a par-ticularly important topic. Online retail stores are becoming ubiquitous, with almost 400 billion dollars being spent online in the US alone. Research has shown that 79% of American adults have used ecommerce sites. Among people under the
age of 30 that number is even higher: 90% have bought something online and 77% have used their mobile phone for an ecommerce purchase. Furthermore, the scale of Distributed Denial of Service (DDoS) attacks has risen with the advent of the Internet of Things and the associated increase in connected devices.
One approach to detecting an attack, such as a DDoS attack on an e-commerce website, is to look for anomalous traffic patterns on a network. A network anomaly is a sudden and short lived deviation from the normal operation of a computer network. Some anomalies are deliberately caused by intruders with malicious intent, e.g., DDoS attacks and Port Scans [2], while others are caused by innocent incidents, such as network misconfiguration or equipment outages. Detecting both types of anomalies in near real-time is essential to keep the quality of the service. In the literature, various methods of differing complexity have been proposed for network traffic anomaly detection, ranging from simple volume based traffic analysis to packet header distribution analysis [3]. Most of these works are static and entropy based in which a traffic matrix is used to describe the statistical properties of the behaviour and entropy is used to reveal changes in distributions. And not all of these approaches are forensic and do not scale easily to large networks. To date, little work has been done to investigate the usefulness of deep learning in network traffic anomaly detection. Therefore, this work investigates the ability to employ dynamic and bipartite graphs [4] with a sparse autoencoder from deep learning [5] to detect anomalies in network traffic.
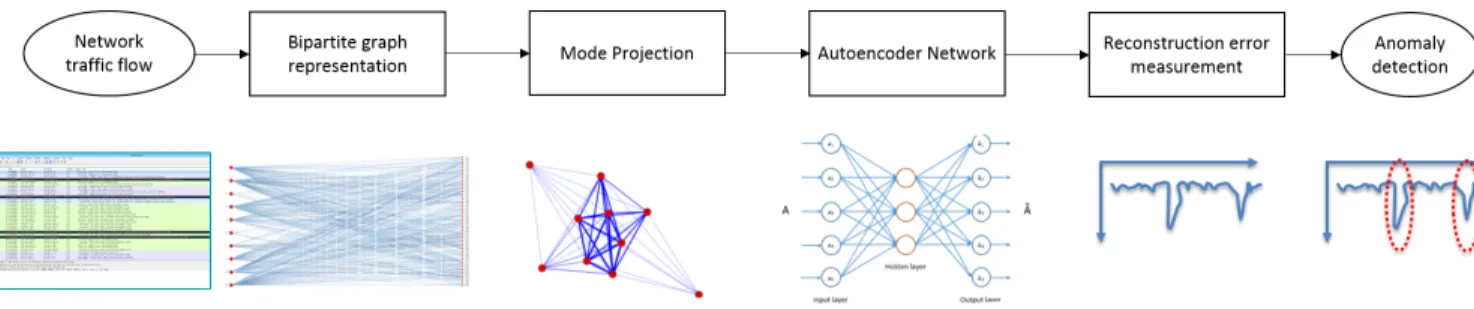
In order to detect anomalies in network traffic efficiently, we propose a dynamic Graph and sparse Autoencoder based Anomaly Detection algorithm named GAAD in the paper. GAAD first models the network traffic as a dynamic sequence of graphs with each representing the traffic flow over contigu-ous time increments. It considers each graph increment as a bipartite graph in which one partition is for internal nodes and the other partition is for external nodes in the network. Then, it adopts the one mode projection to compress information of the bipartite graph to generate a projected graph. After that, it employs a sparse autoencoder to compute an approximation to the adjacency matrix, and then calculate the sum of squared errors to detect the anomalous graph increments in the network traffic.
Fig. 1: Architecture of the proposed algorithm GAAD.
The rest of the paper is organized as follows. Section II provides a comprehensive review of the related literature and Section III gives a detailed description of the proposed algorithm. Moreover, the performance evaluation and analysis of the experimental results are presented from Section IV to Section VI. Finally, the paper is concluded in Section VII.
II. RELATEDWORK
A comprehensive survey of graph based anomaly detection algorithms has been provided by Akoglu et al. [3]. They devised a general framework for these algorithms and pre-sented some real-world applications across diverse application domains. Rashous et al. [6] gave an overview of anomaly detection methods for dynamic graphs. They described four types of anomalies and presented a general two-stage approach to detect anomalies in dynamic graphs. Dai et al. [7] unified both positive and negative mutual dependency relationships to model the complete set of anomalous behaviors of nodes of bipartite graphs in which an iterative method was designed to compute anomaly scores of nodes in the graph and its conver-gence was mathematically proven. Tong and Lin [8] proposed a non-negative residual matrix factorization algorithm to detect anomalies in graphs. They presented an optimization formu-lation tailored for graph anomaly detection and an effective technique linear to the size of the graph in order to solve the formulation. Bridges and Vaughn [9] developed a method that integrates fuzzy data mining techniques to include quantitative features and genetic algorithms in order to find the optimal parameters of the fuzzy functions used for detecting network anomalies. Salmen et al. [10] built two models based on both the firefly and genetic algorithms by using flow data such as bits and packets per second to detect network anomalies. Luo and Nagarajan [11] introduced autoencoder neural networks into wireless sensor networks and built a simple structure of autoencoder to exploit its powerful reconstruct-ability in order to solve the anomaly detection problem.
In Dromard et al. [12] presented an online and real-time unsupervised network anomaly detection algorithm which re-lied on a discrete time-sliding window to update continuously the feature space and an incremental grid clustering to rapidly detect anomalies in networks. Duan et al. [13] proposed an approach to scan sequentially outgoing messages by imple-menting the sequential probability ratio test to quickly detect
Fig. 2: A bipartite graph and one mode projection graph.
compromised machines in networks that were involved in the spamming activities. Ghanem et al. [14] proposed a hybrid approach for anomaly detection in large scale datasets using negative selection detector generation. Sun et al. [15] presented the compact matrix decomposition to compute sparse low-rank approximations of network adjacency matrices in which the reconstruction error between the original and approximated matrix was used to indicate whether the traffic flow was anomalous. Ahmed and Mahmood [16] proposed a partitional clustering technique for detecting collective anomalies which are data patterns caused when a group of similar data in-stances behave anomalously with respect to the entire dataset. Limthong [17] presented a method based on the combination of time series and feature spaces using machine learning algorithms to automatically detect network anomalies.
Bhuyan et al. [18] presented a tree based subspace clustering technique for finding clusters in intrusion data and for detect-ing unknown attacks without usdetect-ing any labelled traffic. Kim et al. [19] developed an online anomaly detection technique that considered the availability of traffic attributes during monitor-ing and computational scalability for streammonitor-ing data. Hoque et al. [20] proposed an intrusion detection system that employed a genetic algorithm to efficiently detect various types of network intrusions and used a standard benchmark dataset to mea-sure the system performance. Marti et al. [21] presented the Voronoi diagram based evolutionary algorithm which uses the Voronoi diagram to divide the input search space in abnormal or normal regions and applies a multi-objective approach considering the detection accuracy to evolve diagrams in order to conjointly optimize classification metrics for detecting the
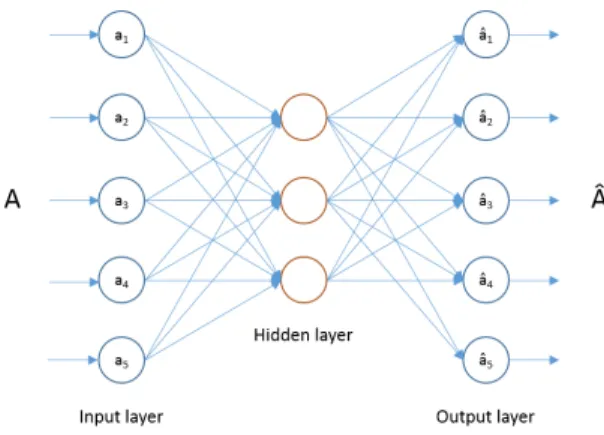
Fig. 3: Illustration of the sparse autoencoder.
anomalous network traffic. Cho and Shin [22] proposed a Voltage-based attacker identification algorithm to detect the attacker electronic control unit by measuring and utilizing voltages in the in-vehicle networks. Nasr et al. [23] presented a generic framework by introducing the idea of compressive traffic analysis to address the scalability of the exploding volumes of network traffic. Finally, Andrysiak et al. [24] used statistical relationships between the predicted and original network dataset to determine the anomalies in network traffic. In the paper, we propose the dynamic Graph and sparse Autoencoder based Anomaly Detection (GAAD) algorithm. In GAAD, we first model the network traffic as a dynamic sequence of graphs each of which represents traffic flow over contiguous time increments. Then, we consider each graph increment as a bipartite graph in which one partition is for internal nodes and the other partition is for external nodes in the network. In order to ensure scalability and near real-time operation, we adopt the one mode projection to compress information of the bipartite graph to generate a projected graph. Next, we derive the adjacency matrix of the projected graph which encodes traffic flow between nodes in the network. Subsequently, we employ a sparse autoencoder to compute an approximation to the adjacency matrix, and then calculate the sum of squared errors to detect anomalous graph increments in the network traffic. Common approaches for anomaly detection usually use spectral decomposition of the adjacency matrix. A disadvantage of these approaches is that they require singular value decomposition, which is not scalable to large network traffic flows. In addition, many approaches are batch-based which does not meet the need to have real-world applicability. Therefore, in GAAD we use the one mode projection to help reduce the size of the adjacency matrix to make it smaller and adopt the autoencoder to make it scalable. Moreover, we use the autoencoder to introduce regularisation constraints such as sparseness, which cannot be easily done within a spectral decomposition framework. Sparseness is desirable as it can greatly improve the efficiency of the algorithm, in terms of storage and processing, and is capable of improving the performance of the anomaly detection. Furthermore, we model the sum of squared errors
Fig. 4: The topology of the network traffic dataset.
as a unimodal Gaussian distribution. This allows us to use online incremental learning equations to efficiently estimate the mean and standard deviation in a streaming fashion, thereby facilitating real-time anomaly detection. Experimental results based on a network traffic dataset have demonstrated the proposed algorithm has good performance for anomaly detection in network traffic.
III. THEPROPOSEDALGORITHM
In this paper, we present the dynamic Graphs and sparse Autoencoder based Anomaly Detection (GAAD) algorithm for anomaly detection in network traffic. Its main procedures and architecture are shown in Algorithm 1 and Fig. 1 respectively.
Algorithm 1 The GAAD algorithm
Require: The network trafficN.
Model the network traffic N as a set of bipartite graph increments{G1, G2, ..., GT}.
fori= 1 :T do
Perform the one mode projection operation on Gi to
construct the graphGSi.
Compute the adjacency matrix Ai of the graph GSi.
Perform the sparse autoencoder to calculate the approx-imationAei of the adjacency matrixAi.
Compute the sum of squared errorsSSEi of the
adja-cency matrixAi and its approximation Aei.
Calculate the rateΦi of the graph GSi.
if Φi >1 then
Set the anomaly scoreASi = 1. else
Set the anomaly scoreASi = 0. end if
end for
Return The anomaly scoresAS.
A. One Mode Projection of Bipartite Graph
In GAAD, we first represent the network traffic flow at each time window t as a bipartite graph Gt = hVt, Et, Wti
with Vt = St ∪Dt, where St =
(a) (b)
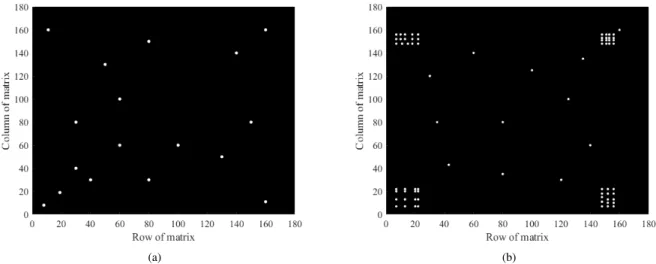
Fig. 5: Adjacency matrix for normal, (a), and DDoS, (b), traffic.
of internal nodes, Dt =
d1, ..., d|Dt| is a set of external
nodes, Et ⊂ St×Dt is a set of directed edges from the
internal nodes to the external nodes, and Wt = {wijt} is
a set of edge weights depending on the number of packets transmitted between the internal nodesi and the external node
dj. Then, we perform the one mode projection operation on
each graph Gt to construct its one mode projection graph
GSt = hVSt, ESt, WSti. In the projection graph, only the
projection of the internal nodes are considered, and the internal nodessiandsjare connected if and only if they are connected
with at least one common external nodedk, and their weights
are determined by the traffic flows among the internal nodes with their common external nodes in the network traffic. Then, the corresponding adjacency matrix of the projection graph is used and the boundary of adjacency matrix depends on the number of internal nodes. An example is illustrated in Fig. 2. By using the above one mode projection, we are able to reduce the size of the adjacency matrices of the projection graphs to make it scalable for anomaly detection in the network traffic.
B. Sparse Autoencoder
We employ the sparse autoencoder in deep learning to compute the approximation of the adjacency matrix of the obtained projection graph in GAAD. The sparse autoencoder [5] is an artificial neural network for unsupervised learning as a powerful tool for dimensionality reduction. Composed of an input layer, a hidden layer and an output layer, it aims to learn a compressed representation of the input data. For each obtained pojected graph, we perform the sparse autoencoder on the adjacency matrixAto generate its approximated matrix
e
A as follows. Given a graph increment G with n nodes and its adjacency matrix A, the matrix A is treated as the training set containing n instances {A1, A2, ..., An} where
Ai = {Aij}, j = 1,2, ..., n, and then the training set is fed
into the sparse autoencoder network to produce the output result. In the sparse autoencoder, we assume that xi is thei
-th input vector of -the input layer and its output vector in -the
output layer isyi=f(W2hi+b2)wherehi =f(W1xi+b1), Θ = {θ1, θ2} = {W1, b1, W2, b2} are parameters to be
learned, and f is the sigmoid function as the activations of the hidden layer and the output layer. Then, we construct a cost function by adding the reconstruction error between an inputxi and an outputyi with a regularization term:
J(θ) = n
X
i=1
kyi−xik2+βKL(ρ||ρb) (1)
whereβcontrols the weight of the sparsity penalty,ρis the de-sired average of the hidden layer activations,ρb=n1Pn
j=1hj
is the average of the hidden layer activations, and KL(ρ||ρb)
is defined as: KL(ρ||ρb)= |ρb| X j=1 ρlog ρ b ρj + (1−ρ) log 1−ρ 1−ρbj (2)
The above constructed cost function is optimized using the standard back-propagation algorithm. We use the output from the output layer as the new graph and treat its transposed adjacency matrix as the training set and then repeat the above training process to generate the approximated matrix of the adjacency matrix. An illustration of the sparse autoencoder is shown in Fig. 3.
C. Sum of Squared Errors
After having obtained the approximated matrix, we compute the sum of squared errorsSSE=P
i,j(A(i, j)−Ae(i, j))2to
measure the difference between the adjacency matrix A and its corresponding approximationAein GAAD.
D. Anomaly Detection
To detect anomalies in the network traffic, we assume that the distribution of the computed sum of squared errorsSSEt
of eacht-th graph increment is Gaussian for the normal traffic, and compute streaming estimates of its meanutand standard
Fig. 6: ROC curve with varying hs.
the learning rate and by convention is usually set to 0.01 [25]. After that, we calculate an anomaly score Φt by using
Equation (6) where k is a constant, and if the difference betweenSSEtand the meanutis greater thanktimes of the
standard deviation then the traffic is deemed as anomalous.
ut=µ×SSEt+ (1−µ)×ut−1 (3)
vart=µ×(SSEt−ut)2+ (1−µ)×vart−1 (4)
stdt= √ vart (5) Φt= |SSEt−ut| k×stdt (6)
IV. EXPERIMENTALEVALUATION
In this section, we evaluated GAAD using a network traffic dataset. All experiments were conducted on an Intel Core i7 platform, with CPU 3.4 GHz processor and 32.0 GB of memory. The operating system was Windows 10 and GAAD was implemented in MATLAB R2017(a).
A. Network Traffic Dataset
The network traffic dataset was acquired using a network emulation testbed with the NRL CORE tool [26]. The network topology is illustrated in Fig. 4. The testbed consists of internal and external networks, the former of which contains 38 virtual machines and a webserver which has apache installed and runs a Shopping Cart Solution (OpenCart) [27]. The external network consists of 100 virtual machines and a physical machine for the attacker. In the built network, clients in the internal network can access the external network for web surfing, whilst clients in the external network can access the
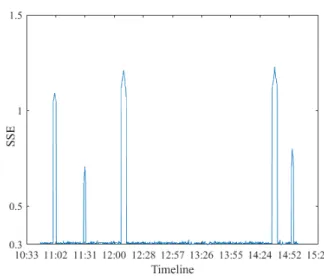
Fig. 7: Anomalies detected by GAAD in the network dataset.
webserver. No communication is allowed between clients in the internal network.
During the acquisition period, traffic was allowed to flow in the network for 255 minutes. Over each fifteen-second contiguous time interval a graph increment was generated. Hence, the 255 minutes of network traffic was modelled as a dynamic graph with 1020 graph increments in total. Five different attacks were injected into the network traffic. The first of these was a SYN scan to all target machines. The second was a host enumeration and a TCP scan to see if systems run SSH, DNS, POP3, or IMAP on their standard ports, or on the port 8000. The last three were DDoS attacks on a target machine running OpenCart. Benign traffic was produced via typical user activities, e.g. accessing the Internet, and the traffic was captured using tshark, which is the terminal oriented version of Wireshark [28]. Fig. 5 shows the adjacency matrix generated from a graph increment containing a normal traffic and an attack traffic. We can see that the normal traffic matrix is random in nature, whilst the DDoS attacks have highly structured rectangular patterns at each of the four corners.
B. Evaluation
For the purpose of this investigation we evaluated the in-fluence of autoencoder hyper-parameters on the performance. They included the number of nodes in the hidden layer as
hs, the desired average activation parameter ρ for hidden nodes, and the weight parameter β of the sparsity penalty. We adopted the receiver operating characteristic (ROC) curve [25] to measure performance and tested GAAD with varying values for these parameters on acquired network dataset.
In the experiments, the learning rateµis set to 0.01 andk
was varied over the range 0.5-4 in a step of 0.5. For eachk
value, we computed the true positive rate which is the fraction of correctly detected anomalous graph increments over the total number of anomalous graph increments, five in our case, and the false positive rate which is the fraction of normal
Fig. 8: ROC curve with varying ρ.
graph increments detected as anomalous to the total number of normal graph increments, i.e., 1,015. Based on the true positive rates and the false positive rates computed for all k
values we drew the ROC curves for GAAD.
C. Effect of the Number of Hidden Nodes
For the parameter hsfor the number of hidden nodes, we chose the values of 10, 50, 100, and 150 for comparison. The results obtained by GAAD for the parameter values are presented by the ROC curves in Fig. 6 and the anomalies detected by GAAD with the parameter value of 100 are shown in Fig. 7. From Fig. 6, it can be seen that GAAD with
hs= 100has the best performance and, with both the increase and decrease of the number of the hidden nodes, GAAD shows the gradually degenerated performance. Moreover, according to the experimental observation, we can see that GAAD with
hs= 100detected all the five attacks as shown in Fig. 7 while the algorithm with hs= 10detected only three attacks in the network dataset. Therefore, it can be seen that GAAD with the number of hidden nodes hs = 100 is very effective for anomaly detection in the network traffic dataset.
D. Effect of the Desired Average Activation
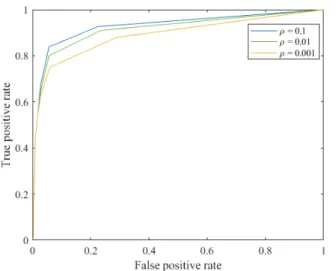
For the parameter ρ for the desired average activation for hidden nodes, we chose the values of 0.1, 0.01, and 0.001 for comparison. The obtained results by GAAD with these three parameter values are presented by the ROC curves in Fig. 8. In the figure, we can see that GAAD with ρ= 0.1 shows the best performance while the algorithm with ρ= 0.001 has the worst performance. Moreover, according to the experimental observation, we can see that GAAD with ρ = 0.1 detected all five anomalies while the algorithm with ρ= 0.001 could detect only four anomalies in the network traffic. Thus, it can be seen that GAAD withρ= 0.1has better capability to detect anomalies in the network traffic.
Fig. 9: ROC curve with varying β.
E. Effect of the Weight Parameter
For the weight parameter β for the sparsity penalty, we chose the values of 1, 3, and 5 for comparison. The results obtained by GAAD with these three parameter values are pre-sented by the ROC curves in Fig. 9. In the figure, GAAD with these three parameter values show the similar performance although the algorithm with β = 3 shows a slightly better performance than other parameter values. Moreover, according to the observation, GAAD with these three parameter values all could detect the five attacks in the network traffic. Thus, it can be seen that GAAD is not significantly affected by β
when detecting anomalies in the network traffic. V. DISCUSSION ANDANALYSIS
In this section, we further analyse the results in order to provide some insight into how GAAD actually works. Specifically, we try to establish whether there is a relation-ship between the number of eigenvectors used in the SVD reconstruction [29] and the number of hidden nodes in the autoencoder of GAAD.
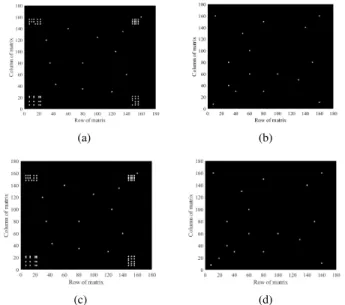
For the purposes of the analysis we selected one graph increment representing normal traffic and another containing traffic acquired during a DDoS attack as shown in Figs. 5(a) and 5(b) respectively. Fig. 10(a) shows the reconstruction error for the GAAD algorithm versus the number of hidden nodes for both the normal and DDoS attack traffic. We can see that the reconstruction error for the DDoS traffic is larger than the normal traffic. As the number of hidden nodes increases, the reconstruction error reduces for both normal and DDoS traffic. Figs. 11(a) and 11(c) show the autoencoder’s approximation to the adjacency matrix of the DDoS traffic with 10 and 100 hidden nodes respectively. We can see that in neither case has the autoencoder been able to reconstruct the adjacency matrix. In particular, the highly structured rectangular patterns in each of the four corners of the adjacency matrix have not been reconstructed. Figs. 11(b) and 11(d) show the reconstructed
(a) (b)
Fig. 10: Adjacency matrix reconstruction error versus number of hidden nodes for the autoencoder, (a), and versus number of eigenvectors for SVD, (b), for normal and DDoS traffic.
(a) (b)
(c) (d)
Fig. 11: Reconstruction of the DDoS traffic adjacency matrix with 10, (a), and 100, (c), nodes respectively. Reconstruction of the normal traffic with 10, (b), and 100, (d), nodes.
adjacency matrix for the normal traffic with 10 and 100 hidden nodes. In contrast, we can see that autoencoder has been better able to reconstruct the adjacency matrix of the normal traffic with 100 hidden nodes. The adjacency matrix of the normal traffic appears more random in nature and does not contain any highly regular structured patterns as in the case of the DDoS traffic. Hence, as the auotencoder fails to approximate the DDoS attack traffic, the reconstruction error is large enough to be detected. The normal traffic is adequately approximated leading to a low reconstruction error.
Figs. 10(b) and 12 show the same graphs for the SVD recon-struction. We can see that in this case the SVD approximations
(a) (b)
(c) (d)
Fig. 12: Reconstruction of the DDoS traffic adjacency matrix with 2, (a), and 3, (c), eigenvectors respectively. Reconstruc-tion of the normal traffic with 2, (b), and 3, (d), eigenvectors.
to both the normal and DDoS attack traffic have the high fi-delity even with using only 2 and 3 eigenvectors. In particular, it is able to approximate the highly structured patterns in the DDoS attack resulting in a very small reconstruction error. Hence, the DDoS attack is not detected.
VI. PERFORMANCECOMPARISON
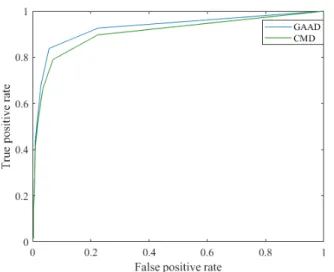
Using the optimum derived hyper-parameters in Section IV, we compared the performance of GAAD with the compact matrix decomposition (CMD) anomaly detection method [15], and the ROC curves for the results obtained by CMD and GAAD are shown in Fig. 13. From Fig. 13, we can see that GAAD demonstrates a better performance than CMD
Fig. 13: ROC curve for GAAD and CMD.
for detecting anomalies. Moreover, the experimental analysis showed that CMD could only detect four attacks while GAAD found all the five attacks in the network traffic dataset. There-fore, it can be seen that GAAD has a superior performance to CMD for the anomaly detection in the network traffic.
VII. CONCLUSION
In this paper, we propose a novel anomaly detection algo-rithm named GAAD which is based on the dynamic graphs and sparse autoencoder in order to efficiently detect anomalies in network traffic. The algorithm first models the network traffic as dynamic sequence of graphs. Each graph increment represents the traffic flow over contiguous time increments and is considered as a bipartite graph with one partition for internal nodes and the other partition for external nodes. Then, it employs the one mode projection to compress information of bipartite graphs to generate projected graphs. Subsequently, it adopts the sparse autoencoder to compute approximations of the adjacency matrix of the projected graph. After that, it computes the sum of squared errors to detect anomalies in the network traffic. Based on the experiments on a simulated network traffic, our proposed algorithm demonstrates very promising performance for anomaly detection in the network traffic. In the future, we will do more performance compar-isons of our algorithm with other anomaly detection methods for the network traffic, and implement the application of our algorithm in the real-world network traffic.
REFERENCES
[1] J. Jang-Jaccard and S. Nepal, “A survey of emerging threats in cyberse-curity,”Journal of Computer and System Sciences, pp. 973–993, 2014. [2] P. Kaur, M. Kumar, and A. Bhandari, “A review of detection approaches for distributed denial of service attacks,”Systems Science & Control Engineering, vol. 5, no. 1, pp. 301–320, 2017.
[3] L. Akoglu, H. Tong, and D. Koutra, “Graph based anomaly detection and description: a survey,”Data Mining and Knowledge Discovery, pp. 626–688, 2015.
[4] A. Asratian, T. Denley, and R. H¨aggkvist,Bipartite graphs and their applications. New York, NY, USA: Cambridge University Press, 1998.
[5] W. Sun, S. Shao, R. Zhao, R. Yan, X. Zhang, and X. Chen, “A sparse auto-encoder-based deep neural network approach for induction motor faults classification,”Measurement, vol. 89, pp. 171–178, 2016. [6] S. Ranshous, S. Shen, D. Koutra, S. Harenberg, C. Faloutsos, and N. F.
Samatova, “Anomaly detection in dynamic networks: a survey,”Wiley Interdisciplinary Reviews: Computational Statistics, vol. 7, no. 3, pp. 223–247, 2015.
[7] H. Dai, F. Zhu, E. Lim, and H. Pang, “Detecting anomalies in bipartite graphs with mutual dependency principles,” inProceedings of the 12th IEEE International Conference on Data Mining, 2012, pp. 171–180. [8] H. Tong and C. Lin, “Non-negative residual matrix factorization with
application to graph anomaly detection,” in Proceedings of the 11th SIAM International Conference on Data Mining, 2011, pp. 143–153. [9] S. M. Bridges and R. B. Vaughn, “Fuzzy data mining and genetic
algorithms applied to intrusion detection,” inProceedings of the National Information Systems Security Conference, 2000, pp. 16–19.
[10] F. Salmen, P. Hernandes, L. Carvalho, and M. Proenca, “Using firefly and genetic metaheuristics for anomaly detection based on network flows,” inProceedings of the 11th Advanced International Conference on Telecommunications, 2015, pp. 113–118.
[11] T. Luo and S. G. Nagarajany, “Distributed anomaly detection using autoencoder neural networks in wsn for iot,” 05 2018, pp. 1–6. [12] J. Dromard, G. Roudiere, and P. Owezarski, “Online and scalable
unsupervised network anomaly detection method,” IEEE Transactions on Network and Service Management, vol. 14, no. 1, pp. 34–47, 2017. [13] Z. Duan, P. Chen, F. Sanchez, Y. Dong, M. Stephenson, and J. M. Barker, “Detecting spam zombies by monitoring outgoing messages,”
IEEE Transactions on Dependable and Secure Computing, pp. 198–210, 2012.
[14] T. Ghanem, W. Elkilani, and H. Abdul-Kader, “A hybrid approach for efficient anomaly detection using metaheuristic methods,” Journal of Advanced Research, vol. 6, no. 4, pp. 609–619, 2015.
[15] J. Sun, Y. Xie, H. Zhang, and C. Faloutsos, “Less is more: Sparse graph mining with compact matrix decomposition,”Statistical Analysis and Data Mining, vol. 1, no. 1, pp. 6–22, 2008.
[16] M. Ahmed and A. Mahmood, “Novel approach for network traffic pattern analysis using clustering-based collective anomaly detection,”
Annals of Data Science, vol. 2, no. 1, pp. 111–130, 2015.
[17] K. Limthong, “Real-time computer network anomaly detection using machine learning techniques,”Journal of Advances in Computer Net-works, pp. 1–5, 2013.
[18] M. Bhuyan, D. Bhattacharyya, and J. Kalita, “An effective unsupervised network anomaly detection method,” inProceedings of the International Conference on Advances in Computing, Communications and Informat-ics, 2012, pp. 533–539.
[19] J. Kim, W. Yoo, A. Sim, S. Suh, and I. Kim, “A lightweight network anomaly detection technique,” inProceedings of the International Con-ference on Computing, Networking and Communications (ICNC), 2017, pp. 896–900.
[20] M. Hoque, M. Mukit, and M. Bikas, “An implementation of intrusion detection system using genetic algorithm,” International Journal of Network Security and Its Applications, vol. 4, no. 2, pp. 109–120, 2012. [21] L. Marti, A. F. Tchango, L. Navarro, and M. Schoenauer, “Anomaly detection with the voronoi diagram evolutionary algorithm,” in Proceed-ings of the nternational Conference on Parallel Problem Solving from Nature, 2016, pp. 697–706.
[22] K.-T. Cho and K. G. Shin, “Viden: attacker identification on in-vehicle networks,” inProceedings of the ACM SIGSAC Conference on Computer and Communications Security. New York, NY, USA: ACM, 2017, pp. 1109–1123.
[23] M. Nasr, A. Houmansadr, and A. Mazumdar, “Compressive traffic analysis: a new paradigm for scalable traffic analysis,” inProceedings of the 2017 ACM SIGSAC Conference on Computer and Communications Security. New York, NY, USA: ACM, 2017, pp. 2053–2069. [24] T. Andrysiak, L. Saganowski, M. Choras, and R. Kozik, “Proposal
and comparison of network anomaly detection based on long-memory statistical models,”Logic Journal of the IGPL, pp. 944–956, 2016. [25] T. Fawcett, “An introduction to roc analysis,” Pattern Recognition
Letters, vol. 27, pp. 861–874, 2006.
[26] “NRL CORE tool,” ‘‘https://www.nrl.navy.mil/itd/ncs/products/core”. [27] “OpenCart,” ‘‘https://www.opencart.com/”.
[28] “Tshark,” ‘‘https://www.wireshark.org/docs/man-pages/”.
[29] G. W. Stewart, “On the early history of the singular value decomposi-tion,”Pattern Recognition Letters, vol. 35, pp. 551–566, 1992.