Piping Plover Distribution Modeling
Scientific Name: Charadrius melodus
Distribution Status: Migratory Summer Breeder
State Rank: S2B
Global Rank: G3
Inductive Modeling
Model Created By: Joy RitterModel Creation Date: June 22, 2011
Model Evaluators: Bryce Maxell and Joy Ritter
Model Goal: Inductive models will predict the distribution of breeding habitats.
Inductive Modeling Methods
Model Data and Species Range Information:Location Data Source Montana Natural Heritage Program Point Observation Database Total Number of Records 1198
Location Data Selection Rule 1
Spatially unique records associated with breeding activity with <= 7300 meters of locational uncertainty
No. Locations Meeting Selection Rule 1
927 Location Data Selection
Rule 2
No overlap in locations when buffered by the associated locational uncertainty in order to avoid spatial autocorrelation.
No. Locations Meeting Selection Rule 2
101
Season Modeled Summer Breeding No. Model Train Locations 71
No. Model Test Locations 30 No. Model Background
Locations
6,744 Area of Species Range in
State (Percent of Montana)
Environmental layer information:
Layer Identifier Description
Aspect CONTEWASP
CONTNSASP
Continuous measure of east to west aspect Continuous measure of north to south aspect
Bias BIAS Categorical layer representing potential underlying biases inherent in the observation database as a result of proximity to roads and public lands
Elevation CONTELEV Continuous elevation in meters form the National Elevation Dataset Geology CATSDEGEOL Categorical surficial geology - 931 categories
Land Cover CATESYS Categorical Level 2 Montana land cover framework with roads removed – 27 categories
Max Temp CONTTMAX Continuous estimated average maximum daily July temperature in degrees Fahrenheit for 1971-2000
Min Temp CONTTMIN Continuous estimated average minimum daily January temperature in degrees Fahrenheit for 1971 -2000
Precipitation CONTPRECIP Continuous annual precipitation in 1cm intervals Slope CONTSLOPE Continuous degrees of slope
Soil Temp CATSOILTMP Categorical soil temperature and moisture regimes – 12 categories Stream Dist CONTSTRMED Continuous Euclidean distance from major streams in 1-meter
intervals
Maxent Model Input String:
Range wide
java –mx2048 –jar c:\MaxEnt\maxent.jar -a -z nowarnings noprefixes -P -J -o U:\IndSpecies\Char_melo\2011_06_22\RangeOut -s
U:\IndSpecies\Char_melo\2011_06_22\Char_melo_train.csv -T
U:\IndSpecies\Char_melo\2011_06_22\Char_melo_test.csv -e I:\modelingSecondRoundInputLayers nowriteclampgrid nowritemess maximumbackground=6745 writebackgroundpredictions noextrapolate nodoclamp -N CONTVRM -t BIAS -t CATESYS -t CATSDEGEOL -t CATSOILTMP
Statewide
java –mx2048 –jar c:\MaxEnt\maxent.jar -a -z nowarnings noprefixes -P -J -o U:\IndSpecies\Char_melo\2011_06_22\StateOut -s
U:\IndSpecies\Char_melo\2011_06_22\Char_melo_train.csv -T
U:\IndSpecies\Char_melo\2011_06_22\Char_melo_test.csv -e I:\modelingSecondRoundInputLayers nowriteclampgrid nowritemess maximumbackground=60000 writebackgroundpredictions noextrapolate nodoclamp -N CONTVRM -t BIAS -t CATESYS -t CATSDEGEOL -t CATSOILTMP
Inductive Model Evaluation
Model Performance:Model appears to adequately reflect the distribution of Piping plover nesting habitat across Montana. Evaluation metrics suggest a good model fit (see table of evaluation metrics).
Top contributing layers:
Variable Percent Contribution Permutation Importance
CONTSTRMED 39.6 62 CATESYS 37 13 CATSDEGEOL 12 3.6 CONTELEV 5.2 11.8 CONTTMIN 2.7 3 CONTSLOPE 2 3.5 Evaluation metrics: Metric Value
Low Logistic Thresholda 0.027
Area of predicted low suitability habitat within species’ range 4,485 km2
Medium Logistic Thresholdb 0.15
Area of moderate suitability habitat within species’ range 1,330 km2
Optimal Logistic Thresholdc 0.45
Area of predicted optimal habitat within species’ range 571 km2 Total area of predicted suitable habitat within species’ range 6,386 km2
Absolute validation index (AVI)d 0.967
Avg Deviance (X +/- SD)e 1.80 +/- 1.90
Training AUCf 0.936
Test AUCg 0.932
a. The logistic threshold between unsuitable and low suitable as determined by Maxent which balances training data omission error rates with predicted area.
b. The logistic threshold value where the percentage of observations above the threshold is what would be expected if the observations were randomly distributed across logistic value classes. This is equivalent to a null model.
c. The logistic threshold where the percentage of observations above the threshold is 10 times higher than would be expected if the observations were randomly distributed across logistic value classes. d. The proportion of test locations that fall above the low logistic threshold.
e. A measure of how well model output matched the location of test observations. In theory,
everywhere a test location was located, the logistic value should have been 1.0. The deviance value for each test location is calculated as 2 times the natural log of the associated logistic output value. Deviance values vary from 0, when test observations are associated with a logistic value of 1, to around 13.8, when logistic values approach 0.001. Deviances for individual test locations are plotted in Figure 3.
f. The area under a curve obtained by plotting the true positive rate against 1 minus the false positive rate for model training observations. Values range from 0 to 1 with a random or null model performing at a value of 0.5.
Inductive Modeling Map Outputs
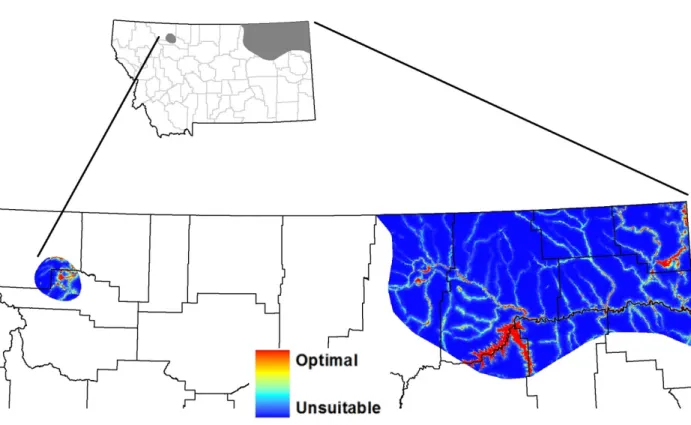
Figure 1. Continuous habitat suitability model output (logistic scale).
Unsuitable Low Suitability Moderate Suitability Optimal Suitability
Figure 3. Continuous habitat suitability model output with relative deviance for each test observation.
Figure 4. Model output classified into unsuitable (gray), low suitability (yellow), medium suitability (orange), and optimal suitability (red) habitat classes.
Deductive Model
Model Created By: Bryce Maxell
Model Creation Date: November 4, 2010
Model Evaluators: Joy Ritter and Bryce Maxell
Model Evaluation Date: June 22, 2011
Model Goal: Deductive model is meant to represent species-habitat associations during summer breeding season. Species were classified as commonly or occasionally associated with ecological systems. See details on how ecological systems were associated with species and the suggested uses and limitations of these associations under individual species accounts in the Montana Field Guide at: http://fieldguide.mt.gov
Deductive Modeling Methods
Ecological System Code Habitat Association
Great Plains Prairie Pothole 9203 Common
Open Water 11 Common
Great Plains Closed Depressional Wetland 9252 Common
Great Plains Open Freshwater Depression Wetland 9218 Common
Great Plains Saline Depression Wetland 9256 Common
Great Plains Floodplain 9159 Common
Deductive Model Evaluation
Discussion of Model Performance:With the exception of the central areas of large open water bodies which are not suitable habitat, the model appears to do an adequate job of representing summer breeding areas at large spatial scales across the known breeding range of the species in Montana.
Evaluation metrics:
Metric Value
Area of commonly associated habitats (Km2) 1,370 Absolute validation index (AVI) for common
habitat associations
Common Habitat Associations
Deductive Model Output (Maps)
Figure 5. Common habitat association classes as determined by expert opinion (see Montana Field Guide species account).