Sveriges lantbruksuniversitet
Fakulteten för veterinärmedicin och husdjursvetenskap
Swedish University of Agricultural Sciences
Faculty of Veterinary Medicine and Animal Science
Elevated cluster take-off level and the risk of dry
off in dairy cows
Hanna Pettersson
Examensarbete / SLU, Institutionen för husdjurens utfodring och vård, 553
Uppsala 2016
Degree project / Swedish University of Agricultural Sciences,
Department of Animal Nutrition and Management, 553
Examensarbete, 30 hp Masterarbete
Husdjursvetenskap Degree project, 30 ECTS Master Thesis
Sveriges lantbruksuniversitet
Fakulteten för veterinärmedicin och husdjursvetenskap Institutionen för husdjurens utfodring och vård
Swedish University of Agricultural Sciences
Faculty of Veterinary Medicine and Animal Science Department of Animal Nutrition and Management
Elevated cluster take-off level and the risk of dry
off in dairy cows
Höjd avtagningsnivå och risken för sinläggning hos mjölkkor
Hanna Pettersson
Supervisor: Examiner: Credits: Course title: Course code: Programme: Level: Place of publication: Year of publication: Series name, part No:Online publication: Key words:
Jan Olofsson, SLU, Department of Animal Nutrition and Management
Kerstin Svennersten-Sjaunja, SLU, Department of Animal Nutrition and Management
30 ECTS
Degree Project in Animal Science
EX0551
Agriculture programme – Animal Science Second cycle A2E
Uppsala
2016
Degree project / Swedish University of Agricultural Sciences, Department of Animal Nutrition and Management, 553
http://stud.epsilon.slu.se
Automatic cluster take-off, elevated cluster take-off, ACR threshold, dry off, last quarter, quarter level, dairy cows
Content
Sammanfattning ... 1 Abstract ... 1 Introduction ... 3 Literature background... 4 Lactation ... 4 Milk flow ... 4Milking interval and milking frequency ... 6
Incomplete and cessation of milking ... 6
Automatic cluster removal ... 8
Effects of elevated automatic cluster removal thresholds ... 8
Material and Methods ... 9
Preconditions ...10 Experimental design ...11 Statistical analysis ...12 Results...13 Milk yield ...13 Milking time ...15
Mean milk flow...17
Last milked quarter ...18
Discussion ...18
Milk yield ...19
Milking time ...20
Milk flow ...21
Comments to the study ...21
Future studies ...22
Conclusion ...22
Acknowledgments ...22
1
Sammanfattning
För att uppnå en effektiv mjölkproduktion krävs väl anpassad mjölkningsutrustning och anpassade mjölkningsrutiner, utefter mjölkkornas och gårdens förutsättningar, speciellt i en allt mer automatiserad produktion. Ett stort antal faktorer påverkar mjölkproduktionen och möjligheterna till effektivisering, inställningarna i mjölkningsrobotarna är en sådan faktor. Forskning pågår ständigt för att finna optimala inställningar och vid vilket mjölkflöde avtagning av spenkopparna bör ske är en av de funktioner som testas. Forskningsresultat indikerar att det kan vara möjligt att öka mjölkningseffektiviteten genom förhöjd avtagningsnivå. Det ifrågasätts dock om höjd avtagningsnivå kan orsaka ofullständiga mjölkningar, vilket i sin tur skulle kunna leda till ofrivillig sinläggning. Syftet med föreliggande studie var därför att utvärdera risken för sinläggning om avtagningsnivån på den sist mjölkade spenen höjdes från 210 g/min till 500 g/min.
En crossover studie genomfördes på tre olika gårdar som hade DeLavals automatiska mjölkningssystem (VMS™). Två olika behandlingar användes (A och B) och totalt 236 mjölkkor, uppdelade i två grupper på vardera gård, ingick i försöket. Behandling A (kontroll) hade ett mjölkflöde på 210 g/min på alla fyra spenarna vid avtagning av spenkopparna och behandling B (förhöjd) hade avtagningsnivån 210 g/min på de tre första mjölkade spenarna och 500 g/min på den sist mjölkade spenen. Totalt genomfördes åtta veckors försök där behandlingen varvades mellan grupp 1 och 2 de första 4 försöksveckorna. De 4 sista veckorna i försöksperioden tilldelades en grupp behandling A och den andra behandling B. Data registrerades automatiskt vid varje mjölkning i mjölkningsroboten och exporterades sedan till Excel där data sammanställdes, för att därefter analyseras i en PROC MIX-model i SAS version 9.4.
Effekten på mjölkmängd, mjölkningstid och mjölkflöde analyserades. Resultaten visade ingen signifikant skillnad på mjölkmängd eller mjölkflöde mellan behandling A och B. En signifikant skillnad i mjölkningstid kunde ses mellan behandlingarna de första 4 veckorna, med längre mjölkningstider för behandling B. De sista 4 veckorna kunde ingen signifikant skillnad urskiljas. Resultaten visade också att den sist mjölkade spenen varierar mellan mjölkningar, både mellan kor och inom individer.
Att höja avtagningsnivån på den sist mjölkade spenen från 210 g/min till 500 g/min hade ingen påverkan på mjölkmängden och ökade inte risken för sinläggning. Dessa resultat stämmer överens med tidigare forskning och det faktum att den sist mjölkade spenen varierar kan bidra till minskad risk för ofullständiga mjölkningar. Ytterligare forskning vore dock fördelaktigt för att utvärdera effekterna vidare.
Abstract
To achieve a profitable milk production in a more and more automated dairy production, well adapted milking equipment and milking routines are essential. Many factors affect the milk production and the possibilities to enhance production. Different settings for take off level in the milking stations is one example. Research has shown that automatic cluster removal (ACR) can be possible to adjust for increased milk production. By increased ACR thresholds
2
on the last milked udder quarter production can be rationalized. However there is a notion that increased ACR threshold increase the risk of drying off that udder quarter due to incomplete milkings.
The aim of this study was therefor to examine the risk of drying off an udder quarter by increased ACR threshold on the last milked quarter from 210 g/min to 500 g/min. A crossover design was used on three different farms provided with DeLaval automatic milking equipment (VMS™). Two different treatments were used on 236 dairy cows divided into two even groups on each farm. Treatment A (control) used ACR threshold 210 g/min on all four udder quarters and treatment B (elevated) ACR threshold 210 g/min on the first three milked quarters and 500 g/min on the last milked quarter. The trial proceeded for eight weeks, with treatment A and B interspersed between the two groups the first four weeks. The remaining four weeks one group got treatment A and the other treatment B. Data was automatically recorded in the VMS station and exported to Excel for further analysis in a PROC MIXED model in SAS version 9.4.
The effect of treatment on milk yield, milking time and milk flow was analyzed and the results showed no significant difference on milk yield or milk flow between treatments. There was a significant difference in milking time the first four weeks, with longer milking duration for treatment B. No significant treatment effect on milking time could be seen the last four weeks but a shorter milking duration for treatment B could be noted. The results also showed that the last quarter being milked varied between milkings, both between cows and within individual cows.
To increase the ACR threshold from 210 g/min to 500 g/min on the last milked udder quarter had no effect on milk yield and showed no risk of drying off a quarter. These results are in line with previous studies and the fact that the last quarter being milked varies, could contribute to decreased risk of incomplete milkings. However, more research would be beneficial to further investigate the effects.
3
Introduction
Maximum profitability without reduced production and sacrificed animal health is crucial for dairy producers. Milking systems are under constant development to generate a more efficient milk production and improved animal health (Magliaro & Kensinger, 2005). By development of the technology used in milk production, milk yields and profits can be maximized (Jacobs
et al., 2012). A limiting factor for a profitable milk production is milking efficiency (Stewart
et al., 2002). The introduction of automatic milking systems (AMS) in the dairy industry is a step towards a more efficient milk production. They are designed to get the cow to voluntarily visit the milking station several times a day, which permits an increased milking frequency without increasing the need for labour (Rossing et al., 1997; Svennersten-Sjauna & Pettersson., 2007). To be able to enhance milk production and at the same time protect the udder health, adaption of the milking procedure to the physiological requirements of the cow is essential (Sandrucci et al., 2007). Many factors affect the efficiency of the milking process. Individual cow production together with milking duration is particularly important (Stewart et al., 2002). Milk production is dependent on fast and complete milk removals through machine milking (Bruckmaier, 2001).
A possible way to reduce the milking duration is to alternate the cluster attachment time by changing the settings of the automatic cluster removal (ACR). This is a function that automatically removes the milking cluster from the udder when the milk flow decreases below a predetermined milk flow rate (kg/min), the ACR threshold (Stewart et al., 2002; Jago
et al., 2010). Through an increased ACR threshold the milking duration is expected to decrease by shortening the end of the milking, thus saving milking time and decreasing wear on the teats. However there is a concern, questioned by Clarke et al., (2008), that milking regimes used for shortening the milking duration could increase the risk of incomplete milkings and hence the risk of drying off the cow. An incomplete emptying of the udder can impair milk production through increased intra-mammary pressure in the udder, involution of the secretory tissue and increased concentration of feedback inhibitor of lactation (FIL) (Sjaastad et al., 2010).
Previous studies on the effect of increased ACR setting have shown a possibility to increase the threshold to as high as 0.8 kg/min without compromising milk production (Stewart et al.,
2002; Magliaro & Kensinger, 2005). However, few studies have been made under field conditions on commercial farms (Stewart et al., 2002). In the VMS2011 model, DeLaval introduced the Smart Take-off function, the first Smart Milking-functionality developed as a response to customer demands on shortening the box time of cows with single slow-milked udder quarters. Essentially the ACR setting on only the last quarter being milked is increased, thereby saving milking time with little loss in milk yield. Tests on a few farms showed that it increased the harvesting flow approximately 4% (herd average). However, no customer validation or large-scale follow up of this test results have been done. Furthermore, the market reactions are mixed, and there is a notion in the field that this method may unintentionally dry off slow quarters due to earlier cluster removal, resulting in an incomplete emptying of the udder.
The aim of this study was therefore to evaluate the risk of drying off the last milked quarter when the Smart Take-off function is used. This function increases the ACR threshold from 210 g/min to 500 g/min on the last milked udder quarter. At the same time, the study aim to obtain more solid performance data to investigate the possibilities for a farm to enhance milk production by using this function. The effect on milking time and milk flow was also studied.
4
Based on previous studies on ACR settings up to 0.8 kg/min (Stewart et al., 2002; Magliaro & Kensinger, 2005) following hypothesis was formed: Increasing the ACR threshold from 210 g/min to 500 g/min on the last milked quarter will not increase the risk of drying off that quarter.
Literature background
Lactation
Milk yield changes naturally as lactation progresses. At the beginning of lactation milk yield increases until peak of lactation. The peak normally occurs between four to six weeks after calving. After that, milk yield declines throughout lactation due to decreasing secretory activity, more epithelial cells are lost than formed (Sjaastad et al., 2010; Phillips, 2010). However, the shape of the lactation curve differs between individuals and Brotherstone et al.,
(2004) showed a difference between primiparous and multiparous cows, where primiparous cows had their peak at 55 days in milk (DIM) while multiparous cows had their peak at 25 DIM.
There are several factors that affect milk production. Pregnancy affects the daily milk yield in dairy cows, pregnant cows have a significantly lower milk yield than non-pregnant cows. To which extent depends on the stage of gestation. Milk yield starts to decline already from first month of gestation, with a significant depression of milk yield from 5th month of gestation. The rate of decline is doubled every month between 6th and 8th month of pregnancy (Olori et al., 1997). The effect also depends on parity and production level. In a comparison between primiparous and multiparous cows with different production levels Coulon et al., (1995) could see a reduced effect on milk yield from 20th week of pregnancy. After 25th week the reduction was significantly higher in high producing multiparous cows. However, the total milk yield is lower for cows in parity one than multiparous cows and milk yield are also affected by type of breed (Hansen et al., 2006). High somatic cell count (SCC) can also have an impact on milk production. Milk yield is reduced due to damaged tissue and cell death during infections (Bayles et al., 1998; Long et al., 2001).
The milk obtained during milking can be divided into two fractions, the cisternal and the alveolar milk. The cisternal milk is less than 20 percent of the total fraction. The alveolar milk is only possible to receive after activation of the milk ejection reflex. This reflex is under hormonal control and activated by the release of oxytocin. The release of oxytocin and the milk ejection can have a large impact on the milk flow and hence the emptying of the udder. The rate of alveolar milk secretion decreases towards the end of the milking, in cows with high peak milk flow the cistern will be emptied faster than alveolar milk will be excreted (Bruckmaier, 2001). The total fraction of milk in the udder is allocated differently between the teats. The rear quarters contain more milk compared to the front quarters (Berglund et al., 2007).
Milk flow
Milk flow is an important parameter to examine when evaluating the sufficiency of the milking procedure (Zucali et al., 2009). A number of studies have been performed, both on udder and udder quarter level, to investigate reasons for variation in milk flow curve and the relationship with environmental and cow factors.
5 Milk flow curve
The milk flow curve can be divided into separate phases which are, increase/incline phase (milk flow rate >0.5 kg/min to start of plateau), plateau phase (period with steady milk flow), decrease/decline phase (end of plateau phase to milk flow below 0.2 kg/min) and overmilking phase (milk flow rate < 0.2 kg/min until cluster removal) (Sandrucci et al., 2007; Zucali et al.,
2009). Several factors affect milk flow rates and hence the milk flow curve. Lactation
number, DIM, peak flow rate and pre-milking conditions all have an impact (Sandrucci et al.,
2007). The pattern of the milk flow curve varies between individuals (Mottram et al., 1994;
Sandrucci et al., 2007) and is affected, among others, by lactation number and DIM, a
consequence of difference in milk yield at different lactation stages (Sandrucci et al., 2007).
When examine milk flow patterns a clear difference in milk flow characteristics can be seen depending on if the analysis is made on udder or quarter level (Tancin et al., 2006).
Udder level
On udder level multiparous cows compared to primiparous cows have higher peak milk flow rate and higher milk yield/milking which results in a longer total milking time. With
progressed DIM average milk flow rate is reduced (Sandrucci et al., 2007) and milk yield at
decline phase decreased by 32% from month one to ten of lactation (Tancin et al., 2006). There is a positive correlation between milk yield/milking, peak flow rate and total milking time. The duration of the milk phases also differ, with a decreased duration of the plateau phase and an increased duration of the incline phase in multiparous cows (Sandrucci et al.,
2007). The duration of the milk flow phases affects the total milking time. An evaluation of udder milk flow curves from 82 herds with Italian Holstein-Friesian cows showed a wide variability in milk flow phases between cows and 6% of the milkings exceeded seven minutes. Long milking times could be explained by longer over-milking and stripping phase
(Sandrucci et al., 2007). Quarter level
Compared to udder level the duration of the decline phase at quarter level decreased from month one and two and then gradually increased throughout lactation. At quarter level the duration of the over-milking phase increased from month one to three and thereafter it decreased along with advancing lactation. The position of the quarters has a high impact on milk flow. Rear quarters have a significantly higher peak flow rate, average milk flow rate, milk yield and longer milking time. Front quarters on the other hand, have a shorter duration of increase and decline phase but longer duration of over-milking phase. At quarter level the decline phase starts when the amount of alveolar milk filling the cistern is lower than the rate of milk removal (Tancin et al., 2006).
Pre-milking conditions
When comparing various milk flow curves and investigating the relationships with different traits, the milking procedure is important to take into account (Tancin et al., 2007b). Pre-milking conditions affect the milk flow patterns and hence the milk production and Pre-milking
time (Sandrucci et al., 2007). Cows receiving pre-milking operations, such as fore-stripping
and cleaning with a towel had significantly higher peak milk flow rate, shorter milking time and shorter duration of increase and decline phase compared to cows that did not receive pre-milking operations (Tancin et al., 2007a).
6
Milking interval and milking frequency
The principle of voluntarily visits in the automatic milking systems causes a large variation in milking frequency and milking interval. When investigating milking data from AMS Hogeveen et al., (2001) concluded that milking interval varied between 6 to 12 h and the average milking frequency was 2-2.5 milkings/day. Only 6% of all cows visited the milking station less than twice/day.
Reduced milking frequency and incomplete milking affects the rate of milk secretion (Wilde
et al., 1995). The consequence of an altered milking interval is dependent on the level of milk production. Milk yield can be increased in high producing cows by shortened milking interval. However, that decreased the milk flow rate and the total daily machine-on time increased (Hogeveen et al., 2001). Unequal milking intervals resulted in declines in milk yield and reduced milk removal or cessation of milking, which cause decreased mammary DNA content and lost alveolar integrity (Quarrie et al., 1996). Glands milked trice per day had increased milk yield compared to glands milked once per day (Li et al., 1999). Uneven milking intervals also resulted in a longer decline phase at quarter level, and a modification of the milk flow curve thought to be affected by the degree of quarter filling (Tancin et al.,
2006).
Incomplete and cessation of milking
Without regular emptying of the udder, involution of the mammary gland is elicited and milk production ceases. This process can be activated naturally as the offspring is weaned and milk yield progressively declines or induced more rapidly by premeditated termination of milking, so called dry off (Li et al., 1999; Wilde et al., 1999). Of these two, the premeditated process is the one most studied (Wilde et al., 1999). The decline in milk yield because off incomplete or cessation of milking is dependent on a variety of factors, not all yet understood. Studies show that two major factors are mammary gland involution and local inhibitors (Noble & Hurley, 1999; Wilde et al., 1999). The degree of influence also depends on whether the change in milk removal occurs gradually or rapidly.
Involution and FIL
Involution of mammary tissue converts the milk secreting tissue in the udder to non-secreting tissue (Noble & Hurley, 1999). It is a process where the tissue undergoes reconstruction. Intrinsic parts of this is the epithelial cell apoptosis (programmed cell death) (Quarrie et al., 1996; Furth et al., 1997; Wilde et al., 1997; Li et al., 1999) and the degradation of the extracellular matrix and the basement membrane (Quarrie et al., 1996; Furth et al., 1997; Wilde et al., 1997). The involution process can be divided into two stages. The first stage occurs due to accumulation of milk in the gland and it causes epithelial cell apoptosis. This stage is reversible. The second stage is triggered by hormonal changes and causes tissue reconstruction, an irreversible process within the same lactation (Furth et al., 1997). After cessation of milking, mammary DNA content is evidently reduced and apoptotic cells can be detected in the mammary tissue (Wilde et al., 1999). The time frame for involution of the mammary gland varies and depends on species, but researchers have seen a remarked reduction in secretion after 3 days post cessation of milking. The composition of the milk starts to change after a week and full regression has occurred after three to four weeks (Noble & Hurley, 1999). Li et al., (1999) detected a change in morphology of the alveolar cells after three days, and after two weeks a reduction in alveolar cell size were detected and apoptotic cells were present. The biggest difference could be seen after two weeks with abundant
7
number of apoptotic cells and DNA laddering. After four weeks the number of alveolar cells had also decreased. Stage of lactation had a high impact on the effect, and in late lactation milk stasis caused a rapid regression of secretory alveoli. The degree of mammary cell apoptosis varies based on if the cessation of milking is partial or complete. Partial milking can prevent the apoptotic stimulus of milk stasis (Wilde et al., 1999).
Noble & Hurley, (1999) investigated the possibility to resume milk secretion after a period of cessation of milking and ongoing mammary gland involution. Seven Holstein cows were used and milk stasis was performed for 11 d. After that, milking was resumed for three days in two quarters of five cows while two cows had continuous milk stasis for the whole 14-day study period. The researchers could see that involution of the mammary gland was established after 11 days and that milk production could be partially regained, a result thought to be due to resumed removal of mammary secretions. These results also indicate that a small amount of secretory tissue is lost during involution (Noble & Hurley, 1999).
Dry off
Milk yield declines with progressed lactation and cows naturally cease the milk production when the offspring is weaned (Quarrie et al., 1996; Wilde et al., 1999). However, in dairy production a more common practice is induced cessation of milk production between lactation, a so-called dry off period (for review see Odensten, 2006). Both natural weaning and cessation of milking cause mammary apoptosis, a process of the tissue involution. The tissue remodelling contributes to a successful subsequent lactation. The mammary involution is a slower process during natural weaning compared to when the milking is consciously ceased (Quarrie et al., 1996).
In order to obtain optimal milk production every dairy cow is subject to a dry period, which is a non-lactating period before parturition. A common practice among producers is to start preparing for the dry period around six to eight weeks before parturition. To decrease and cease the cow’s milk production feed with low energy content and milk-cessation regimes can be used. In order for the dry period to be beneficial it needs to be a balance between loss of production when terminating the current lactation and an increase of production in the subsequent lactation. This period is considered being between 40 and 60 days long (for review see Odensten, 2006). The cow’s response to dry off depends on several factors, and production level is one of them. Cows with a low production (14L/day) in late lactation compared to high yielding cows (25-35L/day) had a more natural like dry off. Measures showed that low yielding cows had a more modest udder swelling and substantial change in milk composition, with a lower concentration of lactose and ion concentrations. The composition of somatic cells in the milk in low yielding cows was mostly made of T-lymphocytes and macrophages. The composition in high yielding cows on the other hand, was made of neutrophils. These are the first line of immunological defence, suggesting a response to distress in the udder (Silanikove et al., 2013).
During natural conditions weaning means a less abrupt cessation of milk removal. This is thought to lead to a reduced risk of milk stasis. Milk secretion is progressively reduced in order to adjust to the infrequent milk removal (Quarrie et al., 1996; Wilde et al., 1999) and to meet the offspring’s demand for milk (Quarrie et al., 1996). Decreased milk secretion is by some researcher considered to be a biological factor. The dam has to decide to invest in either the current offspring or in her-self and future offspring. The investment a dam puts in the offspring increases the chance for survival of the offspring. At the same time it is important that it does not jeopardize the capability to invest in future offspring. The adaptions made thus
8
depend on whether the parent is pregnant or not while nursing the current offspring (Peaker, 1989).
In studies with mice it was apparent that in mice that were pregnant during lactation the mammary cell apoptosis and tissue remodelling was induced earlier than in non-pregnant mice, suggesting that mammary involution is necessary for the subsequent lactation. This is thought to result in a conflict for the dam, whether she should choose to invest in the current offspring or in the next litter (Wilde et al., 1999). Early weaning gives the dam a chance to recover from lactation faster and to restore body condition and prepare for the next litter and lactation. When mice were subjected to milk stasis it caused a rapid change in mammary tissue with an early induction of apoptosis, suggesting that milk stasis is an effective way to induce mammary apoptosis. It also indicates that local factors play an important role (Quarrie
et al., 1996).
Automatic cluster removal
Netherlands was in 1992 the first country to install automatic milking systems (AMS). In AMS the teat cups are automatically attached and detached from the teats. It enabled increased number of milking’s without increased labour and a possibility to adapt to cows’ different needs in different stage of lactation (Svennersten-Sjauna & Pettersson., 2007). AMS requires a higher investment (de Koning & Rodenburg., 2004) and regardless of the capacity used, the fixed cost will be the same. The variables that have greatest impact on milk yield and milking efficiency are individual cow production and milk flow rate (Castro et al., 2012). Improved design of milking equipment to decrease milking time while production are maintained or increased is essential to achieve a competitive production. ACR was developed to make the milking process more efficient. By changed threshold setting for milk flow at the end of milking (i.e. the cluster removal), the milking duration could be modified (Magliaro & Kensinger, 2005).
ACR is based on milk flow and the milking cluster is automatically removed when the milk flow decrease below a predetermined threshold. When the milk flow drops the vacuum is reduced and the cluster is withdrawn from the udder. Typically ACR consists of an air cylinder and a piston that is powered by vacuum. The cluster is removed with a cord connected to the claw. As the piston moves the cord tauten and when the milking vacuum is shut off the teat cup slides off and the tautened cord pulls the cluster away. When and how the cluster is removed differs depending on setting and brand. At the beginning of the milking session an initial delay period can be used where the cluster is attached at a predetermined time before it can be removed. This ensures that cows with delayed milk let down are properly milked. At the end of the milking a final delay time can be determined, where the cluster is attached for a short time (usually 1-30 sec) after the milk flow threshold is reached. A maximum milking time can also be set that removes the cluster after a couple of minutes if the milk flow threshold has not been reached (DairyNZ, 2015). In the DeLaval VMSTM a pre-milking time is set for 90 s where milk flow is overseen, after this pre-pre-milking phase pre-milking is stopped when the milk flow decrease under 210 g/min for more than 6 s (DeLaval, 2007). However, an optimal milk flow setting is not yet established and researchers are still investigating and comparing different threshold levels (Magliaro & Kensinger, 2005).
Effects of elevated automatic cluster removal thresholds
Increasing the ACR setting and to change the end of the milking procedure in order to reduce milking time can be an alternative to optimize milk production without increasing labour
9
costs (Stewart et al., 2002; Magliaro & Kensinger, 2005). It can also reduce the risk of over-milking (Tancin et al., 2006). Several studies have been done to evaluate the effect of ACR settings and the possibility to alter it without jeopardizing milk production or animal health. During these studies various ACR threshold levels and pre-milking operations have been used but the results indicate a positive effect on milk yield and milking duration with elevated threshold level (Stewart et al., 2002; Clarke et al., 2004; Magliaro & Kensinger, 2005; Jago et al., 2010).
Jago et al., (2010) used treatments with ACR settings of 0.2 kg/min and 0.4 kg/min in combination with a maximum milking time and no pre-milking operations. Maximum milking time is a setting in the AMS used to decrease the over-milking phase. If milk flow doesn´t drop below the predetermined setting before maximum milking time is reached, the cluster will be removed anyway. Results showed shorter milking duration without affecting milk production with elevated ACR settings, with highest effect in early lactation. There was an increase of SCC levels when using elevated ACR settings, however the incidence of clinical mastitis was unaffected. The study also examined the risk of incomplete milking by measuring the strip yield in week 12 and 27 of lactation. The strip yield was higher in early lactation for the treatment with a maximum milking time, which thought to be due to a higher milk production in early lactation. Magliaro and Kensinger, (2005) used three different ACR settings, 0.48, 0.6 and 0.8 kg/min together with pre-milking operations. These results also showed that with increased ACR setting milking duration can be shortened without reduced milk yield. Increased ACR from 0.48 to 0.6 resulted in 6.3% (0.4 min/cow) decrease in
milking time. The milking duration was reduced 11.1% between ACR setting 0.48 and 0.8.
There was no difference between primi- and multiparous cows. Stewart et al., (2002) conducted a crossover experiment in five commercial herds with elevated ACR settings from either 0.5 to 0.64 kg/min or 0.73 to 0.82 kg/min. Milk flow increased in all five herds with increased ACR settings. In four of the five herds the average milking duration was significantly reduced between 10.2 and 15.6s per cow. The elevated ACR setting had no negative effect on the milk yield in any of the five herds.
The effect of elevated ACR settings is of special interest in slow milking cows since they tend to have longer milking durations, especially the duration of the decline phase. Clarke et al.,
(2004) made a study with cows known as having a long milking duration (slow milkers). Treatments with four different ACR settings together with a maximum milking time or pre-milking operations were used. The ACR setting of 200 ml/min, 500 ml/min, 500 ml/min together with pre-milking teat stimulation and 200 ml/min together with max milking time were the investigated treatment combinations. Increased ACR setting resulted in a small reduction of milking duration without reduced milk production. Combination of both increased ACR setting and a maximum milking time resulted in a significant reduction in milking duration. The risk of incomplete milking’s was also investigated and no difference in strip yield could be seen between treatments. The cases of high strip yields that could be seen did not affect milk yield.
Material and Methods
A crossover study was performed on three different Swedish dairy farms using DeLavals automatic milking system VMSTM (table 1). The farms were located in the counties of Hälsingland and Södermanland and the study was conducted from October 2014 until December 2014. The herds were subjected to two different treatments with different ACR
10
settings and milking parameters were measured automatically in the milking station during the trial.
Preconditions
A total number of 236 primi- and multiparous cows were used in the study of the breeds Holstein and Swedish Red. In all herds the cows had free access to roughage while concentrates were provided through feeding stations and in the milking unit. All ratios were altered based on milk production level (low or high yielding cow).
Farm 1 consisted of 114 lactating cows of the breed Swedish Red and Holstein (approximately 50/50) and 92 of these were included in the study (Table 1). The cows were kept in a loose housing uninsulated barn with two milking units and all cows had access to both units. The farm practiced guided cow traffic where the cow had to go through the milking unit in order to get to the lying area and to the feeding stations. The farm had a group for high cell count cows which were divided evenly into the two treatment groups. Farm 2 consisted of 120 lactating cows of the Holstein breed and 96 of these were included in the study (Table 1). The cows were kept in a loose housing uninsulated barn divided into two groups. Each group had their own milking unit and the cows had no physical contact between the two groups. The farm practiced guided cow traffic where the cows needed to go through the milking unit in order to get to the roughage and lying area. Farm 3 consisted of 70 lactating cows of the breed Swedish Red and Holstein (approximately 70/30) and 48 of these were included in the study (Table 1). The cows were kept in a loose housing insulated barn with one milking unit. The farm practiced guided cow traffic where the cow needed to go through the robot in order to get to the lying area and feeding stations. Farm 2 and 3 dried off the cows 60 days prior to expected parturition and farm 1 at 75 days. Cows that were planned to be dried off at any time during the study, cows with incomplete trial weeks and cows with one or more quarters dry before the start of the study were excluded from the study.
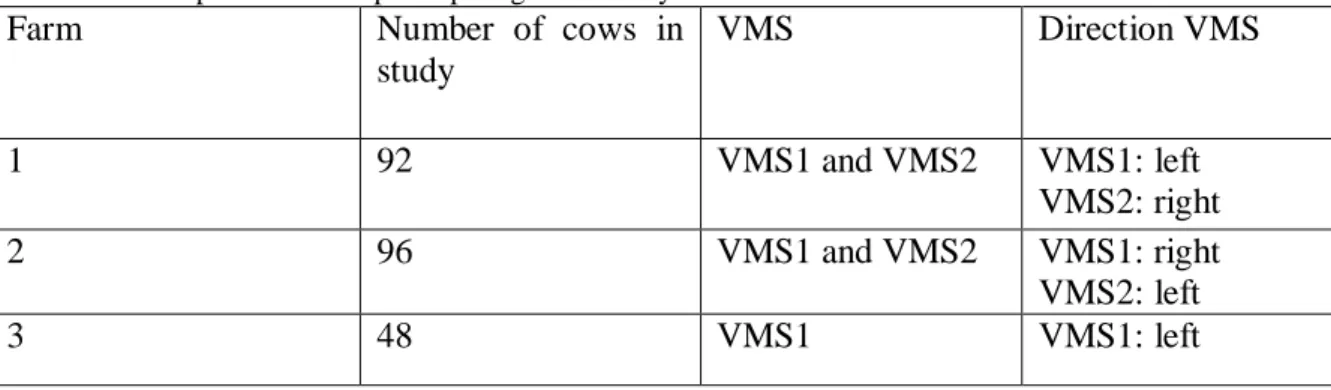
Table 1. Description of farms participating in the study
Farm Number of cows in
study VMS Direction VMS 1 92 VMS1 and VMS2 VMS1: left VMS2: right 2 96 VMS1 and VMS2 VMS1: right VMS2: left 3 48 VMS1 VMS1: left
The order of teat cup attachment to the udder depends on from which direction the cow enter the VMS. Teat cups are always attached on rear quarters first and then front quarters. However, if it is the teats on the right or left side of the cow that the cluster is attached to first depends on the direction of the VMS and the cow. When cows stand with their left side against the robotic arm, left teats are attached first (left) and cows with their right side against the robotic arm will have the cluster attached to their right teats first (right) (Table 2).
11
Table 2. Order of teat cup attachment in voluntary milking station. Left. Cow with left side against robotic
arm:
Right. Cow with right side against robotic arm:
Teat cup 1: left rear Teat cup 2: right rear Teat cup 3: left front Teat cup 4: right front
Teat cup 1: right rear Teat cup 2: left rear Teat cup 3: right front Teat cup 4: left front
Experimental design
The field study followed a crossover design. In a crossover experiment every experimental unit, in this case cows, receives a series of treatments in a predetermined sequence (periods) (Jones & Kenward, 2003). This design enables the cow to be its own control which gives the advantages of smaller standard errors when comparing treatments. Thus the effect of the experimental unit and environment will be removed. In this case, a 2x2 design was used with one repeat of the periods, which means two different groups and two different treatments (A and B). Half of the group received treatment A first while the other group received treatment B. After one week the groups switched treatment, and this was then repeated one more time. After the crossover study a follow up on the cows was made in order to determine the long-term effect of increased ACR threshold.
Treatments and grouping
Two different treatments were used, treatment A (control) and treatment B (elevated take off level). In treatment A the cups were automatically removed when the milk flow decreased below 210 g/min/udder quarter. In treatment B the cups were removed on the first three quarters when the milk flow went below 210 g/min and from the last milked quarter when the milk flow went below 500 g/min. The treatments was interspersed between the two groups every other week for four weeks (period 1), thereafter one group received treatment A for one months while the other group received treatment B (period 2), resulting in a total of eight weeks of trial/farm (Table 3).
Table 3. Experimental design
week 1 week 2 week 3 week 4 week 5 – 8
Group 1 A B A B A
Group 2 B A B A B
Two even groups were formed to ensure comparable results between cows and herds. The grouping was performed in two steps to ensure an even as well as a random distribution of cows in both groups. In the first step the cows were grouped based on parity (1 parity, 2 parity, >3 parity), DIM (1-60 d, 61-200d, >200d), stage of gestation (1th-4th mo, 5th- 6th mo, 7th-8th mo), feeding (based on feeding strategies on each farm) and SCC groups (based on cell count groups on each farm). After this, the cows from each group were randomly divided into one of two new groups, group 1 and group 2.
12 Data collection and handling
Data on both udder and udder quarter level were automatically recorded in the VMS (Delpro 4.4 test version) at every milking and obtained as Excel-files. Registered parameters of interest were DIM, milk yield, milking time, milk flow and last milked quarter.
The milking data excel-files were imported and compiled in SAS for statistical analysis. The results were processed in two blocks, period 1 (trial week 1-4) and period 2 (trial week 5-8). To exclude possible carry-over effects the analysis was based on measurements from the last 4 days in every week. Means were calculated and compiled weekly for individual cows, treatment and group. Incomplete data with missing registrations were excluded from the study.
Statistical analysis
The effect of treatment was tested for each of the two periods on the variable milk yield per trial week on udder and quarter level, milking time per trial week on udder level and milk flow per trial week on quarter level for each cow; using mean values for each treatment and cow. Pair-wise comparisons of LS Means for the fixed effects treatments, weeks and udder quarter were conducted by t-test with adjustment for multiple pair-wise comparisons according to Turkey-Kramer in the PROC MIXED procedure of SAS (v. 9.4, SAS Institute, Inc., Cary, NC). Following models was used:
Milk yield and milking time in period 1
Y = treatment + trial week + treat*trial week (group*cow and group*cow*treatment regarded as random effects)
Milk flow in period 1
Y = treatment + trial week + treatment*trial week + quarter + treatment*quarter + trial week*quarter (group*cow and group*cow*treat regarded as random effects and farm*group*cow*quarter regarded as a repeated effect)
Milk yield and milking time in period 2
Y = treatment + trial week + treatment*trial week (cow*treatment regarded as a random effect)
Milk flow in period 2
Y = treatment + trial week + treatment*trial week + quarter + treatment*quarter + trial week*quarter (cow*treatment regarded as a random effect and farm*treatment*cow*quarter regarded as a repeated effect)
13
Results
Milk yield
Milk yield was analyzed on both udder and udder quarter level. Udder Level
There were no significant difference in milk yield on udder level between treatment A (control) and B (elevated take off level on last milked udder quarter) during the eight weeks of trial (P-value 0.99 period 1 and P-value 0.34 period 2). As can be seen in Table 4 the least square mean (LS mean) for milk yield did not differ between the two treatments. There was a significant difference in milk yield between trial weeks (P-value <.0001) with a lower LS mean in trial week 4 and 7 compared to the other weeks.
Means of milk yield compiled weekly for each group on each farm are presented in figure 1 and 2. Milk yield varied both within and between farms and trial weeks for both treatments. On farm 1 group 1 had lower milk yield during the weeks with treatment B (week 2 and 4) while group 2 had a higher milk yield during the weeks with treatment B (week 1, 3 and 5-8). On farm 2 on the other hand group 1 showed a higher milk yield during the weeks with treatment B (week 2 and 4) and group 2 had a lower milk yield during week 1, 5, 6, 7 and higher milk yield in week 3 and 8 with treatment B. On farm 3 group 1 had lower milk yield during week 4 with treatment B and group 2 had a higher milk yield with treatment B during week 5 and lower milk yield with treatment B during week 1, 3, 6, 7 and 8.
Table 4. Milk yield (kg/milking) atudder level during period 1 (trial week 1-4) and period 2 (trial week 5-8), LS mean and standard error (SE).
Treatment A1) LS-mean ± SE Treatment B2) LS-mean ± SE Sign level Period 1 14.2 ± 0.17 14.2 ± 0.17 0.99 Period 2 13.9 ± 0.26 13.6 ± 0.25 0.34
1) Treatment A=control (take off level at 210 gr/min)
2) Treatment B= elevated take off level at last milked quarter (500 gr/min)
Week 1 2 3 4 5 6 7 8
Milk Yield
14.4a)1) 14.2 b) 14.1 b) 13.9 c) 14.1b) 13.9 c) 13.2d) 13.8c)
14
Figure 1. Mean milk yield/milking group 1 for the three farms. Mean milk yield in kg milk for all cows in group 1 compiled weekly for the entire experiment period. Cows in group 1 received treatment B (elevated take off level on the last milked udder quarter) during week 2 and 4 and treatment A (control) during week 1, 3 and 5-8.
Figure 2. Mean milk yield/milking group 2 for the three farms. Mean milk yield in kg milk for all cows in group 2 compiled weekly for the entire experiment period. Cows in group 2 received treatment B (elevated take off level on the last milked udder quarter) during week 1, 3 and 5-8 and treatment A (control) during week 2 and 4.
10 11 12 13 14 15 16
Farm 1 Farm 2 Farm 3
Kg
m
ilk
Mean milk yield/milking
Group 1
w1 w2 w3 w4 w5 w6 w7 w8 10 11 12 13 14 15 16Farm 1 Farm 2 Farm 3
Kg
m
ilk
Mean milk yield/milking
Group 2
w1 w2 w3 w4 w5 w6 w7 w815 Udder Quarter Level
There were no significant difference in milk yield on quarter level between treatment A and B during the eight trial weeks (P-value 0.99 period 1 and P-value 0.35 period 2), table 5. There was a significant difference in milk yield between trial weeks (P-value <.0001) with a change in all weeks except 2, 3 and between 6 and 8. On quarter level there was a significant difference in milk yield between quarters during the entire trial with higher milk yields in rear quarters compared to front quarters (P-value <.0001).
Table 5. Milk yield (kg/milking) atudder quarter level during period 1 (trial week 1-4) and period 2 (trial week 5-8), LS mean and standard error (SE).
Treatment A1) LS-mean ± SE Treatment B2) LS-mean ± SE Sign level Period 1 3.54 ± 0.04 3.54 ± 0.04 0.99 Period 2 3.48 ± 0.06 3.39 ± 0.06 0.34
1) Treatment A=control (take off level at 210 gr/min)
2) Treatment B= elevated take off level at last milked quarter (500 gr/min) LF LS-mean ± SE LR LS-mean ± SE RF LS-mean ± SE RR LS-mean ± SE Sign level Period 1
3.06±0.07 3.99±0.07 3.07±0.07 4.04±0.07 <.0001 between front and rear quarters respectively
Period 2
2.97±0.07 3.88±0.07 2.96±0.07 3.93±0.07 <.0001 between front and rear quarters respectively
Week 1 2 3 4 5 6 7 8
Milk Yield
3.60a)1) 3.55b) 3.54b) 3.47c) 3.53b) 3.47c) 3.29d) 3.46c)
1) Different letters = Statistical significant difference P <0.001
Milking time
Milking time was analyzed on udder level. Udder Level
There was a significant difference in milking time between treatment A and B during period 1 with shorter milking times for treatment A. In period 1 mean milking duration was 7.6 s shorter for treatment A compared to treatment B (LS mean 7.75 treatment A and LS mean 7.87 treatment B). In period 2 there was no significant difference in milking time between treatments. A minor difference in LS mean could be seen with lower milking time in treatment B (Table 6). There was a significant difference in milking time between trial weeks (P-value 0.028 period 1 and P-value 0.0001 period 2) with a difference in LS mean between week 3 and 4 and lower LS mean in week 7.
Means of milking time compiled weekly for each group on each farm are presented in figure 3 and 4. Milking time varied both within and between farms and trial weeks for both treatments without any evident pattern.
16
Table 6. Milking time (min/milking) at udder level during period 1 (trial week 1-4) and period 2 (trial week 5-8), LS mean and standard error (SE)
Treatment A1) LS-mean ± SE Treatment B2) LS-mean ± SE Sign level Period 1 7.75 ± 0.10 7.87 ± 0.10 <.0001 Period 2 7.85 ± 0.15 7.68 ± 0.14 0.41
1) Treatment A=control (take off level at 210 gr/min)
2) Treatment B= elevated take off level at last milked quarter (500 gr/min)
Week 1 2 3 4 5 6 7 8
Milking time
7.78a)1) 7.84a) 7.87a) 7.75b) 7.85a) 7.81a) 7.63c) 7.78b)
1) Different letters = Statistical significant difference P < 0.001
Figure 3. Mean milking time/milking group 1 for the three farms. Mean milking time in minutes for all cows in group 1 compiled weekly for the entire experiment period. Cows in group 1 received treatment B (elevated take off level on the last milked udder quarter) during week 2 and 4 and treatment A (control) during week 1, 3 and 5-8. 6,8 7 7,2 7,4 7,6 7,8 8 8,2
Farm 1 Farm 2 Farm 3
M ilk in g ti m e (m in )
Mean milking time/milking
Group 1
w1 w2 w3 w4 w5 w6 w7 w817
Figure 4. Mean milking time/milking group 2 for the three farms. Mean milking time in minutes for all cows in group 2 compiled weekly for the entire experiment period. Cows in group 2 received treatment B (elevated take off level on the last milked udder quarter) during week 1, 3 and 5-8 and treatment A (control) during week 2 and 4.
Mean milk flow
Milk flow was analyzed on quarter level. Udder Quarter Level
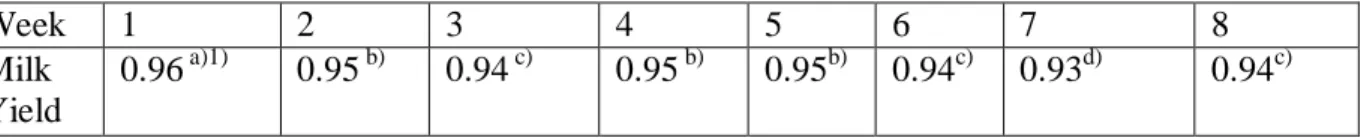
There was no significant difference in milk flow on quarter level between treatment A and B during period 1 or period 2, P-value 0,28 and 0,29 respectively. There was a significant difference in milk flow between front and rear quarters and between trial weeks. Rear quarters had, compared to front quarters, higher milk flow (P-value <.0001). There was a significant difference in milk flow between all trial weeks except 2 and 4 in period 1 and trial week 7 in period 2 (Table 7).
Table 7. Mean quarter milk flow (g/min) during period 1 (trial week 1-4) and period 2 (trial week 5-8), LS mean and standard error (SE).
Treatment A1) LS-mean ± SE Treatment B2) LS-mean ± SE Sign level Period 1 0.95 ± 0.02 0.95 ± 0.02 0.28 Period 2 0.92 ± 0.02 0.96 ± 0.02 0.29
1) Treatment A=control (take off level at 210 gr/min)
2) Treatment B= elevated take off level at last milked quarter (500 gr/min) LF LS-mean ± SE LR LS-mean ± SE RF LS-mean ± SE RR LS-mean ± SE Sign level
Period 1 0.91±0,02 0.97±0,02 0.91± 0,02 1.00±0,02 <.0001 between front and rear quarters respectively
Period 2 0.90±0,02 0.96±0,02 0.90±0,02 0.99±0,02 <.0001 between front and rear quarters respectively 6,8 7 7,2 7,4 7,6 7,8 8 8,2
Farm 1 Farm 2 Farm 3
M ilk in g ti m e (m in )
Mean milking time/milking
Group 2
w1 w2 w3 w4 w5 w6 w7 w818
Week 1 2 3 4 5 6 7 8
Milk Yield
0.96 a)1) 0.95 b) 0.94 c) 0.95 b) 0.95b) 0.94c) 0.93d) 0.94c)
1) Different letters = Statistical significant difference P <0.001
Last milked quarter
The results showed that the last quarter to be milked between milkings varied greatly, not only in the herd but also within individual cows. For the majority of the cows the last quarter milked changed between milkings. On farm 1, 2 and 3 approximately 34%, 30 % and 45% respectively of the cows had one or two weeks where the same quarter was being last milked at every milking. On farm 1 there was two cows that had the same quarter as the last on being milked week 1-4 and one cow week 5-8, on farm 2 one cow week 1-4 and one cow 5-8, on farm 3 four cows week 1-4, one week 5-8 and one cow week 1-8. The variation in last milked quarter for an individual is illustrated in Table 8 with last milked-data registered on three cows from farm 2.
Table 8. Variation in the last milked udder quarter for three different cows on farm 2 during trial week 1-4. Last quarter milked is presented as percentage of total milkings /trial week.
Trial Week Cow 1 Cow 2 Cow 3
1 LF: 0% LR: 23% RF: 77% RR: 0% LF: 9% LR: 73% RF: 18% RR: 0% LF: 11% LR: 78% RF: 11% RR: 0% 2 LF: 29% LR: 14% RF: 57% RR: 0% LF: 0% LR: 64% RF: 36,4% RR: 0% LF: 14% LR: 57% RF: 29% RR: 0% 3 LF: 18% LR: 9% RF: 54,5% RR: 18,2% LF: 0% LR: 27% RF: 64% RR: 9% LF: 0% LR: 75% RF: 0% RR: 25% 4 LF: 25% LR: 33% RF: 33% RR: 8% LF: 0% LR: 31% RF: 69% RR: 0% LF: 25% LR: 50% RF: 12,5% RR: 12,5%
Discussion
There was no significant effect of treatment on milk yield (udder or quarter level) or mean milk flow (quarter level). There was a significant difference in milking time between treatment A and B on udder level for period 1 (P-value <.0001). Treatment B had on average 7.6 s longer milking time compared to treatment A (LS mean 7.87 and 7.75 respectively). Significant effects could also be seen between udder quarters and between trial weeks, indicating that these are valid factors to include in the model. The results also showed a wide variation in last quarter being milked both between cows and within individual cows.
19
Milk yield
There was no significant effect of treatment on average milk yield on udder or quarter level for individual cows. This supported the hypothesis that increased ACR threshold on the last milked quarter does not increase the risk of drying off that quarter. The difference in LS mean for milk yield between treatments on quarter level was very little. In period 1 the difference was 0.2 g/milking and in period 2 it was 84.9 g/milking (Table 5). This is in line with previous studies that have shown that increased ACR threshold level did not have any negative effect on the milk yield (Stewart et al., 2002; Magliaro and Kensinger, 2005). In comparison to this study the other authors used ACR thresholds between 0.48 kg/min and 0.82 kg/min, so even with settings that was 38% higher than in this study no negative effect on milk yield could be seen. Stewart et al., (2002) could see an increase in milk yield in two out of five herds with ACR thresholds of 0.64 kg/min and 0.82 kg/min. When comparing results from different studies the design and preconditions of each study is important to consider. In above mentioned studies they all used a crossover design where all cows received the same treatments. A strength in the present study was the time exposed to different treatments. During the four last weeks the cows were exposed to only one treatment which eliminated the risk of changeover effects. It also accounted for any possible adjustment period of the udder. One notion in the field was that elevated ACR thresholds would increase the risk of incomplete milkings and hence dry off quarters. As previous mentioned dry off due to gradual decline in milk production, is a slower process (Quarrie et al., 1996). The effect of partial or complete cessation of milking is not distinguishable the first couple of days (Noble & Hurley, 1999). The last four weeks of trial in the present study would account for this slow process giving an indication of the effects of elevated ACR thresholds in a more long-term perspective.
As can be seen in figure 1 and 2 where the average milk yield for each group on each farm is compiled weekly and treatments are received parallel between group 1 and 2, the pattern in milk yield change had the tendency to change the same in both groups. This would indicate that the change in milk yield was due to a natural change throughout lactation rather than an effect of treatment. This is also strengthen by the results that showed a significant difference in milk yield between trial weeks (P-value <.0001, table 4). In previous mentioned studies (Stewart et al., 2002; Magliaro and Kensinger, 2005) they did not use different ACR thresholds for individual cows. The feature was set on herd level and all cows received the same treatment during the different periods. In this study both treatments were tested during the same period. Through that design it would be possible to rule out treatment effects and thereby connect the differences in each group to other factors than treatment. This is a very important feature of this study since there are several factors other than milking routines, such as ACR thresholds, that affect milk yield. Olori et al., (1997) showed that pregnancy affects the milk yield with a significant depression of milk yield after month 5 of gestation. Parity also affects the milk yield as showed by Hansen et al., (2006), where parity 1 cows had lower yields.
As expected and in line with previous studies (Tancin et al., 2006; Berglund et al., 2007) there was a significant difference in milk yield between front and rear quarters (P-value <.0001). Rear quarters had higher milk yields compared to front quarters. In period 1 left rear and right rear had mean milk yield 3.99 kg/milking and 4.04 kg/milking respectively. Left front and right front had milk yield 3.06 kg/milking and 3.07 kg/milking respectively. The
20
milk yields in period 2 were a little bit lower, which shows the natural decline in milk yield along with progressed lactation. In period 2 left rear and right rear had mean milk yield 3.89 kg/milking and 3.93 kg/milking respectively compared to front quarters. Left front and right front had milk yield 2.96 kg/milking and 2.98 kg/milking respectively (Table 5).
The notion that increased ACR threshold could dry off slow quarters was in this case enhanced due to the fact that this feature is set on only one udder quarter, the last one being milked. Previous studies have increased the ACR threshold on all quarters (Stewart et al.,
2002; Clarke et al., 2004; Magliaro & Kensinger, 2005; Jago et al., 2010). The concern was that so called slow quarters, quarters with low milk flow, would be in risk of incomplete milkings. Incomplete milkings have shown to negatively affect rate of milk secretion and irregular emptying of the udder reduces the milk production (Wilde et al., 1995; 1999). One reason for this reduced milk production is the accumulation of milk in the udder but this process has been shown to be irreversible (Furth et al., 1997). The results in this study indicate that the risk of milk accumulation in the udder is low since the last quarter that is being milked varied between milkings, reducing the risk of retained milk (Table 8). And as Noble and Hurley (1999) could see, the reduction of milk yield is not evident until 3 days after complete cessation of milking, even though the milking had stopped, production could be regained again as long as 11 days after the cessation of milking. The variation in last milked quarter increases the possibility for any milk retained in the quarter to be secreted at the next milking, reducing the risk of dry off. As long as the milk ejection reflex has been activated the milk will be moved from the alveolar compartment to the cisternal and it can be easily removed from the udder at next milking (Bruckmaier, 2001).
In this study 30-45% of the cows have one or two weeks where the same quarter is the last one to be milked and only one cow had the same quarter as the last one during the whole experiment. However, it is important to keep in mind that milking characteristics varies greatly between individuals and this should be evaluated further. For example reduction in secretory activity goes faster in late lactation (Wilde et al., 1999) and this study eliminated cows close to dry off. The analysis was only made on cows with four weeks continuous milkings.
Milking time
Milking time was only analyzed on udder level. Milking time for each quarter was of lower interest in this case when evaluating the production performance. The milking time starts when the first teat cup is placed on a quarter and it doesn’t stop until the last teat cup is removed. So improved individual milking time on one quarter have minor impact on the whole production performance if one quarter is still milking with the same pace.
There was a significant difference in milking time on udder level between treatments (P-value <.0001) in Period 1. Unexpected, the mean milking duration was 7.6 seconds shorter per milking with treatment A (7.75 min/milking), the control, compared to treatment B (7.87 min/milking) where take off level was increased for the last milked quarter, see table 6. This contradicts previous studies were an elevated ACR threshold decreased milking duration (Stewart et al., 2002; Magliaro & Kensinger, 2005; Jago et al., 2010;). During period 2 there was no significant difference in milking time between treatments (P-value 0.41) but a minor difference in LS means could be seen. During period 2 the mean milking duration per milking
21
was 10 s shorter for treatment B compared to treatment A. However these results were not significant and no clear pattern or conclusion can be drawn from these results. But the difference in milking time between periods and treatments indicates that it would be beneficial to investigate this further. The results could be an indication of the slow process of adjustment in the udder (Quarrie et al., 1996).
As can be seen in Table 6 there was a significant difference in milking time between trial week 3 and 4 and in trial week 7 (P-value 0.03 and 0.0001, respectively). There was no evident pattern of the difference between trial weeks which indicates that this was due to natural variations in milk production.
Milk flow
The milk flow was analyzed on quarter level and there was no significant difference between treatment A and B for period 1 or period 2 (table 7). A significant difference (P-value <.0001) could be seen between front and rear quarters in both periods. The rear quarters had higher milk flow (min/milking) compared to the front quarters. This is in line with previous studies that showed that rear quarters had a higher peak flow rate and average milk flow (Tancin et al., 2006). There was also significant difference in milk flow (P-value <.0001) between trial weeks. However, when comparing the LS mean between trial weeks (Table 7) there was no evident pattern in milk flow changes between the trial weeks. There was a difference between weeks but the pattern did not show a consistent decline or increase in milk flow.
Comments to the study
To analyze the impact in production performance it would be of interest to investigate the effect of elevated ACR thresholds on udder level. Further studies on this would be beneficial. For milk flow it is the same as for milking time. The performance of specific quarter has lower impact on the whole milk production performance since the cow stands in the milking station until all quarters are milked.
Strong advantages of this study were the possibility to register and analyze milking characteristics on both udder and quarter level and the trial design. As previous studies and this study have shown the variation in milking characteristics among individuals is evident. The design of this study made it possible to account for many of these factors besides the ACR threshold. Since all the cows were their own control, possible individual factors could be ruled out. The fact that both treatments were used on the same farm at the same time, any possible environmental factors could also be ruled out. The last four weeks of this study gave a perception of more long-term effects of increased ACR thresholds which was very important since the risk of dry off increase with time.
There are factors in this study important to keep in mind when analyzing the results. In further studies it would be of interest to edit these. Cows in late lactation (dry off scheduled during the 8 weeks of trial) and cows with one or more constant dry quarter were excluded from the experiment. It would be of interest to see if cows close to dry off, with lower milk yields, would respond differently to the treatment. Milk flow was only registered on quarter level and as mentioned before, the effect on udder level would be of interest when analyzing herd performance. Since it takes some time for the effects of incomplete and irregular milkings to occur and the natural process of dry off is slow, a longer trial period could be profitable when
22
collecting data regarding effects of different ACR thresholds. Extending this period would also result in more data from cows close to dry off.
Future studies
Further analysis to see the effect on late lactation cows could be of interest and to increase the ACR threshold even more. An investigation on how to identify cows with the same last quarter being milked would also be beneficial when analyzing the possibilities of changed ACR thresholds on the last milked quarter
Conclusion
In conclusion, increasing the ACR threshold on the last quarter being milked from 210 g/min to 500 g/min did not increase the risk of drying off that quarter. The results showed wide variation in the last quarter being milked, which changed between milkings. In this particular study only one cow had the same quarter as the last one being milked throughout the whole experiment. The variation in last quarter milked indicates that any fraction left at a milking would be secreted during the following milking. There was a significant difference in milking characteristics between front and rear quarters as well as different stages of lactation.
Acknowledgments
First I want to thank Jan Olofsson for all the advice and supervision during this master thesis and to Peter Bahlenberg, DeLaval for supervision and support during the experimental work. I also want to say great thanks in particular to Ingemar Olsson for all the invaluable help with SAS, statistical models and the support during this master thesis. And of course, thanks to all the farmers participating in the study, for the time you have given me so I was able to
23
References
Bayles, K.W., Wesson, C.A., Liou, L.E., Fox, L,K., Bohach, G.A., Trumble, W.R. 1998. Intracellular
Staphylococcus auerus escapes the endosome and induces apoptosis in epithelial cells. Infection and immunity. 66(1): 336-342.
Berglund, I., Pettersson, G., Östensson, K., Svennersten-Sjaunja, K. 2007. Quarter Milking for Improved Detection of Increased SCC. Reproduction of Domestic Animals. 42: 427-432.
Brotherstone, S., Thompson, R., White, I.M.S. 2004. Effects of pregnancy on daily milk yield of Holstein-Friesian dairy cattle. Livestock Production Science. 87: 265–269.
Bruckmaier, R. M. 2001. Milk ejection during machine milking in dairy cows. Livestock Production Science. 70: 121-124.
Castro, A., Pereira, J.M., Amiama, C., Bueno, J. 2012. Estimating efficiency in automatic milking systems. Journal of Dairy Science. 95: 929-936.
Clarke, T., Cuthbertson, E.M., Greenall, R.K., Hannah, M.C., Jongman, E., Shoesmith, D. 2004. Milking regimes to shorten milking duration. Journal of Dairy Research. 71: 419-426.
Clarke, T., Cuthbertson, E. M., Greenall, R. K., Hannah, M. C., Shoesmith, D. 2008. Incomplete milking has no detectable effect on somatic cell count but increased cell count appears to increase strip yield. Australian Journal of Experimental Agriculture. 48: 1161-1167.
Coulon, J. B., Pérochon, L., Lescourret, F. 1995. Modelling the effect of the stage of pregnancy on dairy cows' milk yield. Animal Science. 60(03): 401 – 408.
DairyNZ, 2015. http://www.dairynz.co.nz/milking/in-the-dairy/milking-tasks/cluster-removal/
de Koning, K., and Rodenburg, J. 2004. Automatic milking: State of the art in Europe and North America. In: Automatic Milking: A better understanding. pp.27-37.
DeLaval. 2007. VMS driftledningsprogram/mjölkningsstation handhavande. 94474431.pdf. pp. 103-106. Furth, P. A., Bar-Peled, U., Li, M. 1997. Apoptosis and mammary gland involution: reviewing the process.
Apoptosis. 2: 19–24.
Hansen, J.V., Friggens, N.C., Højsgaard, S. 2006. The influence of breed and parity on milk yield, and milk yield acceleration curves. Livestock Science. 104: 53– 62.
Hogeveen, H., Ouweltjes, W., de Koning, C.J.A.M., Stelwagen, K. 2001. Milking interval, milk production and milk flow-rate in an automatic milking system. Livestock Production Science. 72: 157-167.
Jacobs, J.A., and Siegford, J.M. 2012. Invited review: The impact of automatic milking systems on dairy cow management, behavior, health, and welfare. Journal of Dairy Science. 95: 2227-2247.
Jago, J.G., Burke, J.L., Williamson, J.H. 2010. Effect of automatic cluster remover settings on production, udder health, and milking duration. Journal of Dairy Science. 93: 2541-2549.
Jones, B., and Kenward, M. G. 2003. Design and Analysis of Cross-Over Trials. 2nd edition. Chapman and Hall, London. pp. 1-4.
Li, P., Rudland, P. S., Fernig, D. G., Finch, L. M. B., Wilde, C. J. 1999. Modulation of mammary development and programmed cell death by the frequency of milk removal in lactating goats. Journal of Physiology. 519.3: 885—900.
Long, E., Capuco, A.V., Wood, D.L., Sonstegard, T., Tomita, G., Paape, M.J., Zhao, X. 2001. Escherichia coli