August 2017
The agricultural and industrial demand for corn
Geoffrey Shepherd
Iowa State CollegeJohn J. Dalton
Iowa State CollegeJ. H. Buchanan
Iowa State CollegeFollow this and additional works at:
http://lib.dr.iastate.edu/bulletin
Part of the
Agricultural Economics Commons
This Article is brought to you for free and open access by the Extension and Experiment Station Publications at Iowa State University Digital Repository. It has been accepted for inclusion in Bulletin by an authorized editor of Iowa State University Digital Repository. For more information,
please contactdigirep@iastate.edu.
Recommended Citation
Shepherd, Geoffrey; Dalton, John J.; and Buchanan, J. H. (2017) "The agricultural and industrial demand for corn,"Bulletin: Vol. 29 : No. 335 , Article 1.
The Agricultural and Industrial
Demand for Corn
By Geoffrey Shepherd, John J. Dalton and J. H. Buchanan
AGRICULTURAL EXPERIMENT STATION IOWA STATE COLLEGE OF AGRICULTURE
AND MECHANIC ARTS R. E. Buchanan, Director
A G R IC U L T U R A L ECONOMICS SECTION
The World War marked a turning point in the history of corn production in the United States.” Previous to the World War the trend of corn production in this country was steadily rising. Since 1920, however, it has declined because of de creases both in yield and acreage.
From 1900 to 1920, the United States’ corn crop averaged 68 percent of the world crop of corn, the annual percentages fluctuating about a horizontal trend. Since the World War, however, the United States’ proportion of the world corn crop has been declining. The trend declined to 55 percent in 1933. Corn production has been increasing in other countries and decreasing in the United States.
Gross and net exports of corn from the United States have been declining. During the past 10 years they have only once (in 1928-29) exceeded 1 percent of the total crop. Foreign importers of corn are buying more corn from our competitors and less from us. This trend was clearly evident before the
AAA reduction program was instituted.
AGRICULTURAL DEMAND FOR CORN IN TH E UNITED STATES
During 1924-29, 86.2 percent of the United States corn crop was fed to livestock on farms.
From 1920 to 1935, consumption of corn by horses and mules decreased about 180 million bushels. During the past 10 years, the horse and mule consumption of corn has been cut 40 per cent ; it now takes only 11 percent of the total corn crop. A further decline appears probable during the next few years.
The consumption of corn by hogs on farms increased 120 million bushels from 1910-14 to 1924-29. This increase was the result of two conflicting causes. A marked increase took place in total hog slaughter, but this was partially offset by changes in hog feeding and breeding methods that reduced the per capita hog demand for corn. It seems likely that, in the fu ture, hog slaughter will increase only slowly, or not at all, over pre-1934 levels; while changes in breeding and feeding methods are likely to continue. The total hog demand for corn, therefore, is not likely to increase much in the future; it may decrease.
Consumption by cattle on farms increased 80 million bushels from 1910-14 to 1926-29, because of increases in cattle numbers
and perhaps also because of increased dairy production.
INDUSTRIAL DEMAND FOR CORN IN THE UNITED STATES
The consumption of corn by the milled products industry (makers of corn meal, corn flour and hominy grits) has been declining, from 200 million bushels before the war to 100 mil lion soon after the war and to 40 million (2 percent of the corn crop) in 1932. This decline is probably permanent.
The consumption of corn by the corn products industry (makers of cornstarch, corn sirup, corn sugar and numerous by-products) has been slowly increasing, until now it accounts for 3 or 4 percent of the corn crop. Tapioca from Java is com peting strongly with corn as a raw material in this industry, both at home and abroad. The working out of effective meas ures to meet this competition calls for further research.
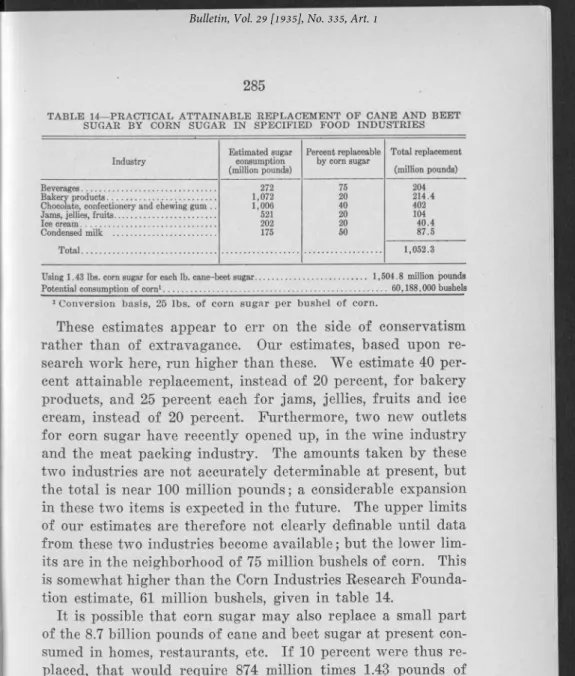
Corn sugar has interesting possibilities for expansion. Pres ent preliminary estimates place the probable outer limits of the consumption of corn as a raw material for corn sugar at about 75 million bushels (3 percent of the total production of corn) more than present consumption for this purpose. Ex tended research into this question is needed t<3 determine how, and how closely, these limits may be approached.
The consumption of corn by the makers of distilled spirits and cereal beverages amounted, in the peak year (1917) to 34 million bushels. This is about 1.3 percent of the total crop. A considerable reduction has taken place since then. Expansion by this industry following repeal can probably increase the demand for corn only about 1 percent.
POSSIBLE N E W USES FOR CORN
An interesting possible new use for corn is opened up by the corn-alcohol fuel program. The outer limit of possible use for this purpose is about 600 million bushels of corn. Two major difficulties stand in the way of this program: (1) Corn alcohol at the plant costs several times as much per gallon as straight gasoline at the refinery, and it is doubtful whether consumers would pay the extra 2 or 3 cents a gallon needed for a 10 per cent blend, unless they were coerced by some form of tax; (2) other products besides corn would probably be used in some measure unless their use were legally prohibited or made diffi cult. Further research is required here also.
THE AGRICULTURAL AND INDUSTRIAL
DEMAND FOR CORN
1
By Geoffrey Shepherd, John J. Dalton and J. H. Buchanan
Corn is the most important crop in the United States ; it leads all other crops in acreage, production and value.2 In the central section of the Middlewest, particularly, corn holds a pre-eminent place, because it dominates the cropping system and is the chief feed for hogs and beef cattle and a major ele ment in the ration of dairy cows.
It is not certain, however, that^orn in the future will main tain as important a position in the United States as it has in the past. The trend of United States’ corn production reached its peak 15 years ago, in 1920. The downward trend since then was clearly evident before the AAA corn-hog reduction pro gram was instituted; it has, of course, been accentuated by that program. These changes in corn production are shown in fig. 1 and table 1.
The decrease in corn production since 1920 is the result of : (1) A decline in the trend of corn yield per acre, and (2) a decrease in corn acreage.
The decline in the trend of yield per acre is partly the re sult of a series of poor seasons in recent years, contrasted with the effect of a series of good seasons in the early 1920’s.3 This
1 P ro je ct 369 o f the Iow a A gricu ltu ral E xperim ent Station.
a The ranking o f the m a jor crops, fo r the period from 1931 to 1933, fo llo w s : (data fo r 1934 are not used because o f the abnorm al drouth in 1934.)
VALUE, ACREAGE AND PRODUCTION OF LEADING U. S. CROPS, 1931-33 (in 1000’s) Average farm Value, Dee. 1 Average Acreage Average production (bushels) 8900,655 504,024 343,765 221,656 105,618 34,929 53,933 39,350 2,608,539 (bales) 14,424 734,470 1,032,018 Source : U. S. D. A . Yearbook.
* The decline in y ield m ay have been p artly because o f the sh ift in corn acreage northw est, or because o f a decline in soil fertility in the established Corn Belt.
U. 5. DEPARTMENT OF AGRICULTURE' »EG. 2 0 6 9 6 B BUREAU OF AGRICULTURAL ECOR»M'CS F ig. 1. United States corn p roduction, y ield and acreage, 1870 to 1934.
decline is shown in the central section of fig. 1. If weather conditions return to normal during the next few years, a part of the decline in corn production may prove to have been only temporary. But the lower section of fig. 1 shows that corn acreage has also changed. The figure shows that the trend of corn acreage, which rose steadily from 1870 to 1910, remained horizontal at about 100 million acres from 1910 to 1920. It shows further that in 1931 and 1932, farmers expanded their corn acreage in a desperate attempt to meet the depression. By 1933, however, corn acreage fell off sharply, and the AAA production control program instituted in 1934 caused a fur ther drastic decline to 87 million acres in 1934, followed by a partial recovery to 96 million acres in 1935. The trend of corn acreage, after remaining horizontal for more than 20 years, has now “ stepped down,” temporarily at least, to a lower level.
YIELD, U. S. D. A. MIM. REPORT, 1934
Year Acreage Yield Production Year Acreage Yield Production
1 870.. . 1 871.. . 1 872.. . 1873.. . 1 874.. . 1875.. . 187 6 .. . 187 7 .. . 1878.. . 1 879.. . 1 880.. . 1881... 1882... 1 883.. . 1884.. . 1 885.. . 1886.. . 1887.. . 188 8 .. . 1 889.. . 1890.. : 1891.. . 1892.. . 1 893.. . 1 894.. . 1 895.. . 1896.. . 1897.. .' 1898.. . 1899.. . 1900.. . 1901.. . 1902.. 1 ,0 0 0 acres 38,408 42.029 43,618 44,124 47,686 52,504 55,347 58,892 59,768 62.354 62,699 63,191 66,157 68,168 68,834 71.854 73,911 73,296 77,474 77,656 74,785 78.855 76,914 79,832 80.069 90,479 89.074 89,965 87,784 94,591 94,852 94,422 97,177
Bu. per acre 29 3 27.2 29.3 22.9 2 2 .2 27.6 26.7 25.7 26.2 28.1 27.2 19.7 26.5 24.2 28.3 28.6 24.1 21.9 29.1 29.5 2 2.1 29.6 24.7 23.8 202 28.0 30 0 ' 25.4 26.8 28.0 - 28.1 18 2 28.5 1 ,000 bushels 1,124,775 1,141,715 1,279,369 1,008,326 1,058.778 1,450,276. 1,478,173 1,515,862 1,564,537 1,751,984 1,706.673 1,244,726 1,755,272 1.650.748 1,947,838 2,057,807 1.782.748 1,604,549 2,250,632 2,294,289 1,650,446 2,335,714 1,897,412 1,900,401 1,615,016 2,534,762 2,671,048 2,286,628 2,351,323 2,645,796 2,661,978 1,715,752 2,773,954 1903.. 1904.. 1905.. 1906.. 1907.. 1908.. 1909.. 1910.. 1911.. 1912.. 1913. . 1914.. 1915.. 1916.. 1917.. 1918.. 1919.. 152 0.. 1921.. 1922.. 1923.. 1924.. 1925.. 1926.. 1927.. 1928.. 1929.. 1930.. 1931.. 1932.. 1933.. 1934.. 1 ,0 0 0 acres 93,555 95.228 95,746 95,624 96,094 95,285 100,200 102,267 101,393 101.451 100,206 97,796 100,623 100,561 110,893 102,195 98,145 101,359 103,155 100,345 101,123 100,420 101,331 99,452 98,357 100,336 97,806 101,083 105,948 108,668 103,260 87,486
Bu. per acre 26.9 28.2 30 9 31.7 27.2 26.9 26.1 27.9 24.4 29 1 22.7 25.8 28.1 24.1 26.2 23.9 27.3 30.3 28.4 27.0 28.4 22.9 28.2 25.9 27.2 27.1 25.9 20.4 24.4 26.8 2 2 .8 15.8 1 ,0 0 0 bushels 2,515,093 2,686,624 2,954,148 3,032,910 2,613,797 2,566,742 2,611,157 2,852,794 . 2,474,635 2,947,842 2.272.540 2,523,750 2,829,044 2,425,206 2,908,242 2,441,249 2.678.541 3,070,604 2,928,442 2,707,306 2,875,292 2,298,071 2,853,083 2,574,511 2,677,671 2,714,535 2,535,546 2,065,273 2,588,509 2,906,873 2,351,658 1,380,718
The decline in corn acreage, yield and production that has occurred during the past two decades may be only temporary. Corn production in the future may hold at about its present level. It is even conceivable that the upward trend from the Civil War to the World War will be resumed. On the other hand, it is possible that the downward trend since the war is the beginning of a long decline that will continue in the future, so that corn will gradually become less important in American agriculture. If we regard corn production as an industry, like the textile or the coal industry, we may ponder the words of the author of a recent study of production trends of industries in the United States since 1870. He points out that “ There seems no warrant for the common notion that industries grow until they approximate some maximum size and then maintain a stationary position indefinitely . . . . once an industry has ceased to advance, it soon begins to decline.” 4
4 A. F. Burns, “ P rod u ction T rends in the United States Since 1870,” National Bureau o f E conom ic Research, 1934, p. xix. ,
TH E FUTURE OF CORN PRODUCTION
It is a matter of vital concern to the Corn Belt, therefore, to ascertain as accurately as possible whether corn production in the future is likely to increase, to remain constant, or to de crease. This question calls for a study of two groups of forces, those that affect the demand for corn, and those that affect the supply of it. On the demand side, for example, corn produc tion in the future may increase or decrease in response to an increase or decrease in the number of horses consuming corn, or because of a change in the demand for pork or lard, or a change in the efficiency of hogs or cattle as converters of grain into meat, or because of a change in the industrial demand for corp. On the supply side, corn production may increase be cause of a ^doptiqp-iifJhjgh^yj^MisgJiy^ii^eorn^ or the breedingjup of early.maturing^drouth resisting~varieties of corn adapted to northwest centrarsfafes, and so"6nTorit may decrease because of sojL erosion in some areas, which would necessitate a reduction in corn acreage.
The present bulletin deals mainly with the demand side of the question; a later bulletin will deal with the supply side. The first part of the present bulletin deals briefly with tKe"~corn situation as it stands today. The second part deals in detail with the present and prospective demand for corn, taking up first the agricultural demand, and then the industrial demand.
WORLD PRODUCTION AND TRADE IN CORN
Let us first determine the position of the United States as a corn producer with respect to the rest of the world, and then investigate her position in world trade in corn.
RELATIVE IMPORTANCE OF THE UNITED STATES AS A PRODUCER OF CORN
For the period 1928-29 to 1932-33,5 the average world pro: duction of corn was estimated at 4.3 billion bushels. The aver age production of corn in the United States during this period was nearly 2.6 billion bushels. This is 59 percent—roughly three-fifths—of the total world production. The United States, therefore, produced more corn than all the other countries of the world put together.
The corn production data by countries for the past few years are shown in table 2.6 This table shows that corn
pro-4 The year 103pro-4 is om itted
COUNTRIES— 1928-29 TO 1932-33 Country Production (million bu.) Percent of world total 2,557 59.3 303 7.0 204 4.7 188 4.4 134 3.1 137 3.2 96 2 .2 80 1.9 73 1.7 72 1.7 70 1 .6 66 1.5 33 0 .8 26 0 .6 19 0.4 256 5.9 4,314 1 00 .0 *3 year average 1928-31.
Source: U. S. D. A. Yearbook, 1934, pp. 417-419, with revisions from the U. S. D. A. Bureau of Agricultural Economics, 1934 Revised Estimates of Corn Acreage, Production and Yield, and Dec. 1934 U. S. D. A. Crop Report.
duction in the United States averages between 2.5 and 2.6 billion bushels, while in Argentina, the next largest producer, it averages about 300 million bushels. It is evident that as a corn producer the United States outranks Argentina, the next most important corn producing country, 8 or 9 times to one.7
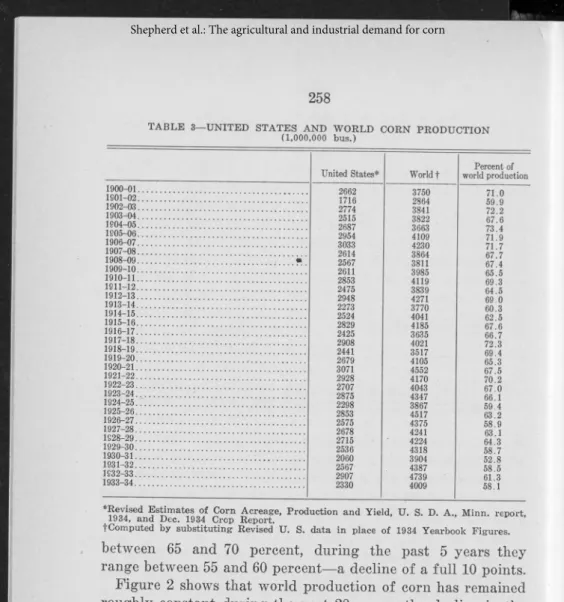
Since the World War, the United States has been losing some of its world leadership as a corn producer. Table 3, re produced graphically in fig. 2, shows that from 1900 to 1920, the United States corn crop averaged 68 percent of the world crop, fluctuating from 59.9 to 73.4 percent. Over this period of years the trend of the percentage which the United States crop constituted of the world crop ran horizontal.
Since the war, however, the trend of the percentage has been declining. During the years 1928-29 to 1932-33, as shown in table 3, the percentage averaged 59.3. A low point of 52.8 percent was touched in 1930-31, largely because of the poor crop in the United States that year. The figure for the most recent year, 1933-34, was 58.0 percent. Looking at fig. 2, one can see that whereas before the war most of the data ranged
7 The ratio between the corn acreages in the tw o countries is about 10 to 1, because yields per acre in the A rgentine run about 10 percent high er than yields in the United States. Y ields fluctuate very v iolently in Argentina from year to year, chiefly because o f the extrem e fluctuations in the rainfall. See W hitbeck, R. H., and Finch, V. C. E conom ic G eography, 1930, pp. 301-15,
TABLE 3— UNITED STATES AND WORLD CORN PRODUCTION (1,000,000 bus.)
United States* World f world productionPercent of 1900-01... 2662 1716 2774 2515 2687 2954 3033 2614 2567 2611 2853 2475 2948 2273 2524 2829 2425 2908 2441 2679 3071 2928 2707 2875 2298 2853 2575 2678 2715 2536 2060 2567 2907 2330 71.0 1801-02... 1902-03... 1903-04... 1804-05... 1805-06... 1906-07... 1907-08... 1908-09... « 1909-10... 3985 1910-11... 1811-12... O«/. o 1912-13... 1913-14... 1914-15... 4041 1915-16... 1916-17... 1917-18... 1918-19... 1919-20... 1920-21... 1921-22... 1922-23..., 4043 4347 3867 1923-24...; 1924-25... 1925-26...Y 1926-27... 4375 1927-28... 1828-29... 1929-30... 1930-31... 3904 1931-32... ... 1832-33... 4739 4009 1933-34... ___________________ ■_________________________ I
,ised Estimates of Corn Acreage, Production and Yield, U. S. D. A., Minn, report, 1934, and Dec. 1934 Crop Report.
tComputed by substituting Revised U. S. data in place of 1934 Yearbook Figures.
between 65 and 70 percent, during the past 5 years they range between 55 and 60 percent— a decline of a full 10 points.
Figure 2 shows that world production of corn has remained roughly constant during the past 20 years ; the decline in the relative position of the United States has been the result of a decline in the production of corn in the United States and a compensating increase in other countries.
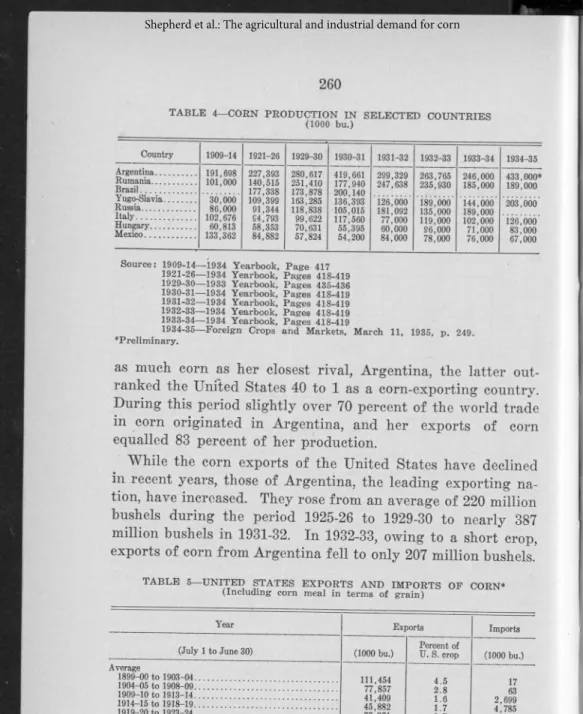
In which other countries has the recent increase in corn pro duction taken place? Table 4 and fig. 3 show that the principal increases in recent years have occurred in the Argentine, Rus sia, Rumania and Yugoslavia.8
UNITED STATES EXPORTS AND IMPORTS OF CORN
Before discussing the bearing of these changes in corn pro duction upon corn producers in the United States, we need to consider not only world corn production, but also international trade in corn.
P E R C E N T B U S H E L S C M i ll i o n s )
From 1928-29 to 1932-33, animal corn exports of the leading surplus producing countries, including corn meal in terms of grain, were estimated at 326 million bushels, 8 percent of total world corn production. Preliminary figures for 1932-33 place total exports at 349 million bushels, about half that of wheat.9 Corn exports from the United States, never very large, now constitute only an insignificant part of the total corn crop a small fraction of 1 percent. The decline during recent years is shown in the tabulation of the United States’ exports and im ports in table 5.
In 1925-26 to 1929-30 the United States ranked third in the world as a corn exporting country; in 1931-32 it had dropped to eighth place and in 1932-33, to fifth place.10
COMPETITION BETW EEN THE UNITED STATES AND ARGENTINA
Comparative figures for the 5-year period 1929-30 to 1933-34 show that while the United States produced over eight times
8 A verage wheat exports, 1925-26 to 1929-30, w ere 800 m illion bushels. P re lim inary estimates fo r 1932-33 were 628 m illion bushels. (W heat, in clud ing flour, in term s o f grain, fo r all ex p ortin g coun tries). U. S. D. A. Y earbook or A griculture, 1934, pp. 400 and 422. _ „ . 1q«m
10 Data in this and next few p aragraphs from U S. D. A. Y earbook, 1934, p. 422.
TABLE 4— CORN PRODUCTION IN SELECTED COUNTRIES (1000 bu.) C o u n t r y 1909-14 1921-26 1929-30 1930-31 1931-32 1932-33 1933-34 1934-35 A r g e n t in a ... R u m a n ia ... B r a z i l... Y u g o - S I a v ia ... R u s s ia ... .. ... I t a l y . ... H u n g a r y ... M e x i c o ... 191,698 101,000 30.000 8 6.0 00 102,676 60,813 133,362 227,393 140,515 177,338 109,399 91,344 94,793 58,353 84,882 280,617 251,410 173,878 163,285 118,838 99,622 70,631 57,824 419,661 177,940 200,140 136,393 105,015 117,560 55,395 54,200 299,329 247,638 263,765235,930 246.000185.000 433,000* 189,000 126,000 181,092 77.000 60.000 84,000 189.000 135.000 119.000 96.000 78.000 144.000 189.000 102.000 71.000 76.000 203.000 126.000 83.000 67.000
Source: 1909-14— 1934 Yearbook, Page 417 1921-26— 1934 Yearbook, Pages 418-419 1929- 30— 1933 Yearbook, Pages 435-436 1930- 31— 1934 Yearbook, Pages 418-419 1931- 32— 1934 Yearbook, Pages 418-419 1932- 33— 1934 Yearbook, Pages 418-419 1933- 34— 1934 Yearbook, Pages 418-419
1934- 35— Foreign Crops and Markets, March 11, 1935, p. 249. ^Preliminary.
as much corn as her closest rival, Argentina, the latter out ranked the United States 40 to 1 as a corn-exporting country. During this period slightly over 70 percent of the world trade in corn originated in Argentina, and her exports of corn equalled 83 percent of her production.
While the corn exports of the United States have declined in recent years, those of Argentina, the leading exporting na tion, have increased. They rose from an average of 220 million bushels during the period 1925-26 to 1929-30 to nearly 387 million bushels in 1931-32. In 1932-33, owing to a short crop, exports of corn from Argentina fell to only 207 million bushels.'
TABLE 5—UNITED STATES EXPORTS AND IMPORTS OF CORN* (Including corn meal in terms of grain)
Year Exports
Imports (July 1 to June 30) (1000 bu.) Percent of U. S. crop
(1000 bu.) Average 1899-00 to 1903-04... 111,454 77,857 41,409 45,882 77,371 17 63 2,699 4,785 3,328 637 1,098 5,463 490 497 1,747 386 195 244 1904-05 to 1908-09... 1909-10 to 1913-14... 1 .6 1.7 1914-15 to 1918-19... 1919-20 to 1923-24... 1925-26... ... . 1926-27... 1927-28... 1928-29... 1929-30... 1930-31... 1931-32... 1932-33... 1933-34... S Ä Ä a Ä r iro m F " * iB n c” p s ,n d
F ig. 3. Corn production in leading corn producing' countries fo r pre-w ar and p ost-w ar periods, and annually since 1929-30.
In 1933-34, Argentina exports were 218 million bushels. In 1934-35, however, a record crop was harvested, and exports from it will undoubtedly be great. The trend of Argentina’s exports appears to be upward.11
Shipments from Argentina, in the main, are consigned to the feed deficit countries of southern Europe, the non-corn
produc-11 These com parisons are based upon the fo llo w in g data taken from U. S. D. A. Y earbooks 1934, pp. 418-422, and 1933. p. 435 w ith some revisions given in F oreign C rops and M arkets March 11, 1935, pp. 248 and 257, and United States General Crop R eport, Decem ber 1934, U. S. D. A. Bureau o f A g ricultural E co nom ics.
CORN PRODUCTION (Thousand bushels)
United States Argentina 1929 30 ... ... 2,535,386 2,065,273 2,588,508 2,906,873 2,351,658 280,617 419,661 299,329 263,765 246,000 1930 31 ... 1931 32 ... 1933 34 ...; ... EXPORTS OF CORN (Thousand bushels) Total of principal ex
porting countries United States Argentina 1929-30. ... 274,485 • 375,356 488,231 352,615 272,307 10,281 3,317 3,969 8,775 4,965 168,585 274,044 386,849 206,802 218,542 1930-31 ... 1831-32 ... 1932-33 ... 1933-34 ...
ing countries of northern Europe, and England. Further, in spite of an existing 25 cents per bushel duty on corn imports into the United States, some Argentina shipments enter the United States along the Pacific coast and go to some of the New England states. The demand for this corn originates prin cipally from the highly commercialized poultry industries, lo cated in these areas because of closeness to market rather than to feed supply.12
OTHER CORN EXPORTING COUNTRIES
Argentina, we have seen, exports over 80 percent of her corn crop. Other countries rank considerably lower in the percent age exported. South Africa, from 1925-26 to 1931-32, shipped about 25 percent of her corn abroad, mainly to the United Kingdom. During the same period, Rumania, Bulgaria, Yugo slavia and Hungary shipped about 20, 16, 12 and 5 percent of their respective corn crops to the adjacent central and south ern European deficit corn areas.
CORN IMPORTING COUNTRIES
Corn is a staple in the diet of the southern European coun tries, where it is called “ polenta.” A considerable part of our corn exports has been shipped to these countries in the past.
12 Fundam ental differences in the econom ic structure o f the United States and A rgentina count fo r the w ide disparity in the ultim ate disposition o f their respective corn crops. M ore than 85 percent o f the corn crop o f the United States is fed to liv estock ; corn is exported, in the main, in the form o f p ork products. A lth ough A rgentina possesses a considerable area which is naturally adapted to corn grow in g, there are several reasons w h y she is a corn ex p ortin g coun try, chief o f w hich are: (1) The coun try is too sparsely populated to consum e m uch o f her production at home, (2) livestock there is fattened m ostly on alfalfa, (3) the h og industry is relatively undeveloped, (4) small land holders p rod u cin g and feed ing their own livestock, so com m on in the United States, are com paratively few in A rgentina, where m ost o f the fa rm in g is done b y short-term tenants on landed estates, w hose insecure tenure discourages animal p roduction.
T he greater p rop ortion o f Argentina corn is flint corn, w hich is harder and has a low er m oisture content than the com m on dent varieties grow n in the United States. Because o f these properties, Argentina corn is less affected by the chan ging con d ition s encountered on lon g ocean hauls than the American corn. It w ill stand ocean shipm ent across the equator, w hile dent corn w ould be likely to g o out o f condition because o f the m oisture and heat encountered on the trip. A nother advantage is the fa ct that transportation costs in A rgen tina are less because o f the shorter haul from the surplus p rod u cin g areas to seaboard points. T his is im portant, especially in tim es o f low prices when transportation costs make up a very large part o f the ultim ate selling price. L astly, the small, hard kernel o f A rgen tin a’ s flint corn is considered superior to the Am erican corn fo r p ou ltry feeding in som e parts o f E urope and on the Pacific coast o f the United States. F or these reasons, Argentina is in a more favorable com petitive p osition than the United States to do a large corn export business.
F or a fu ller discussion, see Schultz, T heod ore W ., “ T he T ariffs on Barley, Oats and Corn,” T ariff Research Committee, M adison, W iscon sin, 1933. See also Jefferson, Mark. “ P eop lin g o f the A rgentine Pam pa,” W hitbeck, R. H., and Finch, V. C., “ E conom ic G eography,” pp. 301-315; and Smith, J. Russel, “ Industrial and Com m ercial G eography,” 1925, pp. 109-110, referred to by Schultz.
In the group of northern European countries, Denmark and the Irish Free State hold a conspicuous place as importers of corn. These countries are both serious competitors in our for eign pork and pork products trade. In this group are also Great Britain and Germany, which are important foreign con sumers of our pork and pork products. Presumably, the larger proportion of the imports of corn by northern European countries is being fed to hogs.
Corn imports by the normally deficit corn producing coun tries, Italy, France, Czechoslovakia and Austria,13 in 1931-32 were more than double those of 1925-26. Spain and Canada were the only countries that decreased their imports. In the non-corn producing countries, with the exception of Germany, the trend of imports is also upward.
This situation can be summarized by saying that foreign corn consuming countries are increasing their imports of corn, at the same time that our exports of corn are decreasing to the vanishing point. Our corn producing competitors are slow ly displacing us in the international corn market.14 This trend was clearly evident before the AAA. Foreign importers of corn are increasing their imports, but they are buying more from our competitors and less from us.
UTILIZATION OF THE UNITED STATES CORN CROP
U TILIZATION OF THE CORN ACREAGE
Let us now consider in some detail the utilization of the corn crop in thé United States.
Not all of the corn in the United States is harvested for grain. Of the average acreage for the two years 1932-33, 4.1 percent was- cut for silage, 9.1 percent was “ hogged down” or used for forage, and the remainder, 86.8 percent, was har vested for grain.15
A considerable variation in the amount of corn acreage used for the above purposes is found in the different sections of the country. In the Corn Belt states, where hog production is concentrated, about 11.9 percent of the crop is “ hogged down,”
15 These p aragraphs are based upon a chart and statistics given in L e Mais Dans L e Com m erce M ondial. Institute International D ’A griculture, Rom e, 1932, pp. 41-2.
14 T his is not because w e are finding it m ore advantageous to ex port our corn in the form o f p ork and pork products, fo r our exports o f p ork and p ork p ro d ucts have also been decreasing.
15 The calculations in this section are m ade from data given in TJ. S. D. A. Statistical Bulletin 28, Corn Statistics, January, 1930 f Y earbook o f 1932, B oard o f Trade, C h icag o; U. S. D. A. Y earbook o f A griculture, 1934.
264
4.8 percent is cut for silage, and about 83.3 percent is harvested for grain. In the dairy states of New England and the Pacific northwest, and also Wisconsin, from 15 to 50 percent of the corn crop is cut for silage, about 10 to 50 percent is “ hogged- down,” and the balance is harvested for grain. In the southern states practically all of the crop is harvested for grain,
MOVEM ENT OF CORN HARVESTED FOR GRAIN
The average amount of corn harvested for grain in the United States during the 5-pear period, 1929 to 1933, was about 2.2 billion bushels. Eighty percent of this amount, or 1.75 billion bushels, was consumed directly on the farms in the counties where grown. The balance, equivalent to about 450 million bushels, was shipped out of the county where grown; this fig ure includes the shipments of corn (about 240 million bushels) which were consigned to the commercial grain markets.
Detailed figures as to the destination of the corn shipped out of the county where grown are difficult to obtain. One source of information quotes the Department of Agriculture as having reported that: “ 59.3 percent of this shipped corn moved east, 8.4 percent west, 9.5 percent north and 22 percent south. *,16
The amount of corn which leaves the farm depends upon several factors, chiefly: (1) The size of the crop and the price of corn, (2) the numbers of livestock being fed, and (3) the crop conditions of the cattle feeders and dairymen in the corn deficit areas. The latter, especially, is one of the determining influences governing corn receipts at the commercial grain markets. In a year of comparatively normal crops in the surplus corn areas and short crops in the deficit corn areas, receipts at the primary markets are likely to be small; ship ments to the deficit corn areas, in such instances, are more commonly handled by the local grain dealers and elevators di rect.17
CHANGES IN CONSUMPTION OF CORN, 1910-14 TO 1926-29
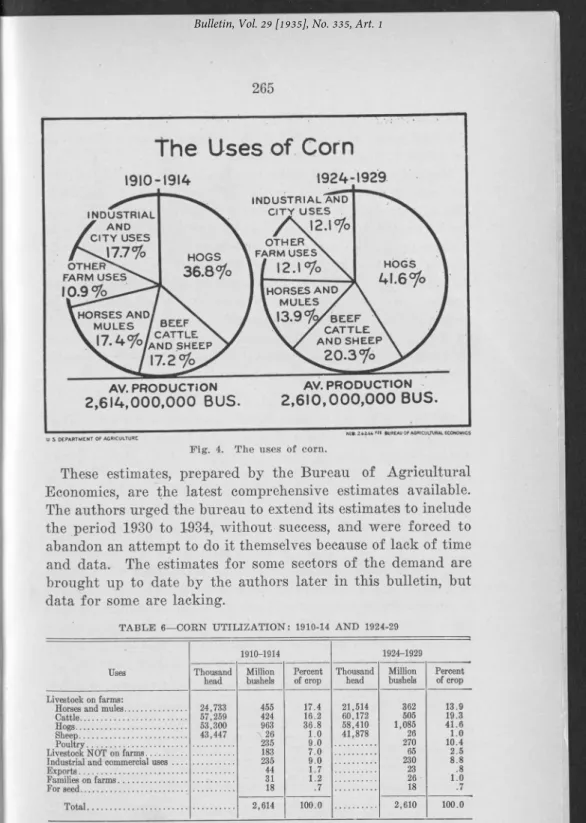
The average consumption of corn by the various outlets for this crop, for the periods, 1910 to 1914, and 1924 to 1929, is given in table 6. The data are shown graphically in fig. 4.
16 W hat Becom es o f N ation’ s Corn Crop ? Ohio Farm er, IV-156, F eb 6, 1926. 17 Bentley, R. C. “ The Movement o f Iow a ’ s Comm ercial Corn and Oats,” and “ The Destination o f Iow a ’ s Com m ercial Corn.” Iow a A gr. E xp. Sta. Buis. 252 and 318, respectively.
The Uses of Corn
1910-1914 1924-1929 AV. PRODUCTION 2 ,6 1 4 ,0 0 0 ,0 0 0 B U S . AV. PRODUCTION 2 ,6 1 0 ,0 0 0 ,0 0 0 B U S . i. S DEPARTMENT OF AGRICULTUREF ig. 4. The uses o f corn.
These estimates, prepared by the Bureau of Agricultural Economics, are the latest comprehensive estimates available. The authors urged the bureau to extend its estimates to include the period 1930 to 1934, without success, and were forced to abandon an attempt to do it themselves because of lack of time and data. The estimates for some sectors of the demand are brought up to date by the authors later in this bulletin, but data for some are lacking.
TABLE 6— CORN UTILIZATION: 1910-14 AND 1924-29
Uses 1910-1914 1924-1929 Thousand head Million bushels Percent of crop Thousand head Million bushels Percent of crop Livestock on farms:
Horses and mules... Cattle... ... Hogs... Sheep... 24,733 57,259 53,300 43,447 455 424 963 \ 26 235 183 235 44 31 18 17.4 16.2 36.8 1.0 9.0 7.0 9.0 1.7 1 .2 .7 21,514 60,172 58,410 41,878 362 505 1,085 26 270 65 230 23 26 18 13.9 19.3 41.6 1.0 10.4 2.5 8 .8 .8 1.0 .7 Livestock NOT on farms...
Industrial and commercial
uses---2,614 1 00.0 2,610 1 00.0
Allowance made for corn cut for silage, hogged down, or used for forage. Source: U. S. D. A. Bureau of Agricultural Economics.
According to the data in the preceding table, 86.2 percent of the total corn crop was fed to the various classes of livestock on farms during the period 1924-29.
Marked changes took place between the two periods in rela tive consumption of corn by the different groups of livestock. The average crop, it will be noted, was approximately the same for both periods, but consumption by horses and mules on farms declined from 17.4 percent in 1910-14 to 13.9 in 1924-29, while that of livestock not on farms declined from 7.0 percent in 1910-14 to 2.5 in 1924-29. On the other hand, cattle, hogs and poultry showed increases in consumption. In other words, horses and mules on farms consumed about 20 percent less corn in 1924-29 than in 1910-14; livestock not on farms consumed 67 percent less and cattle, hogs, and poultry showed increased consumption of 19, 13 and 15 percent, respectively.
THE AGRICULTURAL DEMAND FOR CORN
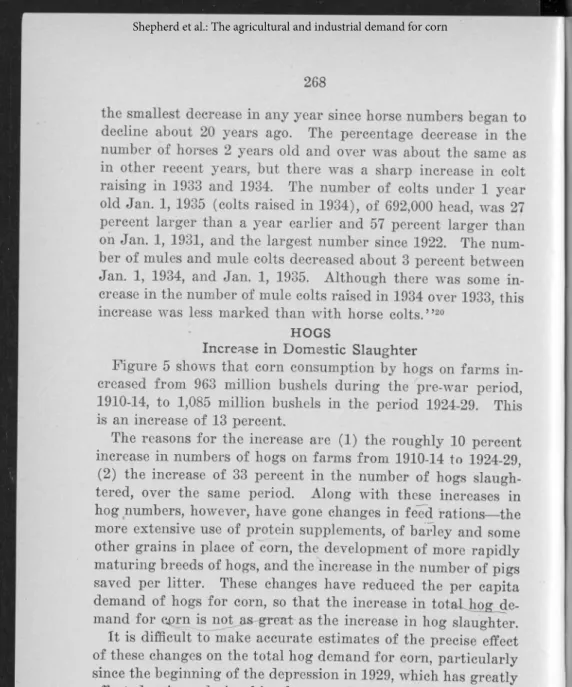
One of the major reasons for the changes in corn consump tion from 1910-14 to 1924-29 is changes in the numbers of the various kinds of livestock in the United States. These changes are shown in fig. 5. The situation for each kind of livestock is discussed in turn in the following sections. The! discussion is somewhat brief, since it is given in some detail an an earlier publication18 which is here brought up to date.
HORSES AND MULES
A drastic reduction has taken place in the numbers of horses and mules in the United States since the World War. The net reduction in the amount of corn formerly consulted by this class of ktock, since 1920, (if the same per capita consumption of corn by horses and mules is assumed for 1935 as for the pe riod 1924-29) amounts to slightly over 180 million bushels.19
. . 18 Shepherd, Geoffrey, The Secular Movement o f Corn Prices, Iow a A gr. Exp. Sta., Res. Bui. 140, 1931.
19T h is figure has been arrived at as fo llo w s : A verage consm ption o f corn, 1924-29 (table 5), 362 m illion bu. Average num ber o f horses and m ules on farm s, 1924-29, 21,514,000. P er capita consum ption o f corn ... ...16.8 bushels.
E stim ated D ecrease in Corn Consum ption H orses and mules on farm s 1920... ... .25,748,000 H orses and m ules not on farm s, 1920... ... 2,084,000
T otal ...__ 27,832,000 H orses and mules on farm s Jan. 1, 1935... 16,622,000
H orses and m ules not on farm s, 1930 (latest av aila ble)... 375,000
- Total....::... ... ... ... 16.997,000 T otal decrease in horses and m ules.... ... 10.835,000 Decrease in corn consum ption @ 16.8 bu. per head... ...182,028,000 The data in. this footn ote are taken from U. S. D. A. Y earbook o f A griculture, 1934, pp. 124 and 623, the 14th Census o f A griculture, V ol. V., p. 614, and U. S- L ivestock R eport, m im eographed, Peb. 15, 1935,
l€ z Ö 193 0 1920 1 9 3 0 1920 1930 1920
N A S S A L L C A T T L E MILK. COWS SHEEP 4 LAMBS HOPSES $■ MULES,
— > ' _. . « «n, Iowa State College Agricultural Boonomios Chart No. B-201
F ig. 5. Num ber o f anim als on fa rm s as o f Jan. 1, 1920 to 1934.
Horses and mules now consume only 11 percent of the corn crop7"when formerly (just before the war) they took 17.4 per cent. "That is, the horse and mule demand for corn during the past 20 yhars has been cut 40 percent.
The decline in the number of horses and mules is the result, chiefly, of t h i substitution of motor power for animal power, which was given a great impetus by the World War. While farm purchases of mechanized equipment have declined during the past 2 or 3 years, this decline can be attributed to the ill- effects which the depression has had upon farm income, rather than to the. lack of potential demand for this kind of equip ment. The number of tractors on farms, according to census figures, increased 2.5 times from 1920 to 1930, to a total of 920,- 000 for the latter years; truck numbers increased about 5.5 times, to a total of 900,385 in 1930.
This substitution of mechanical power for animal power has not yet reached its limits, but it is beginning to approach them. The decline in the number of horses and mules appears now to be slowing down. <4In the case of horses the decrease from Jan. 1,1934, to Jan. 1,1935, was only about 1 percent and was
the smallest decrease in any year since horse numbers began to decline about 20 years ago. The percentage decrease in the number of horses 2 years old and over was about the same as in other recent years, but there was a sharp increase in colt raising in 1933 and 1934. The number of colts under 1 year old Jan. 1, 1935 (colts raised in 1934), of 692,000 head, was 27 percent larger than a year earlier and 57 percent larger than on Jan. 1, 1931, and the largest number since 1922. The num ber of mules and mule colts decreased about 3 percent between Jan. 1, 1934, and Jan. 1, 1935. Although there was some in crease in the number of mule colts raised in 1934 over 1933, this increase was less marked than with horse colts.” 20
HOGS
Increase in Domestic Slaughter
Figure 5 shows that corn consumption by hogs on farms in creased from 963 million bushels during the pre-war period, 1910-14, to 1,085 million bushels in the period 1924-29. This is an increase of 13 percent.
The reasons for the increase are (1) the roughly 10 percent increase in numbers of hogs on farms from 1910-14 to 1924-29, (2) the increase of 33 percent in the number of hogs slaugh tered, over the same period. Along with these increases in hog numbers, however, have gone changes in feed rations—the more extensive use of protein supplements, of barley and some other grains in place of 'corn, the development of more rapidly maturing breeds of hogs, and the Increase in the number of pigs saved per litter. These changes have reduced the per capita demand of hogs for corn, so that the increase in totaljio g de- mand for cprn. isjnot>s--greEt as the increase in hog slaughter.
It is difficult to make accurate estimates of the precise effect of these changes on the total hog demand for corn, particularly since the beginning of the depression in 1929, which has greatly affected price relationships between hogs and hog feeds and between hog feeds themselves. Intensive research into this section of the demand for corn is required. Pending such re search, we can only point out that if hog slaughter fails to in crease above 1924-29 levels (and at present, owing toVthe AAA program and the 1934 drouth, hog slaughter is substantially be low those levels) the decrease in per capita hog demand for
20 T he A g ricultural Situation. M arch 1, 1935. Volum e 19, No. 3 W a sh in s-
corn which is likely to continue in the future will decrease the total hog demand for corn.
CATTLE
Consumption of corn by cattle was estimated in 1910-14 at 424 million bushels per year; in 1924-29 it was 505 million bush els, an increase of 81 million bushels, or 19 percent (see table 5). Numbers of cattle on farms for these periods were 57,259,- 000 and 60,172,000, respectively; reduced to a per capita basis, corn consumption was 7.4 and 8.4 bushels, respectively.
Part of the increased corn consumption for 1924-29 as com pared with that of 1910-14 is therefore explained by the in crease in cattle numbers. But since the per capita cattle con sumption of corn increased also, there must have been other factors operating as well. One of these factors may well be the increased milk production per cow during the period 1924- 29. Although there was relatively little change in the milk cow numbers during these years, milk production per cow increased from 2,903 pounds in 1924 to, 4,426 pounds in 1929.21
This increase in milk production per cow resulted from im provements in care and management, and from more intensive feeding.
POULTRY
The consumption of corn by poultry increased from 9 percent of the total crop in 1910-14 to 10.4 percent of the crop in 1924- 29. Apparently, there has been little increase since 1926; the number of chickens on farms since 1926 has fluctuated closely about 450 million.
SHEEP
The consumption of corn by sheep for the periods 1910-14 and 1924-29 shows no change, although the number of sheep on farms in the latter period was slightly below that of 1910-14. The amount of corn for both periods was estimated at 26 mil lion bushels, or about 1 percent of the total corn crop.
Sheep production, followiiag a period of 9 years of expansion in numbers, (from 1924 to 1932 inclusive), is now declining. The data in the preceding paragraph indicate, however, that changes in sheep numbers cause very little change in the total
21 Num ber o f dairy cow s in 1924, 22,288,000; in 1929, 22,330,000. T he highest num ber fo r the p eriod w as in 1925, 22,505,000; the low est num ber w as in 1928, 22,129,000. U. S. D. A. Y earbook o f A griculture, 1933, p. 634. F igu res on m ilk p rod uction obtained from the pam phlet, “ T he A g ricu ltu ral Situation,” Bureau o f A gricu ltu ral E conom ics, U. S. D. A* V ol. 18, No. 5, M ay, 1934, p, 10-11,
consumption of corn, since sheep consume a very small per centage of the total crop.
OTHER CHANGES IN TH E AGRICULTURAL DEMAND FOR CORN
Two small agricultural outlets for corn remain to be dis cussed : The amount of corn consumed by families on farms and that used for seed purposes. The combined corn consumption by these outlets amounts to about 1.5 percent of the crop.
In 1910-14 families on farms consumed 31 million bushels of corn ; for the period 1924-29 this figure dropped to 26 million bushels, a decline of about 16 percent. In keeping with the changing dietary habits of the American people, the corn con sumed by families on the farm will, undoubtedly, show a fur ther decline in the coming years.22
The amounts of corn used for seed purposes during the two periods under consideration were identical— about Ï8 million bushels. Future requirements will depend, of course, upon the trend of corn production. Present indications point to some decline in acreage; changes in the amount of seed employed, however, will be negligible.
THE INDUSTRIAL DEMAND FOR CORN
About 7 percent of the total United States corn crop is used for industrial purposes ; it is ground or otherwise processed in corn products factories and made into cornstarch, corn sirup, corn sugar, corn meal, hominy, breakfast foods, industrial alco hol, and a number of by-products.
An idea of the relative importance of the industrial demand for corn may be gained by.comparing it with some of the sec tions of the agricultural demand. Since the industrial demand takes about 7 percent of the corn crop, it is two-thirds as im portant as the demand for feeding to horses and mules, which now; takes about 11 percent of the crop. It is roughly equal to one-third of the demand for feeding to cattle. And it is nearly equal to the lard section of the hog demand for corn, since the total hog demand takes between 40 and 45 percent of the corn crop, and lard represents about one-fifth of the value of hpgs.
22 U.. S. D. A., E con om ic bases fo r the A gricu ltu ral A d ju stm en t A ct, D ecem ber, 1933, p. 36.
OF CORN
The statement is often made that the corn which flows through the channels of trade, even though it is less than 10 percent of the total production of corn, sets the price for the entire crop. The further opinion is sometimes added that if a new industrial use for corn were discovered, which would use up say 5 percent of the total crop, that would increase the industrial demand 50 percent, and that in turn would raise the price of corn 50 percent.23
This view is not borne out by the facts. Statistical studies have shown that the chief factors determining the price of corn are : (1) The demand for meat, which is reflected in the num bers of livestock (which consume over 85 percent of the corn crop) and the prices of livestock, and (2) the size of the total United States corn crop.24 There is no statistical indication that the amount of corn which passes through the markets is an important price determining factor.
An increase in industrial demand which opened up a new outlet for 5 percent of the total production of corn would have the same effect on prices as an equal increase in demand com ing from any other source—increased number of hogs, or cat tle, or horses and mules, on the/ farm or off. The statistics in dicate that an increase in consiumption equal to 5 percent of the total crop, from whatever sóurce, would raise the farm price of corn about 8 percent. Thit is well worth going after, of course. But we should not delùde ourselves into thinking that if the 5 percent increase came fiiom some new industrial outlet, it would raise prices 50 percent^ It would raise them only 8 percent. Our energies will be better directed if we focus our attention on this more modest gain.
THE M ILLED PRODUCTS OR “DRY-PROCESS” INDUSTRY
The industrial demand for corn origiñates from three chief sources: (1) The milled products industry, (2) the corri prod ucts refining industry, and (3) the manufacturers of industrial alcohol, distilled spirits <Wl cereal beverages. We shall discuss these sources of industriar demand in the order given.
23 Des M oines R egister, Aug. 25, 1932. E ditorial Page.
24 Shepherd, Geoffrev. Annual fluctuations in the p rice o f corn. Iow a Agr. Exp. Sta., Bui. 160. 1930.
The milled products or “ dry-process” industry embraces the manufacturers of the various cereal foods. The industry gets its name from the fact that it grinds or mills corn in a dry con dition. The chief products manufatured .from corn in this in dustry are four in number—flaked hominy and hominy grits, corn meal, corn flour and corn breakfast foods.25
In the manufacture of these products, the hull and germ of the corn26 are first removed. The rest of the corn, the starchy body of the seed, is then coarsely crushed and screened. The very coarse particles are sold as flaked hominy; when more finely ground they are sold as hominy grits. When the grind ing process is carried still further, the product becomes corn meal, and finally, corn flour.
Decrease in Consumption of Com by Milled Products Industry
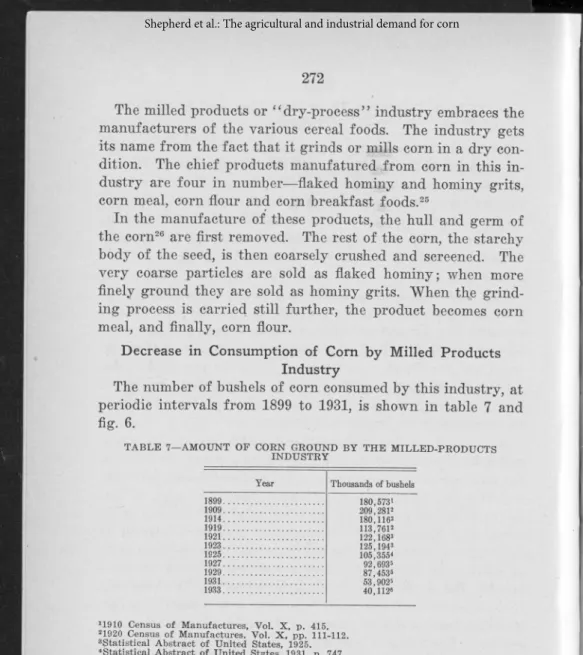
The number of bushels of corn consumed by this industry, at periodic intervals from 1899 to 1931, is shown in table 7 and fig. 6.
TABLE 7—AMOUNT OF COEN GROUND BY THE MILLED-PRODUCTS INDUSTRY
Year Thousands of bushels 1899... 180,573» 1909... 209.2812 1914... 180,1162 1919... 113,7612 1921... 122,168s 1923... 125,194s 1925... 105,355« 1927... 92,693= 1929... 87,453s 1931... 53,902s 1933... 40,112«
11910 Census o f Manufactures, Vol. X, p. 415. 21920 Census o f Manufactures, Vol. X , pp. 111-112. »Statistical Abstract of United States, 1925. «Statistical Abstract of United States, 1931, p. 747. »Statistical Abstract of United States, 1933, p. 631.
»Letter from Norman F. Kennedy, Director of Research, Corn Industries Research Foundation, New York City.
Figure 6 shows that before the war, the milled products in dustry used about 200 million bushels of corn annually. This was about 8 percent of an average United States corn crop. After the war, the annual consumption of corn by the milled
25 Corn breakfast fo o d s— corn flakes, fo r exam ple— are considered as being separate from the m illed p rod ucts ind ustry in the Census o f M anufacturers, F o r present purposes, however, this corn fo o d p rod u ct can be discussed under m illed p roducts, since corn m illin g establishm ents also prod uce corn breakfast fo od s as secondary products.
26 T he corn kernel consists o f three parts, (a) the outer coverin g, or hull ; (b ) the endosperm , or starchy b o d y o f the seed ; (e) the em bryo, or germ.
F ig. 6. A m ount o f corn g row n by m illed p rod u cts industry.
products industry declined to about 100 million bushels. Dur ing the recent depression, consumption declined further, to 40 million bushels. This is about 2 percent of an average United States corn crop.
The downward trend in corn consumption by this industry has been very pronounced, especially since the close of the World War. It is, in the main, the result of a shift in human dietary habits from the starchy type of foods to those richer in protein. This shift in turn has resulted chiefly from the declin ing proportion of our population that is engaged in muscular work, and from the rise in the standard of living of certain groups, particularly of negroes who have come north since the World War. In addition, the exports of milled corn products have substantially declined.27
The dietary changes which have reduced the consumption of milled corn products in the past are likely to persist and in fact to carry on further in the future. There will probably be some recovery from the low levels of consumption of milled corn products during the recent depression, but it seems likely that the general trend of the consumption of corn by the milled products industry in the future will be downward.
Increase in Consumption of Corn Breakfast Foods
The consumption of one somewhat minor milled corn product, corn breakfast foods— corn flakes, etc.—has been increasing in recent years, in contrast with the general downward trend. Cen sus figures for the production of corn breakfast foods were taken separately for the first time in 1925; production has in creased from 250 million pounds then to 385 million pounds in 1931. No estimate is given in the census reports as to the corn equivalents of these figures. The Bureau of Agricultural Eco nomics, however, estimates that one bushel of corn is converted, on the average, into 21 pounds of corn breakfast foods. This means that 12 million bushels of corn were made into corn breakfast foods in 1925, and 18 million bushels in 1931. The percentage increase is great, and further increases are likely to take place; but the amounts involved are comparatively small.
Net Effect of Dietary Changes on Com Consumption
It has sometimes been suggested that a campaign should be started to increase the consumption of the milled corn products in the average American diet, with the object of increasing the demand for corn. Such a campaign, however, would be work ing against the trend, and even if successful would result only in the displacement of some other food product from the aver age menu. This is clearly brought out by the Department of Agriculture in a study of changes in the consumption of food products per person, from 1909 to 1931. This study shows that while there has been a decline in the per capita consumption of all cereal products, at the same time, increases in the consump tion of other food products, principally fruits, vegetables, sugar, meat and dairy products, have offset these declines, so that little or no change has occurred in the total per capita food consumption.28
On the whole, as one authority states,29 the shift from the direct consumption of corn in the form of corn meal, corn flour, etc., should not be looked upon by the Corn Belt farmer with regret. The increase in the consumption of meat and dairy
28 U.S.D.A., E conom ic Bases fo r the A g ricultural A djustm ent Act, December, 1933, p. 36.
29 O. E. Baker, Bureau o f A gricultural E conom ics, W ashin gton , D. C. The T rend o f A gricultural P rod u ction in North Am erica and its Relation to E urope gnd Asia. p. 211,
products has provided an outlet for considerably more corn than would have been the case if the population had continued to consume this grain in its various direct preparations.
TH E CORN PRODUCTS REFINING OR “WET-PROCESS” INDUSTRY
The second important industrial outlet for corn listed above is the corn products refining or “ wet-process” industry, so called because it steeps corn in water before grinding it.
The chief products of this industry are cornstarch, corn sirup and corn sugar. There are numerous by-products. The industry offers a fertile field for expansion of the present com mercial and industrial uses for corn. It is the research chemist and engineer who have been largely responsible for the devel opment here, and there are good prospects for further discov eries by the men in these two fields.
A brief historical sketch of the development of the corn products industry will provide a background for a study of the industry today and its prospects for the future.
Historical Development of the Corn Products Refining Industry
Cornstarch was the first product manufactured from corn. About 75 years ago one Thomas Kingsford established a plant at Oswego, N. Y. The enterprise proved profitable, and within a comparatively short time others were attracted to this field. Increasing competition drove the cornstarch manufacturers to convert the waste products remaining after the extraction of the starch into useful by-products. The recovery of gluten was an example of this. Originally, the gluten was collected in a wet condition and sold to local farmers for feeding pur poses. Eventually, as the output of cornstarch increased, the local outlets for the wet gluten feed became unable to absorb the increasing quantities of this by-product. This led to drying the gluten feed, to permit shipping it to distant points. In a Similar manner, the hull of the corn was transformed from a waste product to a valuable by-product and sold as corn bran. Later, through the application of chemical research, the manufacture of corn sirup was started. In time, the next im portant step in the industrial utilization of corn, the recovery of the germ which yields corn oil, was undertaken.
Present Status of the Corn Products Refining Industry
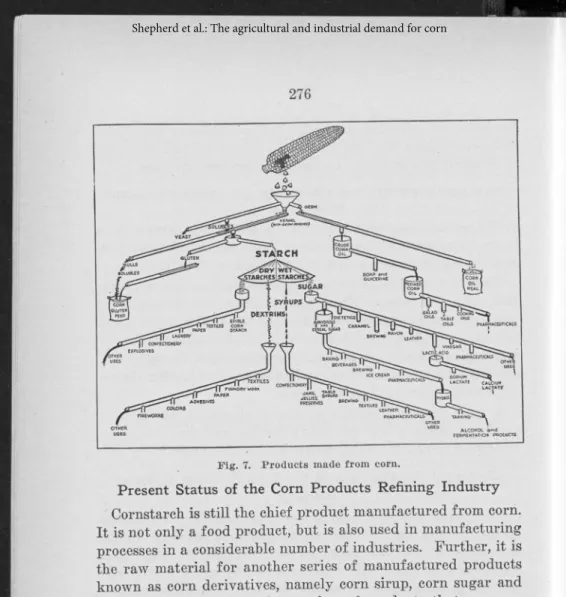
Cornstarch is still the chief product manufactured from corn. It is not only a food product, but is also used in manufacturing processes in a considerable number of industries. Further, it is the raw material for another series of manufactured products known as corn derivatives, namely corn sirup, corn sugar and dextrin. Some idea of the number of products that are now being extracted from corn in the refining processes can be ob tained from the accompanying chart, fig. 7.
Consumption of Corn by the Com Products Refining Industry
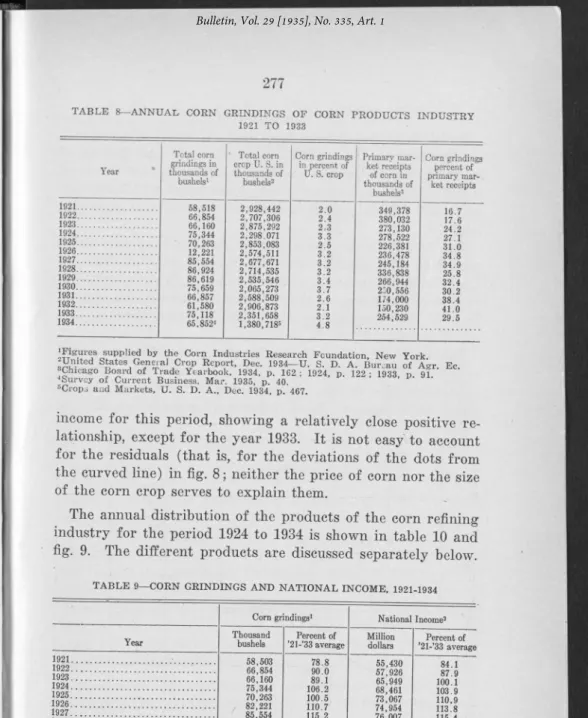
The annual corn grindings of the corn products industry, for the period 1921-34, inclusive, are given in table 8. The average consumption of corn by the corn products refining in dustry, expressed in percentage of the average total corn crop for 1921-33, amounts to 2.83 percent. This constitutes about one-third of the primary market receipts of corn.
Table 9 shows that the corn products industry is very sensi tive to economic conditions. In fig. 8, total grindings for the year 1921 to 1933 are plotted against an index of total national
TABLE 8— ANNUAL CORN GRINDINGS OF CORN PRODUCTS INDUSTRY 1921 TO 1933 Year Total com grindings in thousands of busheb1 * Total com crop U. S. in thousands of busheb* Corn grindings in percent of U. S. crop 1921... 58,518 2,928,442 2 .0 1922... 66,854 2,707,306 2.4 1923... 66,160 2,875,292 2,3 1924... 75,344 2,298,071 3.3 1925... 70,263 2,853,083 2.5 1926... 12,221 2,574,511 3.2 1927... 85,554 2,677,671 3.2 1928... 86,924 2,714,535 3.2 1929... 86,619 2,535,546 3.4 1930... 75,659 2,065,273 3.7 1931... 66,857 2,588,509 2 .6 1932... 61,580 2,906,873 2 .1 1933... 75,118 2,351,658 3.2 1934... 65,852* 1,380,718* Primary mar- . ket receipts of com in thousands of bushels* 349,378 380,032 273,130 278,522 226,381 236,478 245,184 336,838 266,944 250,556 174,000 150,230 254,529 Corn grindings percent of primary mar-. ket receipts 16.7 17.6 24.2 27.1 31.0 34.8 34.9 25.8 32.4 30.2 38.4 41.0 29.5
‘ Figure8 supplied by the Corn Industries Research Foundation, New York ^Umted States General Crop Report, Dec. 1934— U. S. D. A. Bureau of Agr. Ec »Chicago Board of Trade Yearbook, 1934, p. 162 ; 1924, p. 122 • 1933 p 91 ■•Survey o f Current Business, Mar. 1935, p. 40. ’ »Crops and Markets, U. S. D. A., Dec. 1934, p. 467.
income for this period, showing a relatively close positive re lationship, except for the year 1933. It is not easy to account for the residuals (that is, for the deviations of the dots from the curved line) in fig. 8; neither the price of corn nor the size of the corn crop serves to explain them.
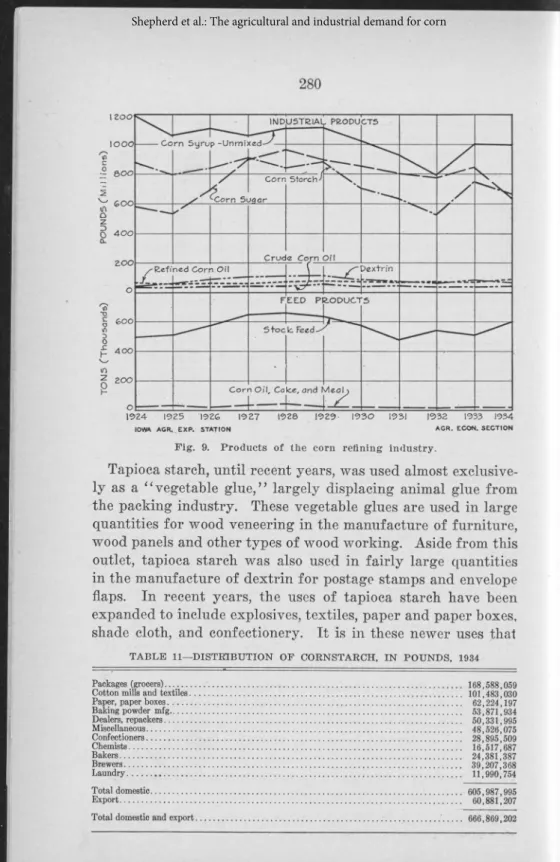
The annual distribution of the products of the corn refining industry for the period 1924 to 1934 is shown in table 10 and fig. 9. The different products are discussed separately below.
TABLE 9— CORN GRINDINGS AND NATIONAL INCOME, 1921-1934
Year 1921. 1922. 1923. 1924. 1925. 1926. 1927. 1928. 1929. 1930. 1931. 1932. 1933. 1934. Corn grindings1 Thousand busheb 58,503 66,854 66,160 75,344 70,263 82,221 85,554 86,924 86,619 75,659 66,857 61,580 75,118 65,852* National Income* Percent of
’21-’33 average Milliondollars ’21-’33 averagePercent of
78.8 55,430 84.1 90.0 57,926 87.9 89.1 65,949 100.1 106.2 68,461 103.9 100.5 73,067 110.9 110.7 74,954 113.8 115.2 76,007 115.4 117.0 77,291 117 3 116.6 79,702 120.9 101.8 72,890 1 10.6 90.0 60,790 92.3 83.1 47,900 72.7 101.1 46,030 69.9 84.5 51,920 78.8
^Figures suppiied by Corn Industries Research Foundation, New York.
A. Bureau of Agr. Ec., The Agricultural Situation, Feb. 1935, p. 5. Their 1934 figure is estimated.
Cornstarch
It will be observed from fig. 9 that the trend in cornstarch production from 1927 to 1932 was downward. An increase of about 200 million pounds was recorded for 1933,' but this level is still below that of earlier years. Production for 1934 amount ed to 667 million pounds, distributed by trades as shown in table 10.
The decline in the production of cornstarch appears to be caused by (a) reduced industrial demand resulting from re duced industrial activity, as shown in fig. 8, (b) a reduction in exports of cornstarch, as shown in table 12 later in this section, and (c) increasing competition from imported starches, also shown in table 12.
Exports of cornstarch during the past year (1934) amounted to less than one-fourth of the 1921-30 average. From present indications, this decline may continue in the future. In the April, 1933, issue of “ Food Industries,” a trade magazine, it
IOWA AGR. EXP. S T A . AGR- EGON. SECTION
Year Com sirup umnixed (millions of pounds) Cornstarch (millions of pounds) Com sugar (millions of pounds) Dextrin (millions of pounds) 1924... 1,196 877 557 42 1925... 1,060 799 535 59 1926... 1,109 836 697 93 1927... 1,065 906 897 103 1928... 1,107 839 969 110 1929... 1,111 880 895 114 1930... 1,026 711 849 89 1931... 929 635 802 79 1932... 795 529 777 62 1933... 1,001 742 842 86 1934... 996 667 634 70 Year
Crude com oil (millions of
pounds)
Refined corn oil (millions of
pounds)
Stock feed (tons)
Com oil, cake (tons) 1924... 37 68 497,042 27,041 1925... . 31 59 509,887 29,775 1926... 38 66 575,890 23,032 1927... 40 58 647,547 37,527 1928... 44 74 658,767 39,536 1929... . 54 79 634,068 27,383 1930... 40 78 576.121 24,832 1931... 42 72 479,123 20,828 1932... 35 76 542,228 18.034 1933... 34 81 507,593 22,807 1934... 42 87 599,033 21,351
Note : Corn sirup used for mixing is included in corn sirup unmixed.
Data in tables 9 and 10 from Corn Industries Research Foundation, New York.
is stated that some American mills had transferred to foreign countries that production which had previously been conducted in the United States for shipment abroad, because of the lower price of corn abroad. The Corn Industries Research Founda tion states that entry into foreign manufacture was a result of foreign tariff restrictions and an effort to hold business, and was not due solely to cheaper foreign corn. Whatever the rea son for thè decline in exports, the fact is that some of the for eign outlet for cornstarch has disappeared and domestic pro duction of cornstarch has declined.
Competition Between Cornstarch and Imported Tropical Starches
During the past few y^ars cornstarch has encountered strong competition, both at home and abroad, from starch made from “ cassava,” commonly known as tapioca. Imports of cassava starch, in the main,, come from Java. They enter this country- duty free, as this commodity is considered a food item rather than a raw material for the industrial market.30
30 T he duty on other starches and m aterials fo r starch m aking at present are: p otato dextrin, 3c per pound ; potato starch, 2% c per pound ; all other starches not especially provided fo r , l % c per pound.
F ig. 9. P rod u cts o f the corn refining industry.
Tapioca starch, until recent years, was used almost exclusive ly as a “ vegetable glue,” largely displacing animal glue from the packing industry. These vegetable glues are used in large quantities for wood veneering in the manufacture of furniture, wood panels and other types of wood working. Aside from this outlet, tapioca starch was also used in fairly large quantities in the manufacture of dextrin for postage stamps and envelope flaps. In recent years, the uses of tapioca starch have been expanded to include explosives, textiles, paper and paper boxes, shade cloth, and confectionery. It is in these newer uses that
TABLE 11—DISTRIBUTION OF CORNSTARCH, IN POUNDS, 1934
Packages (grocers)... ... ... ... ... ... 168,588,059 Cotton mills and textiles... ... ... 101,483,030 Paper, paper boxes... 62,224,197 Baking powder mfg... 53,871,934 Dealers, repackers... 50,331,995 Miscellaneous... 48,526,075 Confectioners... 28,895,509 Chemists... ... ... 16,517,687 Bakers... 24,381,387 Brewers... 39,207,368 Laundry... 11,990,754 Total domestic... ... ... 605,987,995 Export... ... 60,881,207 Total domestic and export
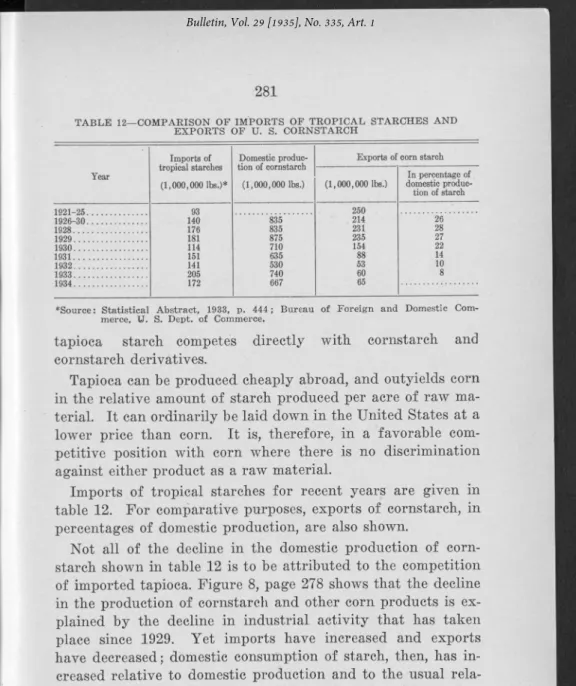
TABLE 12— COMPARISON OF IMPORTS OF TROPICAL STARCHES AND EXPORTS OF U. S. CORNSTARCH Imports of tropical starches (1,000,000 lbs.)* Domestic produc tion of cornstarch (1,000,000 lbs.)
Exports of corn starch Year (1,000,000 lbs.) In percentage of domestic produc tion of starch 93 140 250 1926-30... 835 . 214 26 1928... 176 835 231 28 1929... 181 875 235 27 1930... 114 710 154 22 1931... 151 635 88 14 1932... 141 530 53 10 1933... 205 740 60 8 1Q34 172 667 65
♦Source: Statistical Abstract, 1933, p. 444; Bureau of Foreign and Domestic Com merce, U. S. Dept, of Commerce.
tapioca starch competes directly with cornstarch and cornstarch derivatives.
Tapioca can be produced cheaply abroad, and outyields corn in the relative amount of starch produced per acre of raw ma terial. It can ordinarily be laid down in the United States at a lower price than corn. It is, therefore, in a favorable com petitive position with corn where there is no discrimination against either product as a raw material.
Imports of tropical starches for recent years are given in table 12. For comparative purposes, exports of cornstarch, in percentages of domestic production, are also shown.
Not all of the decline in the domestic production of corn starch shown in table 12 is to be attributed to the competition of imported tapioca. Figure 8, page 278 shows that the decline in the production of cornstarch and other corn products is ex plained by the decline in industrial activity that has taken place since 1929. Yet imports have increased and exports have decreased; domestic consumption of starch, then, has in creased relative to domestic production and to the usual rela tion of domestic consumption to domestic industrial activity.
(The reasons for this increase are given below.) What has happened, apparently, is that domestic production has not re ceived the full benefit of increased domestic consumption. That is, the competition of tapioca at home and abroad has reduced the domestic production of cornstarch, not absolutely, but rela tively to the expansion in domestic demand.
It is because of this situation that pressure is being exerted by the corn products industry for a revision of the tariff on