DigitalCommons@University of Nebraska - Lincoln
DigitalCommons@University of Nebraska - Lincoln
Dissertations and Theses in Agricultural
Economics Agricultural Economics Department
2010
Essays on Industrial Organization and Environmental Economics
Essays on Industrial Organization and Environmental Economics
Gibson Nene
gnene10@yahoo.com
Follow this and additional works at: https://digitalcommons.unl.edu/agecondiss
Part of the Agricultural and Resource Economics Commons
Nene, Gibson, "Essays on Industrial Organization and Environmental Economics" (2010). Dissertations and Theses in Agricultural Economics. 4.
https://digitalcommons.unl.edu/agecondiss/4
This Article is brought to you for free and open access by the Agricultural Economics Department at
DigitalCommons@University of Nebraska - Lincoln. It has been accepted for inclusion in Dissertations and Theses in Agricultural Economics by an authorized administrator of DigitalCommons@University of Nebraska - Lincoln.
ECONOMICS
By
Gibson Nene
A DISSERTATION
Presented to the Faculty of
The Graduate College at the University of Nebraska In Partial Fulfillment of Requirements For the Degree of Doctor of Philosophy
Major: Agricultural Economics
Under the Supervision of Professor Azzeddine Azzam and Professor Karina Schoengold
Lincoln, Nebraska
Gibson Nene, Ph.D.
University of Nebraska-Lincoln, 2010 Advisors: Azzeddine Azzam and Karina Schoengold
This dissertation studies environmental regulation issues in the hog production industry as well as forces behind the reorganization of the industry during the past two decades. Federal and State-level environmental regulations imposed on U.S. hog production during the year 2003 are examined in Chapter 1. Based on the number of regulations passed by the Federal government and states, the 2003 regulatory index is constructed. The regulatory stringency index suggests that state-level regulations vary across states and have increased over the years. In addition, state-level regulations are more stringent than federal regulations.
Chapter 2 develops an empirically implementable theoretical model which allows us to investigate the long-run effects of environmental regulations on the U.S. hog
industry. Hog feeding operations (HFOs) are divided into large feeding operations (LHFOs) and small feeding operations (SHFOs). The impact of the presence of a large number of LHFOs on the entry and exit of CHFOs is also examined. Results of this study suggest that: Increased state-level regulation stringency significantly lowers the output of SHFOs; increased state-level regulation stringency significantly lowers the output of LHFOs; increased state-level regulation stringency significantly lowers the number of SHFOs; SHFO output rises significantly in states that have a greater number of LHFOs; LHFO output rises significantly in states that have a greater number of LHFOs; the number of SHFOs significantly increases in states that have a greater numbers of LHFOs;
size.
Chapter 3 examines the importance of input availability, market attractiveness, agglomeration economies and environmental regulations on the reorganization of U.S. hog production for a panel of 22 U.S. hog producing states which include, Northern states, Southern states and Midwest states for the period 1994-2006. Results from this study suggest that: Hog production in a state is positively affected by hog production in a nearby state, confirming the presence of agglomeration economies; Environmental regulations and high corn price have negative effects on state-level U.S. hog production; High hog prices, and favorable labor cost, and land values attract hog production; and transportation cost has no effect on hog production.
Acknowledgements
I would like to express my sincere appreciation to everyone who made a positive
contribution towards my graduate program. I would like to take this opportunity to thank my dissertation committee members: Dr. Azzeddine Azzam, Dr. Karina Schoengold and Dr. Amalia Yiannaka and Dr. Mathew Cushing for their guidance, support ,
encouragement and patience throughout my dissertation work.
I greatly appreciate the financial assistance I received from the Department of Agricultural Economics which made it possible for me to complete my PhD work. I am also thankful to the department for providing me with teaching opportunities an
experience that proved to be new to our research oriented program. I would like to thank the faculty, students and staff in the department for creating a conducive and enjoyable learning environment.
I could not have made it this far without the support of my wife, Yean Ching Tan. Thank you Yean Ching for your love and patience throughout my academic journey. I would like to thank my parents Mr. Joseph Nene and Mrs. Mary Nene; my grandparents Mr. Gibson Nene and Mrs. Clara Nene; and my siblings Clara Nene and her family, Annacleta Nene, and Cecilia Nene for their encouragement, motivation and for being there throughout my quest for academic success. Even though my grandfather and my young sister Annacletta are no longer with us, they must be enjoying this moment
wherever they are. I am also thankful to my aunt Dr. Annacletta Chiweshe, my uncle Mr. Bothwell Chiweshe and their children, Eunice Chiweshe, Joseph Chiweshe and Zwanai Chiweshe for their moral support throughout my academic career in the U.S. I am grateful to my cousins: Susan Shoko, Rudo Shoko, Charlene Shoko, Fridis Chanakira, Caroline Soko, Oswald Soko, Richard Soko, Matilda Chanakira and Elijah Chanakira for
their moral support toward my graduate career. I am also grateful to the support and encouragement from Yean Ching’s family: Kok How Tan, Chiew Hui Kaw, Chiew Kwei Kaw and Charlotte Tan.
I would also want to thank my friends: Dennis, Phiniel, Pavel, Afua, Trevor, Innousa, David, Edward, Mike, Edwin and his wife Michel for their support.
Table of Contents
Acknowledgements ... iv
Table of Contents..………vi
List of Tables………vii
List of Figures……….viii
Chapter 1: Federal and State Regulation on Hog Feeding Operations ... 1
1.1. Introduction ... 1
1.2. Environmental Regulations on Hog Farms in the U.S.: A Summary of Federal Regulations. ... 2
1.3. Environmental Stringency Construction: State-level Regulations versus Federal-level Regulations ... 8
1.4. State-level Environmental Regulations 1994, 1998, 2000 and 2003 ... 12
1.5. Summary and Conclusions. ... 13
Chapter 2: Environmental Regulation and the Structure of U.S. Hog Farms ... 15
2.1: Introduction ... 15
2.2. Background of the U.S Hog Industry ... 20
2.3: Literature Review ... 24
This section will review the relevant literature to the current study. ... 24
2.3.1. Relevant literature on regulation and market structure ... 24
2.3.2. Environmental regulations and stringency literature in the hog industry. ... 29
2.3.3. Environmental regulations and stringency literature in other livestock industries. ... 34
2.4: Theoretical framework ... 36
2.4.1. Model of an Industry with Heterogeneous Firm Size ... 36
2.4.2. Measuring the Effects of Increased Environmental Regulation ... 40
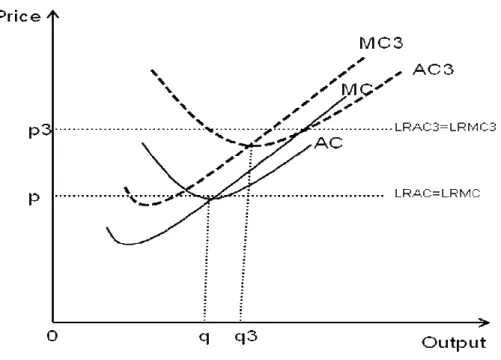
2.4.1. Discussion of Results from the Economic Model ... 42
2.4.4. Impact of Environmental Regulation on Industry Output and Price ... 49
2.4.5. Impact of LHFOs on Industry Equilibrium ... 51
2.5. Empirical Model and Analysis... 53
2.5.1. Empirical Model Development ... 53
2.5.2 .Econometric Model for Estimation ... 54
2.5.3. Description of Data and Variables ... 56
2.5.4. Empirical Results ... 64
2.5.5. Regulation and Average Farm-size ... 70
2.6: Summary and Conclusions ... 71
Chapter 3: The Reorganization of U.S. Hog Production during the past two decades: What were the driving forces? ... 76
3.1. Introduction ... 76
3.2. Review of Spatial models ... 83
3.3. Theoretical Model ... 86
3.4. Empirical Model ... 89
3.4.1. Data ... 93
3.6. Conclusions ... 101
References ... 103
Appendix A: Understanding state-level Environmental Regulations on Hog Farms in the Top 10 Hog Producing States ... 111
A.1. Illinois ... 111 A.2. Indiana ... 115 A.3. Iowa ... 116 A.4. Kansas ... 121 A.5. Minnesota ... 123 A.6. Missouri ... 125 A.7. Nebraska... 127
A.8. North Carolina... 131
A.9. Ohio ... 133
Source: Livestock Environmental Assurance Program 2003 Fact Sheet... 134
A.10. Oklahoma ... 135
Appendix B: State-level Environmental Indices ... 138
List of Tables
Table 1: 2003-2009 State and Federal Regulations on HFOs... 10Table 2: 2003-2009 State and Federal setback requirements for HFOs ... 11
Table 3: 1994, 1998, 2000 and 2003 State-level Environmental Legislation ... 12
Table 4: State-level Regulation stringency ranking ... 13
Table 5: 2004 top 10 Hog producing states ... 22
Table 6: 2007 top 10 hog producing states ... 23
Table 7: State-level Environmental Stringency 1994-2006 Time Series Data ... 59
Table 8: Variable Definition and Data Sources ... 63
Table 9: Descriptive Statistics ... 64
Table 10: Regression results using fixed effects and the time variable ... 67
Table 11: SUR Regression results with restrictions on the cost parameters of equations 1 and 3 and homogeneity restriction on equation 1 ... 68
Table 12: SUR Regression results with restrictions on cost parameters of all equations and a homogeneity restriction for equation 1 ... 69
Table 13: Effect of regulation on an average HFO ... 71
Table 14: Units of study ... 94
Table 15: Variable Definition and Data Sources ... 95
Table 16: Descriptive statistics ... 95
Table 17: Results for the 22 major hog producing states... 96
Table 18: Midwest hog producing states ... 97
Table 19: Northern hog producing states ... 98
Table 20: Southern hog producing states ... 99
Table 21: 22 States and Regional 2SLS-SLM Results ... 100
Table 22: Required separation distances (in feet) to buildings or public use areas by type of manure and method of manure application ... 119
Table 23: Required separation distances (in feet) to designated areas by type of manure and method of manure application ... 119
Table 24: Required separation distances (in feet) for land application of irrigated liquid
manure... 120
Table 25: Swine AFO classifications ... 126
Table 26: Summary of Ohio manure application setbacks ... 134
Table 27: State-level environmental indices ... 138
Table 28: Construction of the 2003-2006 State-level Environmental Stringency Index 140
Lists of Figures
Figure 1: Number of U.S Hog operations and Hog inventory ... 21Figure 3: Marginal cost shift equals average cost shift ... 47
Figure 4: Average cost shifts more than the Marginal cost ... 48
Figure 5: Marginal cost shifts more than the Average cost ... 49
Chapter 1: Federal and State Regulation on Hog Feeding Operations
1.1. Introduction
During the late 1990s, the U.S. Department of Agriculture (USDA) and the U.S.
Environmental Protection Agency (EPA) came up with a plan to address pollution from hog feeding operations (Metcalfe, 2000). Federal legislation before 1998, gave states the primary responsibility in regulating hog feeding operations. Several lagoon spills in Iowa, North Carolina, the contamination of the city of Milwaukee’s drinking water, and the link between dairy operations and poor water quality in Erath County in Texas, triggered more federal involvement in the regulation of pollution from animal feeding operations. The largest volume spill in Iowa occurred in 1995 when a malfunctioning lagoon at SNB Farms in Webster City spilled 1.5 million gallons of manure into the South Fork of the Iowa River. In 1996, 586 753 fish were killed in one lagoon spill in the North Buffalo Creek (NRDC)1.The recent structural changes in the U.S. hog industry such as the increase in large farms and decrease in small farms are believed to be a result of regulations on pollution from hog production.
The objective of the first chapter is to examine the Federal and State-level environmental regulations imposed on U.S. hog production in the year 2003. Based on the number of regulations passed by the Federal government and states, the 2003
regulatory index is constructed. A summary of the Federal regulations demonstrates that these regulations are a minimum requirement for states since states may have passed more regulations than the federal government standards since 2003.
1
In this chapter, we examine state-level regulations for the top 10 hog producing states. These states account for about 86% of U.S. hog production. A close examination of the regulations provides evidence that regulation stringency varies across states. On analyzing the changes in state-level regulation stringency for the years 1994, 1998, 2000 and 2003, there is evidence that states that had more stringent regulations in one year changed their regulation policies the least and that states that had the least stringent regulations changed their regulation policies the most. State-level environmental regulation for the years 1994, 1998, 2000, and the current regulation shows that environmental stringency continued to increase over the years.
1.2. Environmental Regulations on Hog Farms in the U.S.: A Summary of Federal Regulations.
Agricultural pollution from animal feeding operations (AFOs) is a major environmental concern in the high hog production regions of the United States. According to
Environmental Protection Agency (EPA), an AFO under the federal law is defined as an animal feeding operation that confines and feeds animals for a total of forty-five days or more during any twelve-month period and such an operation must be preventing
vegetative forage growth from surviving the normal growing season over a portion of the confined area. Regulations on hog farms in the U.S. have taken several forms. These regulations have to do with: waste management; construction and operation of hog facilities; location of hog farms in relation to rivers, schools, family housing among others; mandatory record keeping; official inspections before and after facility operation; and field application of manure. Metcalfe (2000) groups the waste management
regulations into three main groups: regulations controlling the construction of the facility and waste management system; regulation imposing administrative and managerial
restrictions; and regulations controlling the location and method of field application. It is important to note that the foregoing regulations vary state by state.
Most of the environmental regulations on AFOs are related to water pollution and are passed through the Clean Water Act (CWA). The basis of the CWA was enacted in 1948, and was called the Federal Water Pollution Control Act. The Federal Water Pollution Control Act became to be known as the CWA after it went through reorganization and expansion in 1972. The 1972 amendments to the Federal Water Pollution Control Act gave birth to the National Pollutant Discharge Elimination System (NPDES) permit program. The NDPES federal regulation has become the blue print of the state regulations today. The U.S. EPA coordinates with states, the regulated
community and the public in developing and implementing the NPDES permit program based on the statutory requirements contained in the CWA and the regulatory
requirements contained in the NPDES regulations. The EPA acts as the overseer of the NPDES permit programs as it often requires changes over time. The NPDES regulates the discharge of manure or processed water into rivers and other water sources. Anyone who wants to discharge pollutants must first obtain an NPDES permit, failure of which renders any discharge illegal.
The CWA provides the statutory basis for the NPDES permit program and the basic structure for regulating the discharge of pollutants from point sources to waters of the United States. Potential pollutants which are part of the regulations include manure, litter, process wastewater2 and overflows3. The 1972 CWA was mainly concerned about
2
Process wastewater means spillage or overflow from AFO facilities such as watering systems, flushing pens, manure pits, washing of animals among others.
3
Overflow is the discharge of manure or process wastewater due to the inability of a storage structure to contain the material, see Centner (2006).
surface water protection. The Effluent Limitations Guidelines (ELG) and the New Source Performance Standards (NSPS) which were adopted in 1974 and 1976 respectively, constituted a two step process designed to achieve water surface protection objectives set in 1972.
The ELG dealt with design and operating criteria through industry specific water quality protection rules. The 1972 CWA gives the EPA authority to set effluent limits on an industry-wide (technology-based) basis and on a water-quality basis that ensure protection of the receiving water. The NSPS focused on coming up with definitions for AFOs which constitute a point source. Such AFOs are known today as concentrated animal feeding operations (CAFOs). AFOs classified as CAFOs are regarded as point sources while other AFOs are not regulated under the Act’s permitting system.
The EPA uses the three tier system to categorize CAFOs. Under this system hog CAFOs are defined as large, medium or small based on the number of animal units in the operation. The NPDES permit requirements for CAFOs are tailored for all confined animals and manure, litter and process wastewater generated by animals or the production of the animals. The EPA distinguishes between production areas and application areas. Production areas for CAFOs are defined by the federal regulations to include animal confinement areas, manure storage areas, raw material storage areas and wastewater containment areas.
In the late 1990s the EPA through a court order agreed to make revisions to the 1972 CWA rules. New rules defining environmental regulations for CAFOs were released in December 2002. The new rules are referred to as the 2003 CWA Revisions and they took effect between July, 2007 and February, 2009, becoming the first major
revision of the 1972 CWA. Under the new rules, large hog producers are required to obtain a permit whether or not they have had any discharges in the past. The production area requirements for CAFOs under federal regulations apply to large hog CAFOs that have operations with 2500 hogs or more weighing 55 pounds or more, and 10, 000 hogs or more each weighing less than 55 pounds. In addition there must be no discharge of manure, litter or process wastewater from the production area unless certain conditions are met. If the discharge was caused by rainfall or if the CAFO complies with the
inspection, monitoring, record-keeping, and mortality disposal and other provisions, such a discharge will be exempted from the federal regulation. In addition if the production area is designed, operated, and maintained to contain all of the manure, litter, and process waste water, including storm water plus run off from the 25-year, 24 hour rainfall event or a 100 year, 24 hour storm in an operation constructed after April 14, 2003, the discharge will be exempted under the federal regulations.
Under the 2003 CWA revisions, new storage structures must be designed and maintained to contain the run-off from a 100 year, 24 hour storm event which is more stringent than the 1972 CWA requirement. The CAFO regulations require an NPDES permit for any discharge of waste on lands under the control of a CAFO. Requirements under land application areas include; manure management plans, land application setbacks and buffer requirements, transfer of manure or wastewater off a farm, and maintenance of records for land application. Under the 2003 regulations, AFOs are required to develop and implement a Nutrient Management Plan (NMP) which must at a minimum include Best Management Practices (BMP). A NMP analyzes manure annually for nitrogen and phosphorous content. In addition, land application areas are also required
to be analyzed every five years for phosphorus content, to check for excess nutrient build-up in relation to what crops can utilize. BMPs are measures that have been found to be the most effective, practical means of preventing or reducing pollution from nonpoint sources, (Copeland, 2008). BMPs include observing setbacks from streams, vegetated buffers, determination of application rates to reduce the transport of nitrogen and phosphorus to streams and rivers, daily and weekly inspections, maintenance of depth markers in lagoons and on-site record keeping.
Large CAFOs are required to implement land application setbacks4 and buffers or alternative conservation practices on lands in which they apply manure. The federal regulations prohibit large CAFOs from applying manure, litter or process water closer than 100 feet to any down gradient surface waters, sinkholes, agricultural wellheads and open tile intake structures (Henry, 2003). Alternatively, instead of the 100 foot setback, CAFO owners may use a 35 foot wide vegetative buffer5 where applications of manure, litter, or process wastewater are not allowed. For each land application site, information about setbacks and buffers must be included in the NMP and may be required in the permit application.
As of December 2006, the EPA requires that the following minimum records must be maintained:
i. Results from manure, litter, and process water and soil sampling.
4
Setback: a specified distance from surface waters or potential conduits to surface waters where manure, litter, and process wastewater many not be land applied.
5
The EPA defines a vegetative buffer as a narrow, permanent strip of dense perennial vegetation
established parallel to the contours of and perpendicular to the dominant slope of the field for the purposes of slowing water runoff, enhancing water infiltration, and minimizing the risk of any potential nutrients or pollutants from leaving the field and reaching surface waters.
ii. Test methods used to sample and analyze soil and manure, litter, or process wastewater.
iii. Dates manure, litter or process wastewater is applied to each field.
iv. Weather conditions at the time of application and 24 hours before and after the time of application.
v. Explanation of the basis for determining manure application rates.
vi. Calculations showing the total nitrogen and phosphorus to be applied to each field, including sources other than manure, litter, or process water.
vii. Total amount of nitrogen and phosphorus actually applied to each field, including documentation of calculations for the total amount applied.
viii. Methods used to apply the manure, litter, or process water. ix. Dates of manure application equipment inspection.
x. Expected crop yields.
States were required to implement the 2003 rules by February 2005. However the 2003 rules were challenged in court and this delayed their implementation nationwide. While some states implemented the 2003 revisions sooner, they were not required to adopt them before February 2009. The 2003 CAFO rule was challenged by organizations from environmental and farm groups in Waterkeeper Alliance,Inc vs Environmental Protection Agency for containing provisions that were objectionable to environmental and farm groups. The objections were centered on: deficiencies in the NPDES permits; the absence of a review of permits by the permitting authority; and lack of public participation6.
6
Details on the proceedings of the challenge are documented in “Clarifying NPDES Requirements for Concentrated Animal Feeding Operations” by Centner (2006).
The Waterkeeper Alliance Inc challenged the NPDES permit system for incorporating qualitative measures such as BMPs which are non numerical. Instead the Waterkeeper Alliance Inc argued that NPDES permits should also require NMPs in the permit applications. The new 2003 rule did not require permitting authorities to review NMPs and meant that NMPs that do not meet the statutory effluent limitations and standards could be easily overlooked. The Waterkeeper Alliance Inc argued that the failure for the new 2003 rule to make NMPs available to the public meant that the applicable effluent limitations were not known by the public making it tough for them to make judgments on whether they are deviating from a plan’s requirement. The EPA, following the Second Circuit Court decision of 2005 in Waterkeeper Alliance,Inc vs Environmental Protection Agency, is required to update the 2003 CAFO rule to reflect the changes suggested by the court7. The revised 2003 rules were implemented starting from July 31, 2007 to February 27, 20098.
The following section provides a summary of state specific environmental regulations on hog farms and how they compare to the federal level regulations summarized in Section 1.2. A detailed description of state-specific regulations is provided in Appendix A. 1.3. Environmental Stringency Construction: State-level Regulations versus Federal-level Regulations
The summaries of Federal-level and state-level environmental regulations provided in Section 1.2 and Appendix A allow us to construct the current general environmental stringency index. The last environmental stringency index on AFOs was constructed through 2000 regulations by Herath, Weersink, and Carpentier (2005b). In addition we
7
For further details on Waterkeeper Alliance,Inc vs Environmental Protection Agency see “EPA’s Summary of the Second Circuit’s Decision in the CAFO Litigation.”
8
For more details regarding the postponement in the implementation of the 2003 rules see EPA Concentrated Animal feeding Operations Final Rulemaking: Date Extension, 2007.
construct a setback environmental stringency on AFOs. A detailed state by state documentation of state level environmental regulations is provided in the previous section.
The variation of state-level environmental regulation stringency on HFOs stems from the legislation imposed at the state-level, since some states choose to place more stringent restrictions on HFOs than others. Several regulations are required of all operations by the federal government (FED): waste management plans (WMPs),
mandatory record keeping (MRK), odor abatement plans (OAPs), handling of dead swine (HDS), reports on waste spillage (RWS), nutrient management plans (NMPs),
manure(dry and liquid) application setbacks (MAPs), cost share programs (CSPs) and AFO location setbacks (ALSB). In addition, all of the top 10 states enforce: facility design approval (FDA); and construction and operation permits (COPs).
However, variation in regulation exists within these ten states. For example, the states of NC, MN, NE, and KS have zoning requirements, while only MN and IL regulate hydrogen sulfide (HSR). Table 1 compares the stringency of regulations of HFOs at the state-level. A ‘0’ indicates that the type of regulation is not used at the state level; a ‘1’ indicates that the type of regulation is enforced at the state-level; and a ‘2’ indicates that the regulation is more stringent at the state level than the associated federal standard.
Table 1: 2003-2009 State and Federal Regulations on HFOs
Source: State websites, 2=extensive regulation enforced, 1=regulation is enforced, 0=regulation is not enforced
The listing of environmental regulations in Table 1 allows for state-level regulatory stringency comparisons and ranking according to regulation stringency. To create a stringency index, we sum the number of regulations imposed in the state and by the Federal government (Metcalfe, 2000). From a comparison based on the number of regulations imposed, the states of NC and IL have the most stringent legislation, while the states of IA, MN, IN, OK, and KS have the second highest stringency index value. The states of NE and MO rank third and OH are the lowest on the stringency ladder among the top 10 hog producing states. The FED has the weakest regulations as
compared to the top hog producing states. Evident from the regulations above (Table 1), individual states have tighter environmental regulations than the FED.
S ta te W M P F D A C O P s M R K O A P s Z o n in g H D S H S R R W S N M P s C S P A L S B M A S T o ta l IA 1 1 1 1 1 0 1 0 1 1 1 2 2 13 NC 1 1 1 1 1 1 1 0 1 1 1 2 1 14 MN 1 1 1 1 1 1 1 1 1 1 1 1 1 13 IL 1 1 1 1 1 0 1 1 1 1 1 2 2 14 NE 1 1 1 1 1 1 1 0 1 1 1 1 1 12 IN 1 1 1 1 1 0 1 0 1 1 1 1 2 13 MO 1 1 1 1 1 0 1 0 1 1 1 2 1 12 OK 1 1 1 1 1 0 1 0 1 1 1 2 2 13 OH 1 1 1 1 1 0 1 0 1 1 1 1 1 12 KS 1 1 1 1 1 1 1 0 1 1 1 2 1 13 FED 1 0 0 1 1 0 1 0 1 1 1 1 1 9
Table 2 shows the variation of setback requirements across states and how these compare to the federal setback requirements. Setback requirements are divided into AFO location setbacks (LS), dry manure surface application setbacks (DMS), liquid manure surface application setbacks (LSMS) and liquid manure direct injection setbacks (LIMS). The federal government requires 1000 feet on LS’s. The states of MN, NE, IN, and OH enforce the federal location setbacks. The location setback requirements for the
remaining states are 1875 feet, 2500 feet, 3000 feet, 4000 feet, 1mile, and 3 miles for the states of IA, NC, MO, IL, KS ,and OK, respectively.
Table 2: 2003-2009 State and Federal setback requirements for HFOs
S ta te L S D M S L S M S L IM S IA 1875 800 800 800 NC 2500 300 300 300 MN 1000 300 300 300
IL 1mile 300 1 mile 1mile
NE 1000 300 300 300 IN 1000 500 500 500 MO 3000 300 300 300 OK 3miles 300 300 300 OH 1000 300 300 300 KS 4000 300 300 300 FED 1000 300 300 300
Source: State websites. The rest of the values except those denoted as miles are measured in feet
The federal government does not distinguish between, dry and liquid manure, and surface and direct injection manure application, on its setback requirements. The federal setback requirement for any type of manure application is 300 feet. At the state-level,
only the state of IL distinguishes between dry manure setbacks, and liquid manure setbacks. None of the remaining nine states of the ten states considered here distinguish between the surface application and direct injection of liquid manure setbacks. The states of IN, IA and IL enforce manure application setbacks that are more stringent to the 300 feet requirement.
1.4. State-level Environmental Regulations 1994, 1998, 2000 and 2003
The environmental regulation stringency indices for the years 1994, 1998, 2000, and 2003 environmental regulations are provided in Table 3.
Table 3: 1994, 1998, 2000 and 2003 State-level Environmental Legislation
State 1994 1998 2000 2003 IL 2 8 9 14 IN 4 6 6 13 IA 4 9 10 13 KS 4 9 9 13 MN 8 9 9 13 MO 6 7 8 12 NE 3 7 9 12 NC 1 8 9 14 OH 5 7 9 12 OK 4 6 9 13
Source: Metcalfe (2000), Herath, Weersink, and Carpentier (2005b) and author’s estimates
The 1994 and 1998 regulation stringency indices were constructed by Metcalfe (2000). Herath, Weersink, and Carpentier (2005b) constructed the 2000 environmental
regulations. The 2000 regulations in Table 3 are a modified version of the regulations reported in Herath, Weersink, and Carpentier (2005b).
We modified their regulation stringency index to match the methodology used by Metcalfe (2000) so that we can compare the regulations in 1994, 1998, 2000, and 2003. To update the 2000 index constructed by Herath, Weersink, and Carpentier (2005b), we
tracked the changes in individual regulations between 1998 and 2000 as reported in Metcalfe (2000) and Herath, Weersink, and Carpentier (2005b), respectively. Comparing the two indices, we determined if a state adopted a new regulation after 1998. If a new regulation was added as reflected in 2000, we added the regulation to the 1998 index to construct the 2000 index. In this study we construct the 2003 regulations following Metcalfe (2000). The 2003 regulations differ from their 1994, 1998, and 2000 counterparts in that they incorporate the 2003 revisions to the Clean Water Act
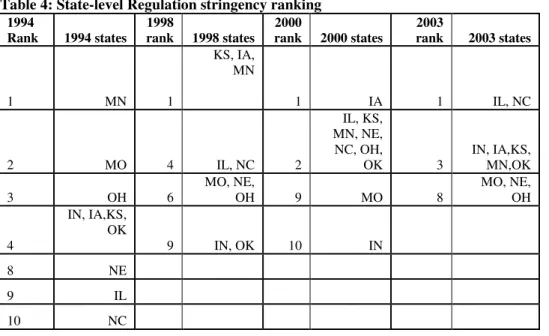
regulations governing animal feeding operations which most states adopted as soon as they were announced. The rankings of states according to regulatory stringency for the years 1994, 1998, 2000 and 2003 are provided in Table 4.
Table 4: State-level Regulation stringency ranking
1994 Rank 1994 states 1998 rank 1998 states 2000 rank 2000 states 2003 rank 2003 states 1 MN 1 KS, IA, MN 1 IA 1 IL, NC 2 MO 4 IL, NC 2 IL, KS, MN, NE, NC, OH, OK 3 IN, IA,KS, MN,OK 3 OH 6 MO, NE, OH 9 MO 8 MO, NE, OH 4 IN, IA,KS, OK 9 IN, OK 10 IN 8 NE 9 IL 10 NC
1.5. Summary and Conclusions.
Examination of the regulation stringency indices for the years 1994, 1998, 2000 and 2003 demonstrates that state-level regulation stringency increased over the years. State-level regulations on hog production have become more stringent since 1994. Between the years
1994 and 1998 the greatest increase in the number of regulations was in the states of Illinois, Iowa, Kansas, and North Carolina. The states of Indiana, Minnesota, Missouri, Ohio, and Oklahoma changed their regulations the least (Metcalfe, 2000). Minnesota and Missouri were the most stringent states in 1994 but did not implement many new polices between 1994 and 1998, and became less stringent than states like Iowa, and Kansas.
Between the years 1998 and 2000, increases in the number of regulations were greatest in Oklahoma, Nebraska and Ohio. The states of Ohio and Oklahoma were among the states that changed their regulations the least between 1994 and 1998. The states of Indiana, Kansas, and Minnesota did not change their regulations between 1998 and 2000. A close examination of regulations imposed between 2000 and 2003, shows that increases in the number of regulations were the greatest in Illinois, Indiana, and North Carolina. The states that changed their regulation policies the least between 2000 and 2003 were Iowa, Nebraska and Ohio.
The states of Illinois and North Carolina which had the least stringent regulations in the year 1994, ranked second in the years 1998 and 2000 and first in the year 2003 among the top 10 hog producing states. The state with the most stringent regulations in 1994,
Minnesota, ranked second for the years 2000 and 2003. The state of Missouri which was ranked second in 1994 currently has the least stringent regulations along with the states of Nebraska and Ohio.
Chapter 2: Environmental Regulation and the Structure of U.S. Hog
Farms
2.1: Introduction
Over the past two decades, the U.S. hog industry has been the subject of significant changes in operation size, organizational structure, and technological base. Associated with the structural changes in the industry is the rapid increase in the level of
environmental regulations by the Federal government and individual states. The
regulations are believed to have contributed to the changing landscape of hog production by speeding up the exit of small hog farms.
Prompting the regulations is the environmental damage associated with hog production. Hog production causes water pollution and deterioration of soil quality by contaminating water and soil with nutrients such as nitrogen and phosphate. These nutrients are bad for the soil when applied in excessive amounts or when manure leaks from waste storage lagoons. Excess nitrogen and phosphate have also been blamed for causing stunted growth in plants as well as causing accelerated eutrophication9 of water systems (Ni et al. 2002). Hog production also affects air quality through odor, which occurs from the hydrogen sulfite originating from anaerobic fermentation of manure. High concentrations of hydrogen sulfite are toxic to human and animal life as they can cause dizziness, irritation of the respiratory tract, nausea, and headaches, (Ni et al., 2002; Sneeringer, 2010). Recently, an increase in livestock production has been found to be associated with an increase in infant mortality (Sneeringer, 2009). In a moist atmosphere
9
Eutrophication is a process whereby water bodies receive excess nutrients (nitrogen and phosphates) that stimulate excessive plant growth (e.g. algae). This enhanced plant growth reduces dissolved oxygen in the water when dead plant material decomposes and can cause other organisms to die.
hydrogen sulfite can turn into sulfuric acid which can be detrimental to concrete and metal (Ayoub et al. 2004).
To address the environmental damage, the federal government requires states with animal feeding operations (AFOs) to enforce environmental regulations such as waste management plans (WMPs), mandatory record keeping (MRK), odor abatement plans (OAPs), handling of dead swine (HDS), reports on waste spillage (RWS), nutrient management plans (NMPs), manure (dry and liquid) application setbacks (MAPs), cost share programs (CSPs) and AFO location setbacks (ALSB). Federal involvement in environmental regulations on AFOs began with the inception of the Clean Water Act of 1972.
While federal regulations must be met nationwide, many states, facing pressure from environmental groups, have adopted more stringent regulations than the federal standards. In addition to regulations required by the federal government, some states require facility design approval (FDA); construction and operation permits (COPs); zoning requirements; and hydrogen sulfide regulations. Regulations on hog production vary from state to state mainly due to three reasons. First, the design of Federal water policy laws gives states sufficient authority and flexibility to design and implement their own environmental laws. States have the option to provide funding for voluntary programs to address the environmental needs of local areas. Second, the characteristics of the nonpoint-source pollution vary by state. States may use different judgments because linking observations of particular management practices associated with confined hog feeding operations to changes in water quality is problematic. Third, the characteristics of the states that have to deal with the pollution vary. Differences within states in farming
practices, land forms, climate and hydrologic characteristics may require different environmental laws (Sullivan, Vasavada and Smith 2000).10
How such regulations affect AFOs prompted several economists and
environmentalists to examine: (1) how the increase in environmental stringency affected U.S. hog production; and (2) the determinants of exit behavior of U.S hog farms. Hog production has consistently been found to be negatively affected by environmental regulation (Metcalfe 2001; Roe, Irwin and Sharp 2002; and Herath, Weersink, and Carpentier 2005b). Metcalfe (2001) also found that environmental stringency only affected small HFOs (SHFO) and had no effect on large HFOs (LHFO). In a study addressing the determinants of exit behavior of small hog farms and whether large farms are displacing small farms in the U.S hog industry Kuo (2005) finds that technological improvement, unemployment rate, and hog price affect the exit behavior of small hog farms. The study also finds that state-level policies such as environmental regulation and incumbent large hog farms have no effect on the exit of small hog farms.
As important as the foregoing studies are in providing insights on the economic impact of environmental regulations on the structure of the industry, none offered an economic framework that links the empirical findings to an explicit theory of long-run industry equilibrium and environmental regulations. Our aim in this article is to develop such a framework.
Specifically, we develop an empirically implementable theoretical model which allows us to investigate the long-run effects of environmental regulations on the U.S. hog
10
A table showing the variation of environmental regulation stringency among the top ten hog producing states and the federal government is provided in appendix A.
industry. Issues such as whether regulation favors small or large firms, increases the average firm-size, and reduces the number of firms are examined. In addition, we examine whether incumbent large farms crowd out small firms. All these issues have implications for the long-run equilibrium of the industry via entry and exit.
There are several reasons why environmental regulations may not be size-neutral. One reason is that regulation compliance may impact entry and exit conditions through raising the sunk costs associated with entry, generating cost differentials between entrants and incumbents, or slowing down the process of entry and exit (Heyes 2009). Heyes (2009) summarized the literature on the effect of regulation on competition. Studies in other industries have shown that regulation compliance is associated with changes in the scale of production and increase in average firm size (Pittman 1981; Pashigian 1984; Kohn 1988), and reduction in the number of establishments (Pashigian 1984).
Another reason is potential compliance asymmetries, i.e., differences in
compliance costs per unit of output between small and large firms. Such asymmetries are possible when regulations are equally applied and enforced across small and large firms (Pashigan 1984; Bartel and Thomas 1987). Previous studies examining this question have found mixed results. In some studies, environmental regulations have been found to favor large incumbent firms at the expense of small firms (Pitman 1981; Pashigian, 1984; Bartel and Thomas 1987; Kohn 1988; Heyes 2009). Empirical findings from other studies (Ringleb and Wiggins 1990; Becker and Henderson 1997) did not support the conclusion that environmental regulations favors large firms at the expense of small firms. Ringleb and Wiggins (1990) positedthat larger firms in hazardous industries might attempt to shield assets to protect themselves from liabilities associated with
environmental regulations. Their findings on small firm entry from 1967-1980 suggest that an increase in the number of small corporations in hazardous sectors was a result of such divesture.
Enforcement asymmetries which result when regulations are not equally enforced on small versus large firms are also important (Pashigan 1984). As with compliance asymmetries, enforcement assymmetries favor large versus small firms. Regulation has also been found to discourage the formation of small firms (Dean, Brown, and Stango 2000).
Results of our study suggest that:
1. Increased state-level regulation stringency significantly lowers the output of SHFOs.
2. Increased state-level regulation stringency significantly lowers the output of LHFOs.
3. Increased state-level regulation stringency significantly lowers the number of SHFOs.
4. SHFO output rises significantly in states that have a greater number of LHFOs. 5. LHFO output rises significantly in states that have a greater number of LHFOs. 6. The number of SHFOs significantly increases in states that have a greater
numbers of LHFOs.
7. Regulation increases the average SHFO size. 8. Regulation decreases the average LHFO size.
Results on the impact of regulation on the output of SHFOs conform to earlier findings in the hog industry (Metcalfe, 2001), and other industries (Pitman, 1981;
Pashigian, 1984; Bartel and Thomas, 1987; Kohn, 1988). The result that regulation has a negative impact on the number of SHFOs is consistent with the findings by earlier studies in other industries (Pitman, 1981; Pashigian, 1984; Bartel and Thomas, 1987; Kohn, 1988). Recall that results by Ringleb and Wiggins (1990) and Becker and Henderson (1997) do not support our findings pertaining to SHFOs. The negative effect on the output of large operations is likely due to divesture and supports the findings by Ringleb and Wiggins (1990). Our results provide evidence against any crowding-out effect, where incumbent LHFOs force SHFOs out of the U.S. hog industry. The result that regulation increases the average size of small farms is consistent with findings by Pittman (1981), Pashigian (1984) and Kohn (1988). The finding that regulation decreases the average size of large farms is consistent with Ringleb and Wiggins (1990). In a nutshell our results suggest that regulation compliance cost has led to the exit of small hog farms which helps explain the changing structure of the U.S. hog industry.
The rest of the study will be organized as follows, Section 2.2 provides the background of the U.S. hog industry, Section 2.3 provides a review of relevant past literature, Section 2.4 provides the theoretical model and conclusions based on the
theoretical model, Section 2.5 provides the empirical model and analysis, and Section 2.6 provides the summary and conclusions.
2.2. Background of the U.S Hog Industry
According to the MINDBRANCH website, the U.S. hog and pork industry comprises establishments primarily engaged in raising hogs and pigs. The industry is made up of establishments engaged in farming activities such as breeding, farrowing, and the raising of weanling pigs, feeder pigs, or market size hogs. The hog and pig industry ends at the
point when the livestock is sold or transferred off the farm. It is important to note that the production and packaging of processed meats is not part of this industry. How do pigs and hogs differ? The name pig embraces hogs, the only difference being that a hog is a domesticated pig that weighs more than 120 pounds. Hogs and pigs have cloven hooves, short legs and a snout used for digging. From now on, we will refer to the hog and pig industry as the hog industry. The U.S. hog industry consisted of about 3 million farms during the 1950s. According to a USDA report by Key and McBride(2007), the number of hog farms fell by more than 70% between 1992 and 2004 from over 240, 000 to about 70, 000. Figure 1 shows these dynamics.
Figure 1: Number of U.S Hog operations and Hog inventory
Figure 1 above shows that hog inventory remained stable despite the drastic reduction in the number of hog farms. It is important to note that while the number of hog farms
experienced a huge decline between 1992 and 2004, the overall number of farms in the U.S remained stable during the same period (Key and McBride, 2007). In other words, the general farm numbers encompassing all the different farm practices in the U.S remained fairly unchanged over the years. In 2007 the U.S. hog and pig farming industry comprised of about 65,000 farms with combined annual revenue of $14 billion. This represents a reduction of about 5000 farms between 2004 and 2007. This is, however, a huge drop when compared to about 3 million operations in this industry during the 1950s. The top 10 hog producing states in 2004 are documented in Table 5 below.
Table 5: 2004 top 10 Hog producing states
Rank State Value ($1,000) % of Total U.S. 1. Iowa 3,801,018 26.49% 2. North Carolina 2,078,800 14.49% 3. Minnesota 1,724,512 12.02% 4. Illinois 1,027,628 7.16% 5. Nebraska 761,953 5.31% 6. Indiana 738,470 5.15% 7. Missouri 623,260 4.34% 8. Oklahoma 615,411 4.29% 9. Ohio 402,719 2.81% 10. Kansas 379,048 2.64% Source: http://www.cattlenetwork.com
Table 5 above shows the top 10 hog producing states in the U.S. in the year 2004. The ranking above is based on the value of the production. It is interesting though to note that the states in the 2004 ranking are exactly the same states in the 2007 ranking as shown in Table 6. However some states swapped positions between 2004 and 2007 such as Nebraska, Indiana, Ohio and Kansas. In 2004 the top three hog producing states, Iowa, North Carolina and Minnesota accounted for about 53% of the total value of hog
producing states accounted for about 55% of the U.S. total hog inventories in 2007. Table 6 below summarizes the U.S. hog industry based on the top 10 producing states,
inventories and their percentage contribution to hog industry.
Table 6: 2007 top 10 hog producing states
Rank State Total state inventory % of Total U.S.
1 Iowa 18,700,000 28.37% 2 North Carolina 10,000,000 15.17% 3 Minnesota 7,300,000 11.08% 4 Illinois 4,300,000 6.52% 5 Indiana 3,500,000 5.31% 6 Nebraska 3,200,000 4.86% 7 Missouri 3,050,000 4.63% 8 Oklahoma 2,330,000 3.54% 9 Kansas 1,860,000 2.82% 10 Ohio 1,830,000 2.78% Source: http://www.cattlenetwork.com
The changes in the number of operations from 3 million in the 1950s to about 65000 operations in 2007 may reflect a lot of structural changes in this industry over the years. The changes in animal production saw an expansion in concentrated animal feeding operations (CAFOs), a rise in the issues associated with large numbers of animals in confined areas, Centner (2006). The changing structure of the U.S. hog production industry towards more concentrated large hog farms has created concerns over the danger such big animal feeding operations (AFOs) are likely to pose to the waters of the country. The issues associated with large confined animal feeding operations include; water contamination, air pollution, health effects, concern about antibiotics, animal welfare and loss of resources.11 The foregoing concerns are related to the production of animals and could be solved if environmentally friendly production and management practices are
11
voluntarily exercised by the owners of the operations. However, Centner (2006), noted that this measure has failed to achieve the desired water quality and this has led to the need for governmental regulatory controls in order to address pollutant problems. 2.3: Literature Review
This section will review the relevant literature to the current study. 2.3.1. Relevant literature on regulation and market structure
Pittman (1981) in a study based on a study of 30 integrated paper mills in Wisconsin and Michigan concluded that abatement requirements increase the minimum efficient size of plants which in turn increase the barriers to entry.
Kartz and Rosen (1983) analyzed the effects of taxation as a cost shifter using the conjectural variations model of oligopoly. The study demonstrates the way in which the incidence of a tax depends upon the pattern of firm interaction. The authors found an interesting result that a shift in the cost function (increase in cost) can lead to higher profits. They conclude that the notion that oligopolists act as they were competitive or monopolists is likely to provide misleading results, since it is possible for oligopolists that a tax can lead to higher profits, while this result never arise in competitive or monopolistic markets. Their result supports the heavily criticized econometric result by Krzyzaniak and Musgrave (1963), which concluded that a tax can lead to higher profits under oligopoly.
Pashigan (1984) examined the effects of environmental regulation on changes in the number of plants in pollution-intensive industries and concluded that regulation reduced the number of firms per industry and raised the average plant size. This study also finds that regulation placed a greater burden on small plants than on large plants.
Bartel and Thomas (1987) documented the competitive advantages which arise from the asymmetrical distributions of OSHA and EPA regulatory impact among different types of firms. They concluded that regulation favors large firms over small firms because large firms may acquire a form of relative competitive advantage over small firms. Their study also finds that in some cases comparative advantage obtained from differential regulatory costs outweighed the costs of compliance.
Kohn (1988) examined the impact of pollution abatement costs on market structure based on a general equilibrium model. The study identified two effects which push towards larger firms and higher concentration. Firstly, the input effect which is based on the idea that compliance costs contribute to fixed costs and shift the U-shaped average cost curve to the right. This increases the scale at which average cost is
minimized. Secondly, the output effect which occur when the percentage reduction in emissions due to abatement increases or decreases the level of output of the polluting firm.
Litchenberg, Parker and Zilberman (1988) developed a method for estimating marginal costs of environmental regulations affecting agriculture, in the short-run, when the direct costs of environmental and resource policies vary among regions. Their results indicate that, redistribution of income among producers becomes the dominant effect of pesticide policies when supply elasticities are higher and demand elasticities are lower, with changes in supply elasticity having a greater impact than changes in demand elasticity. Results also show that for crops with significant export markets, foreign consumers may bear much of the cost of restrictive policies in the short run. The authors do infer long run results, that higher production costs will provide an incentive for entry
by foreign producers undermining U.S. competitiveness, without explicitly incorporating them in the analysis
Bartik (1988) examined the effect of state environmental regulations on the location of manufacturing plants. The study separates the effect of state air pollution regulations from that of state water pollution regulations. The author used state spending on water pollution control, state spending on air pollution control, average air and water compliance costs in state, and particulate regulations. Results found no statistically significant effects of environmental regulation on business location.
Bartik (1989) examined how the characteristics of American states affect small business start-ups. Among these characteristics was environmental stringency which was proxied by the number assigned to strictness of state environmental regulations, as of 1983, by the Conservation Foundation. Results show that environmental regulations were found to have a positive and significant effect on small businesses starts.
Ringleb and Wiggins (1990) analyzed the application of liability to large-scale, long- term hazards. They arguedthat larger firms in hazardous industries might attempt to shield assets to protect themselves from liabilities associated with environmental regulations. They also hypothesized that incumbents would divest themselves of hazardous activities. Their results on small firm entry from 1967-1980 suggest that an increase in the number of small corporations in hazardous sectors was a result of such divesture.
Shy (1995) defines market structure as a description of the firm’s behavior in a given industry or market. Four notable items defining a firm’s behavior are said to include: (1) the actions available to each firm such as price setting, quantity setting, and
setting production capacity; (2) the number of firms in the industry and whether free entry and exit is possible or not; (3) firms’ expectations about the actions available to competing firms, and the response of the firms in the industry to each firm’s action; and (4) firms’ expectation about the number of firms and potential entry.
Sunding (1996) developed a method of measuring the marginal welfare cost of environmental regulations affecting agriculture. The author extends the work by Litchenberg, Parker and Zilberman(1988) by explicitly considering temporal as well as spatial diversity when measuring marginal welfare costs of nonuniform environmental regulations (i.e. pesticide application reduction requirement) affecting agriculture. The work facilitates the design of season and region specific environmental regulations. The ability of the method developed by the author can be used to measure the marginal costs of regulating agricultural production at a disaggregated level and can thus be paired with earth science data to gain a better picture of marginal costs and benefits of localized environmental regulation.
Hamilton and Sunding (1997) examined the effect of changing supply on the market structure of the downstream food processing sector allowing for cost differences and endogenous downstream entry and exit. The main results indicate that increasing concentration in the food processing sector leads to a decrease in market power and when there is an outward shift in the farm supply curve, concentration can only increase when there is a decrease in market power.
Becker and Henderson (1997) examined the unintended effects of air quality regulation on decisions of major polluters, using plant data for the years 1963 to 1992. They found an increase in the number of small firms in the four high polluting industries
they examined which included industrial organic chemicals, plastic products, metal containers and wood furniture.
Dean, Brown, and Stango (2000) estimated the effects of environmental regulations on the formation of small manufacturing establishments across 170
manufacturing industries for the years 1967 to 1980. Their results suggested that greater environmental regulations intensity is associated with fewer small business formations. Results also found that regulation had no effect on the formation of large establishments. They concluded that environmental regulations put small entrants at a unit cost
disadvantage.
Lahiri and Ono (2007) analyzed the effects of an increase in emission tax on a symmetric oligopoly. Their study allows for firms to reduce emissions using abatement technologies. Their results suggested that aggregate output decreases with an increase in emission tax while the emissions tax has an ambiguous effect on output per firm. Output per firm was found to increase (decrease) provided the inverse demand function is concave (convex).
Heyes (2009) surveyed theoretical and empirical research on the effects of regulation on the vigor of competition in product markets. The study concludes that environmental regulations can advantage large firms over small firms, discourage entry directly, provide instruments with which incumbents can discourage entry strategically, and provide the basis of predatory behavior by incumbents.
Millimet, Roy and Sengupta (2009) surveyed the literature on the economic effects of environmental regulation on several aspects of market structure including entry, exit, and size distribution of firms and market concentration. They found that existing
literature focuses on the private costs of environmental regulation incurred by firms and the benefits of environmental quality enjoyed by society, and missing in the literature is the potential for firms to benefit from environmental regulation through an increase in product demand by “green” consumers.
2.3.2. Environmental regulations and stringency literature in the hog industry. Hubbell and Welsh (1998) investigated geographic concentration in the hog industry, using a measure based on Theil’s entropy index for the top 20 hog producing states for the period 1974-1996. Results showed that hog production is becoming more
geographically concentrated at the national level and within states. The study also found that changes in the hog industry have led to a non-uniform interregional distribution of hogs.
Fleming, Babcock, and Wang (1998) investigated the cost of delivering manure nutrients from Iowa swine production for two forms of manure storage (anaerobic lagoon and slurry basin), two target nutrients (nitrogen and phosphate), two crop rotations and two levels of field incorporation (tillage of manure into soil). The study addressed three major questions concerning swine manure management: (1) Should manure nutrients be conserved and applied to crops? (2) What is the impact of a policy requiring all manure applications to be incorporated? (3) What is the impact of a policy requiring manure applications to be based on phosphate? The results of the study suggest that (1) manure nutrient returns are maximized where high nutrient using crops are grown close to a medium sized swine facility that uses nutrient conserving methods to store manure (2) incorporating manure increases production returns while improving air quality and (3) basing manure applications on phosphate levels rather than nitrogen increases the value
of manure nutrients as applied nutrients tend to match crop requirements, the profit maximizing number of hogs and profits are greater under a phosphate standard than under a nitrogen standard. While the costs under a phosphate standard are higher, the net value of manure for low hog numbers (a characteristic of Iowa) is enhanced by a
adoption of a phosphate standard.
Fleming (1999) estimated how much larger the setback length for surface application of manure must be relative to the setback length for soil incorporation to encourage incorporation in Kentucky. Results suggested that setback lengths do not encourage odor control through incorporation and that the setback length for surface application has to be substantially longer than that of incorporation.
Sullivan, Vasavada and Smith (2000), identified three possible reasons for the variation in states’ policies regulating nonpoint-source pollution. These include the design of Federal water policy laws, characteristics of the nonpoint-source pollution, and characteristics of the states that have to deal with water quality issues.
Metcalfe (2000) examined the change in state legislation imposed to regulate manure management and to protect water quality between 1994 and 1998. The study also provides a discussion of the state legislation used to regulate animal manure management and how the regulation varies across states. Based on the state to state variation of the regulation, the study constructs a stringency index which is dependent on the number of legislations imposed in each state. Examination of state legislation between the two years showed that the stringency of state manure management regulation significantly
increased between 1994 and 1998. The study noted that a majority of the increases in regulation were imposed in response to the expansion of hog production.
Metcalfe (2001) investigated the influence of water quality regulatory stringency on hog production in the U.S. The author used a profit maximization model for hog production in which the environment was included as an input in the production process. The cost of this environmental input incurred by hog operations through utilization of state water was the main concern of the study. The amount of state spending on water quality12 and a qualitative stringency measure constructed through examination of state manure management regulations imposed on AFOs for the years 1994 and 1998. The following stringency rating, 1(low), 2(average), and 3(high), was used for each state. Results show that there are significant environmental compliance costs for small hog feeding operations. Large operations did not appear to be influenced by the level of state environmental stringency.
Roe, Irwin and Sharpe (2002) addressed the factors behind the reorganization of the hog production in a cross-section of counties for the years 1992 and 1997. They concluded that the presence of other swine has a positive effect on the inventory of hogs in a particular county for the year, 1997, and hog production in one county was
negatively correlated with hog production in a nearby county between 1992 and 1997. Regulation had a negative effect on the location of hog farms.
Centner and Mullen (2002) analyzed enforcement mechanisms and
opportunities for greater enforcement of AFO regulations and found that reductions in pollution could be a result of more effective enforcement of the existing regulations, and not from coming up with more regulations. The author’s recommendation to regulators is to revise existing regulations by moving them toward more meaningful provisions that
12
Spending on water quality is defined as the amount of state monies used for managing water quality programs and for enforcement of water quality regulations.
give greater deference to efficiency criteria and to increase resources into enforcement efforts. The work warns regulators that increasing the number of regulations may serve only to amplify benefits from noncompliance.
Agapoff and Cattaneo (2003) addressed the effectiveness of EQIP in helping farmers meet nitrogen and phosphorous based manure application standards. They found that EQIP helps cover the costs of most of the small farmers and some of the large farmers. The authors found the willingness of crop operators to accept manure on their farms as a nutrient source to be a very important factor affecting the cost of large farms meeting a nutrient standard. The higher the willingness to accept manure (WTAM), the higher the number of large farms that will be able to meet the N-standard without increasing production costs, while the number of EQIP will also drop significantly. A high WTAM was found to have very little effect on small farms and to decrease EQIP funding thus making available funds for other conservation issues and making funds available for a large number of producers.
Herath, Weersink, and Carpentier (2005a) described the patterns of regional and national change in the geographical concentration of hog, dairy, and fed-cattle inventories for 48 states in the United States from 1975 to 2000. The authors examined the association of such patterns with the changes in slaughtering/processing capacity, population density, and stringency in environmental regulations. Entropy measures were used to compare concentration nationally as well as within and across the eight major production regions. Results show evidence of all three sectors becoming more
geographically concentrated within states across the country. Findings also show that hog and dairy inventories increased in nontraditional production regions while fed-cattle
inventories increased only in three major producing states. The northwestern region of the U.S. experienced reduced geographical concentration of livestock production while the western regions experienced both increased livestock production and increased geographical concentration.
Herath, Weersink, and Carpentier (2005b) examined the factors affecting state annual share of national inventory for each of the hog, dairy, and fed-cattle sectors using data from the 48 contiguous states for 1976 to 2000. The study uses a state specific time series measure of stringency. A Gini coefficient ranging from 0 (equal distribution of livestock inventories among the states) to 1 (concentration of livestock inventories in one state) was used to measure the degree of geographical concentration. The Gini coefficient for hogs increased from 0.72 in 1975 to 0.77 in 2000 indicating increasing geographical concentration in this industry. Their findings also indicated that differences in
environmental stringency facing livestock producers had a significant influence on production decisions in the dairy and mainly the hog sector.
Kuo (2005) addressed the determinants of the exit behavior of small hog farms and whether large farms are displacing small farms in the U.S hog industry. The study finds that technological improvement, unemployment rate, and hog price affect the exit behavior of small hog farms. The study also finds that state-level policies such as environmental regulation and incumbent large hog farms have no effect on the exit of small hog farms.
Weersink and Raymond (2006) investigated the regional characteristics where spills occur, whether the spills are generating complaints, the types of citizens who are complaining, and whether environmental policy deters either spills or complaints. Results
indicated that the distance between livestock producers and both environmentally sensitive areas and people serves to reduce conflicts between farmers and the local community. Findings also suggest a positive relationship between spills in a region and the number of complaints with an implication that complaints can be used by regulators as a tool to identify problem areas.
2.3.3. Environmental regulations and stringency literature in other livestock industries.
Huang, Magleby and Christensen (2005) examined the economic impacts of the EPA’s manure application regulations on medium and large dairy farms in the U.S. southwestern region. The authors found that new EPA restrictions on land application of manure by CAFOs could harm the net returns of medium and large dairy farms with lagoon systems in the southwestern region of the country, and that higher net incomes by other types of dairy farms can only be achieved under these restrictions if they are able to reduce feed costs by better utilizing manure and expanding homegrown feed production.
Schuk and Birchall (2001) developed a manure BMP adoption model to examine whether or not state level manure management regulations influence manure BMP
adoption rates among beef CAFOs in South Dakota. The CAFO size was measured by herd size and acreage and regional nutrient demand was measured by regional crop production. The study found relatively small influences of regional crop coverage and state level regulations on the manure handling practices by CAFOs, while herd size is found to play a larger role in promoting the adoption of manure storage BMPs.
Osei and Lakshminarayan (1996), investigated the factors previously thought to affect the location of dairy farms as well as the environmental policy effects on dairy