filters for security selection
by
Johannes Petrus Steyn
December 2012
Thesis presented in fulfilment of the requirements for the degree Master of Commerce at the University of Stellenbosch
Supervisor: Professor JD Krige
Faculty of Economic and Management Sciences
Department of Business Management
DECLARATION
I, the undersigned, hereby declare that the work contained in this thesis is my own original work and that I have not previously in its entirety, or in part, submitted it at any university for a degree.
... ...
Signature Date
Copyright 2012 Stellenbosch University All rights reserved
ABSTRACT
Do firms that have low dependence on physical assets as well as high profitability outperform companies with the opposite characteristics in the market? Despite the lack of empirical research, conventional wisdom would suggest that they should. Conceptually, investors should prefer profitable companies to less profitable companies, and lower capital-intensive to high capital-intensity firms. Using a large sample of global stocks over the period from 1988 to 2010, the effect of using capital intensity and return on capital employed (ROCE) as filters for portfolio inclusion was investigated.
A quantitative research approach was followed in this study. This involved dividing the sample into five subsets, or quintiles, according to the specific metric (for example capital intensity). The total return of an equally weighted portfolio was then measured for each quintile for the subsequent 12 months. The portfolio was rebalanced annually and the subsequent 12-month return recorded. Because enhanced performance on new capital investments may take longer than 12 months to be reflected in share prices, quintile performance was also measured over five-year holding periods.
The empirical findings of this study reveal that there was no discernible pattern of outperformance by low capital-intensive quintiles using annual rebalancing. However, the lowest capital-intensive firms had the highest average returns using five-year holding periods. The highest ROCE firms performed best with annual rebalancing and with five-year holding periods. Combining both capital intensity and ROCE, a portfolio focused on low capital intensity and high profitability produced a compound annual growth rate that is 9.18 percentage points higher than a portfolio focused on the highest capital intensity and the lowest ROCE. Over five-year holding periods there is a distinct outperformance by low capital-intensive firms with high operational profitability.
These results indicate that allocation of investment capital to capital-intensive companies with low operational profitability seems likely to impair long-term returns, and there may be value in a focus on low capital-intensity firms that are able to generate high returns on capital employed.
OPSOMMING
Sal maatskappye met lae afhanklikheid van fisiese bates, asook hoë winsgewendheid, maatskappye met die teenoorgestelde eienskappe uitpresteer in die mark? Ten spyte van ‘n gebrek aan empiriese navorsing, sal konvensionele wysheid voorstel dat dit so moet wees. Beleggers behoort winsgewende maatskappye bo minder winsgewende maatskappye te verkies, en laer kapitaalintensiewe bo hoë kapitaalintensiewe maatskappye. Die gebruik van kapitaalintensiteit en opbrengs op kapitaal aangewend (OOKA) in die beleggingsbesluit word ondersoek deur gebruik te maak van ‘n groot steekproef globale aandele oor die tydperk 1988 tot 2010.
'n Kwantitatiewe navorsingsbenadering was gevolg in die studie. Dit het die verdeling van die steekproef in vyf onderafdelings, of kwintiele, volgens die spesifieke maatstawwe (byvoorbeeld kapitaal-intensiteit) behels. Die totale opbrengs van 'n gelyk-geweegde portefeulje is vervolgens gemeet vir elke kwintiel vir die daaropvolgende 12 maande. Die portefeulje is jaarliks herbalanseer en die daaropvolgende 12 maande se opbrengs is aangeteken. Omdat verbeterde prestasie op nuwe kapitaalbeleggings langer kan neem as 12 maande om in aandeelpryse weerspieël te word, is kwintiel prestasie ook oor vyf jaar hou periodes gemeet.
Die bevindinge van hierdie studie dui daarop dat daar geen beduidende verbetering in prestasie onder laer kapitaalitensiewe kwintiele oor een jaar houperiodes was nie. Die laagste kapitaalintensiewe maatskappye het egter oor ‘n hou periode van vyf jaar die hoogste gemiddelde opbrengs gelewer. Die hoogste OOKA maatskappye het die beste gevaar met jaarlikse herbalansering en met 'n houperiode van vyf jaar. 'n Portefeulje gefokus op lae kapitaalintensiteit en hoë winsgewendheid het 'n saamgestelde jaarlikse groeikoers gelewer wat 9,18 persentasiepunte hoër was as 'n portefeulje gefokus op die hoogste kapitaalintensiteit en die laagste OOKA. Oor houperiodes van vyf jaar was daar duidelike uitprestering deur lae kapitaalintensiewe ondernemings met hoë operasionele winsgewendheid.
Hierdie resultate dui daarop dat die toekenning van beleggingskapitaal aan kapitaalintensiewe maatskappye met lae operasionele winsgewendheid waarskynlik langtermynopbrengste benadeel en dat 'n fokus op lae kapitaalintensiteit maatskappye, wat in staat is om 'n hoë opbrengs op kapitaal te genereer, moontlik meer lonend kan wees.
ACKNOWLEDGEMENTS
I would like to sincerely thank the following persons:Professor JD Krige, my supervisor, for his support and guidance throughout the study. Without his initiative, motivation, insights and patience, this project would not have been possible;
My former colleagues at Investec Asset Management, especially Sam Houlie, Grant Irvine-Smith and Chanel Stuart-Findlay, who made this project possible;
Prof M Kidd at the centre for statistical consultation, for his assistance with the statistical computations;
My loving parents, Gideon and Roelien Steyn, for their encouragement, love and support; Mariken Schenk, for believing in me and encouraging me to see this project through; And our Heavenly Father for granting me the ability to complete this thesis.
TABLE OF CONTENTS
Declaration ... i Abstract ... ii Opsomming ... iii Acknowledgements ... iv Table of contents ... vList of tables ...viii
List of figures ... ix
CHAPTER 1: INTRODUCTION TO THE STUDY ... 1
1.1 OVERVIEW ... 1
1.2 BACKGROUND AND THEORETICAL FRAMEWORK ... 2
1.2.1 Capital intensity ... 4
1.2.2 Return on capital employed (ROCE) ... 7
1.3 PROBLEM STATEMENT ... 8
1.4 OBJECTIVES AND HYPOTHESES ... 9
1.5 METHODOLOGY ... 10 1.5.1 Primary research ... 10 1.5.1.1 Population ... 10 1.5.1.2 Sample ... 11 1.5.1.3 Acquisition of data ... 11 1.5.1.4 Data analysis ... 12 1.5.2 Secondary research ... 13
1.6 ORIENTATION OF THE STUDY ... 13
CHAPTER 2: LITERATURE REVIEW... 15
2.1 INTRODUCTION ... 15
2.2 CAPITAL INTENSITY ... 19
2.2.1 Intangible assets and barriers to entry ... 28
2.3 RETURN ON CAPITAL EMPLOYED ... 31
2.4 QUALITY INVESTING ... 37
CHAPTER 3: METHODOLOGY ... 43
3.1 INTRODUCTION ... 43
3.2 INVESTMENT RESEARCH ... 43
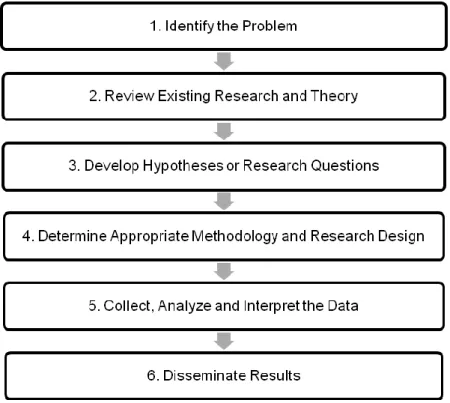
3.3 THE RESEARCH PROCESS ... 44
3.4 HYPOTHESES ... 45
3.5 RESEARCH STRATEGY ... 46
3.5.1 Research approach ... 46
3.5.2 Research design ... 46
3.5.3 Validity of the research design ... 48
3.6 DATA ... 49
3.7 DATA PROCESSING ... 51
3.7.1 Portfolio construction technique ... 51
3.7.1.1 Phase 1: Capital intensity - Part 1 ... 51
3.7.1.2 Phase 1: Capital intensity - Part 2 ... 52
3.7.1.3 Phase 2: ROCE – Part 1 ... 53
3.7.1.4 Phase 2: ROCE – Part 2 ... 53
3.7.1.5 Phase 3: Combining capital intensity and ROCE – Part 1 ... 54
3.7.1.6 Phase 3: Combining capital intensity and ROCE – Part 2 ... 55
3.7.2 Data Analysis ... 55
3.7.2.1 Holding-period rate of return (HPR) ... 56
3.7.2.2 Descriptive statistics ... 56
3.8 FINANCIAL METRICS ... 62
3.8.1 Capital intensity ... 62
3.8.2 Return on capital employed (ROCE) ... 63
3.9 SUMMARY ... 64
CHAPTER 4: RESEARCH RESULTS ... 66
4.1 INTRODUCTION ... 66
4.2 CAPITAL INTENSITY ... 67
4.2.1 Compound annual growth ... 67
4.2.2 Arithmetic average returns ... 69
4.2.3 Student’s t-test ... 71
4.2.4 Skewness and kurtosis ... 74
4.2.5 The Mann-Whitney U test ... 77
4.3 RETURN ON CAPITAL EMPLOYED ... 82
4.3.1 Compound annual growth ... 82
4.3.2 Arithmetic average returns ... 85
4.3.3 Student’s t-test ... 87
4.3.4 Skewness and kurtosis ... 88
4.3.5 The Mann-Whitney U test ... 92
4.3.6 Five-year holding period analysis ... 93
4.4 COMBINING CAPITAL INTENSITY AND ROCE ... 95
4.4.1 Matrix analysis with a focus on Box 1 and Box 25 ... 95
4.4.2 Compound annual growth ... 96
4.4.3 Arithmetic mean returns ... 99
4.4.4 Student’s t-test ... 100
4.4.5 Skewness and kurtosis ... 101
4.4.6 The Mann-Whitney U test ... 105
4.4.7 Five-year holding period analysis ... 106
4.5 SUMMARY ... 108
CHAPTER 5: SUMMARY AND RECOMMENDATIONS ... 109
5.1 INTRODUCTION ... 109
5.2 SUMMARY ... 110
5.3 CONCLUSIONS ... 112
5.3.1 Capital intensity ... 112
5.3.2 Return on capital employed ... 113
5.3.3 Combination of capital intensity and ROCE ... 114
5.3.4 Managerial implications ... 116
5.4 LIMITATIONS AND AREAS FOR FUTURE RESEARCH ... 117
LIST OF TABLES
Table 4.1: The performance of capital-intensity quintiles over the entire sample
period of 22 years (June 1989 - June 2010) ... 67
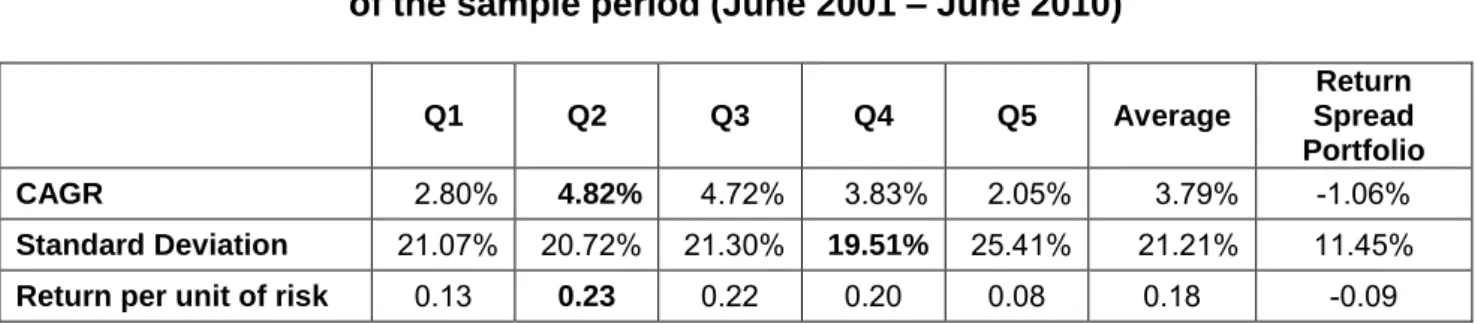
Table 4.2: The performance of capital-intensity quintiles over the last ten years
of the sample period (June 2001 - June 2010) ... 68
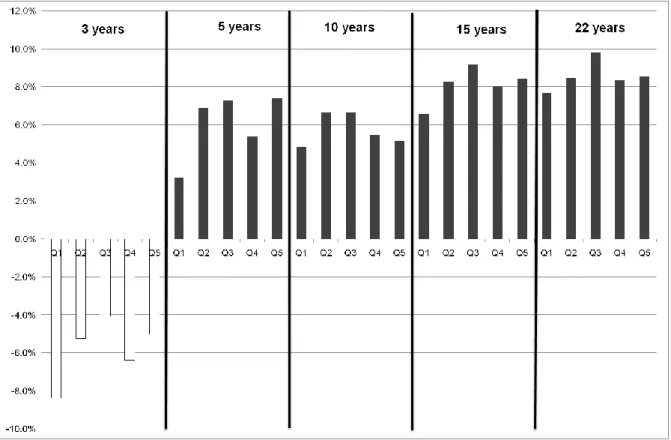
Table 4.3: The average return of quintiles based on capital intensity of the most
recent 3, 5, 10, 15 and 22 years ... 69
Table 4.4: The results of the Student’s t-test on the differences in the mean
value of Q1 and Q5 ... 73
Table 4.5: The results of the tests for normality for capital-intensity quintile 1 ... 75
Table 4.6: The results of the tests for normality of capital-intensity quintile 5 ... 76
Table 4.7: Standard deviation of quintile 1 and quintile 5 over the sample
period ... 77
Table 4.8: The results of the Mann-Whitney U test for quintile 1 and quintile 5 ... 79
Table 4.9: The annualised performance for each of the 17 sets of quintiles
based on capital intensity ... 81
Table 4.10: Relative performance of ROCE quintiles over the full sample
period of 22 years (June 1989 – June 2010) ... 82
Table 4.11: The relative performance of ROCE quintiles over the most
recent 10 years in the sample period (June 2001 – June 2010) ... 84
Table 4.12: The arithmetic average return of quintiles based on ROCE of
the most recent 3, 5, 10, 15 and 22 years ... 85
Table 4.13: Results of the Student’s t-test on the differences in the mean
value of Q1 and Q5 ... 88
Table 4.14: Result of the tests for normality of ROCE quintile 1... 89
Table 4.15: Result of the tests for normality of ROCE quintile 5... 90
Table 4.16: Standard deviation of quintile 1 and quintile 5 over the sample
Table 4.17: The results of the Mann-Whitney U test for quintile 1 and quintile 5 ... 92
Table 4.18: The annualised performance for each of the 17 sets of quintiles based on ROCE ... 94
Table 4.19: Annual return of Box 1 (B1) and Box 25 (B25) of the constructed matrix, over the entire sample period ... 96
Table 4.20: The performance of Box 1, Box 25 and the MSCI World TR index over the entire sample period ... 97
Table 4.21: The arithmetic average annual return of the most recent 3, 5, 10, 15, and 22 years for Box 1, Box 25 and B1-B25 ... 99
Table 4.22: Results of the Student’s t-test on the differences in the mean value of B1 and B25 ... 101
Table 4.23: The results of the tests for normality of Box 1 of the matrix ... 102
Table 4.24: The results of the tests for normality of Box 25 of the matrix ... 103
Table 4.25: Standard deviation of Box 1 and Box 25 over the sample period ... 104
LIST OF FIGURES
Figure 1.1: Capital intensity for Nestle SA over time ... 5
Figure 1.2: Capital intensity for Vodafone Group PLC over time ... 6
Figure 1.3: The construction of a matrix incorporating both metrics as filters ... 13
Figure 2.1: Share of capital spending by sector in the USA during the third quarter of 2010 ... 26
Figure 2.2: Capital intensity by sector as of December 2002... 27
Figure 2.3: Core capability differentials based on skills and assets ... 39
Figure 3.1: A graphical illustration of the research process ... 44
Figure 3.2: Matrix incorporating both capital intensity and ROCE metrics as filters ... 54
Figure 4.1: Cumulative performance of quintiles based on capital intensity ... 68
Figure 4.2: The average return of annually rebalanced quintiles based on capital intensity over different time periods ... 70
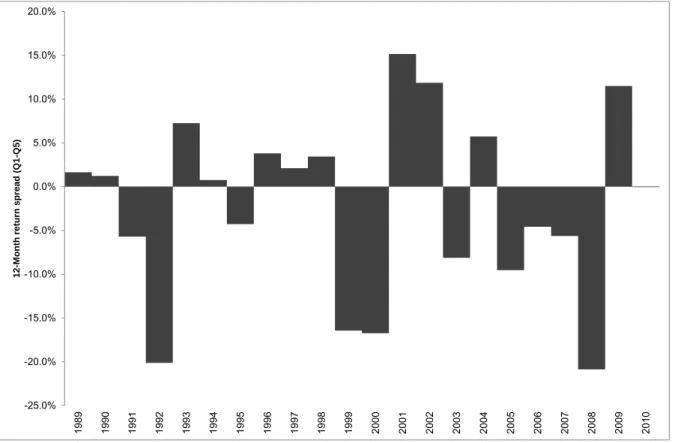
Figure 4.3: Capital-intensity quintile 1 versus quintile 5 return spread (Q1 – Q5) over time ... 71
Figure 4.4: Average annualised five-year holding period returns for capital-intensity quintiles (June 1989 – June 2010) ... 80
Figure 4.5: Cumulative performance of quintiles based on ROCE ... 83
Figure 4.6: Cumulative performance of quintiles based on ROCE over most recent 10-year period (2001 – 2010) ... 85
Figure 4.7: The average return of annually rebalanced quintiles based on returns on capital employed over different time periods ... 86
Figure 4.8: Quintile 1 versus Quintile 5 return spread over time over the entire sample period ... 87
Figure 4.9: The average annualised return for ROCE quintiles over five-year holding periods ... 93
Figure 4.11: Capital intensity and ROCE matrix 12-month return
spread (B1 – B25) ... 98
Figure 4.12: The average return of annually rebalanced portfolios based
on capital intensity and ROCE over different time periods,
compared to the MSCI World TR index ... 99
Figure 4.13: Matrix showing the average percentage returns over five-year
CHAPTER 1
INTRODUCTION
1.1 OVERVIEW
Generating long-term superior returns on invested capital is important to money managers and professional investors (Campbell & Viciera, 2001). Individual investors and institutions entrust their financial capital to professional active portfolio managers with the explicit expectation that the employed agents will apply their relevant skill set to increase investor wealth over time. Investors typically desire long-term, risk-adjusted excess returns. In the effort to maximise investor wealth over time, these allocators of capital have to navigate a vast amount of international financial instruments for potential investment. Equity portfolio managers, in general, consider many financial factors relating to a company before making the investment decision. According to Smith (2010), investing in high quality companies, with good fundamentals increases the probability of generating higher risk-adjusted returns.
The search for high quality companies, and the demand for quality investing as an investment style, increased in popularity after the burst of the stock market bubble in 2001, and after prominent large corporations like Enron and WorldCom failed. A higher demand from investors for quality companies was caused by the increasing occurrence of balance sheet manipulation and various forms of financial fraud. Quality companies are typically characterised by high profitability, low dependency on continued capital investment and enduring intangible assets, like strong brands (Allison, 2009), or competent management (Hall, 1993). Firms that incur relatively little capital expenditure to generate revenue should be able to produce higher free cash flow and increase shareholder wealth over time. Portfolio managers will benefit from the application of an investment approach that can produce superior returns with less than average risk. Research in the investment management field should be structured to develop measures that are able to deliver performance and increase wealth over time. New methods of evaluation and selection that aid them in the security selection process may be important to portfolio managers.
The objective of this research was to examine the value of using the financial metrics of capital intensity and return on capital employed (ROCE) when choosing investments that produce sustainable long-term portfolio returns.
1.2 BACKGROUND AND THEORETICAL FRAMEWORK
It is common practice in the investment industry to organise the equity world into categories based on characteristics like Growth, Value, Large-Cap, Small-Cap, and Domestic or International. This distinction is made at the fund level and fund definitions typically are made along these lines. Portfolio managers and professionals tend to structure their research in this manner, and build their models for portfolio inclusion according to these specifics.
Equity investment strategies exist that have a strong disposition towards focusing on capital intensity and ROCE in their investment processes. One such investment strategy is what is known as franchise investing. Global franchise funds typically aim to achieve attractive long-term returns by investing in a concentrated portfolio of exceptionally high quality global companies. The specific franchise equity investment strategy focuses on factors such as strong cash flows, modest capital requirements, capable management, and growth potential. The research process typically focuses on identifying companies that can consistently and reliably compound shareholder wealth at superior rates of return over the long term (Madden, 2005). Companies deemed to be of high quality, which are typically associated with global brands or franchises, fall into this category. Three key attributes that companies must possess to be considered for portfolio inclusion in franchise funds are:
• Sustainable and high returns on capital on an un-leveraged basis
• Difficult to replicate intangible assets which protect against mean-reversion of the returns on capital
• A reliable recurring revenue stream, which supports a high free cash flow
Capital intensity is an important consideration for global franchise funds, because capital-intensive firms typically rely more on physical, as opposed to intangible, assets as a source of income. As such, capital-intensive firms are less desirable to invest in. The capital intensity metric can be used to filter out capital-intensive firms and indicate possible companies for consideration.
The amount of capital expended to produce a unit of sales revenue gives an indication of the level of capital intensity of a company. A business that requires a large amount of capital investment in physical assets to generate revenue can be labelled as being more capital-intensive (Parker, Ortega, Neuhart & Kausar, 2011), whereas less capital-intensive companies typically do not rely as much on physical assets in its business model. These companies rather depend on their intangible assets as sources of income. It is likely that the nature of the intangible assets of a business and the extent to which it depends on physical assets for its competitive advantage will affect its ability to produce superior returns on invested capital. A company that relies heavily on physical assets and requires continuous capital expenditure in order to sustain its competitive advantage is unlikely to outperform over the long term (Elmasry, 2004).
On the other hand, companies that have a proclivity to intangible assets, such as patents and licenses, tend to have lower capital intensities. As they require less capital investment to sustain their competitive advantage, and rather enjoy a competitive advantage by virtue of their intangible assets, they are more likely to earn consistent excess returns over the long term (Barney, 1991). In addition, intangible assets are more difficult to replicate than physical assets. A company that relies on its physical assets for its competitive advantage is more exposed to the risk of duplication by competitors, which could lead to excess capacity which, in turn, could lead to erosion of returns (Porter, 1979).
It is intuitive that investors should prefer companies with higher levels of profitability above those yielding lower profitability, and the shares of more profitable companies consequently should experience higher returns. Businesses that can deliver strong operational performance (returns from core operations) relative to the capital used to generate those returns should increase shareholder wealth over time. ROCE is widely used as a performance measure in the profit-seeking sector (Rutherford, 2002) and effectively measures how well management is able to employ a firm’s assets to generate returns. ROCE is generally characterised as being a measure of the ability and efficiency of management (White, Sondhi & Fried, 1998:167). High ROCE in firms will therefore be indicative of potential outperforming shares. It can thus be argued that a portfolio consisting of higher ROCE companies should outperform a portfolio comprising lower ROCE firms over the long term.
This study was undertaken to examine the relationship between capital intensity, profitability and stock returns. The expectation was that firms with greater capital intensity and lower profitability would experience diminished returns on capital and depressed
long-term stock returns. Companies that rely more on their intangible assets, and therefore have lower capital intensity, were expected to be able to achieve and maintain superior returns on capital and increase shareholder wealth over time. Similarly, companies with a higher ROCE, therefore being operationally more profitable, should produce excess returns for their shareholders. The effect of compiling a portfolio incorporating both these metrics was also explored. If an annually rebalanced portfolio compiled using ROCE and capital intensity as filters could outperform a total return benchmark index, then a strong argument could be made for the use of the strategy in the money management industry. 1.2.1 Capital intensity
Most companies need to invest capital in their revenue generating process to generate revenue. Capital refers to the plant and equipment used in the production function of a business, as well as its stock of financial assets (Link & Boger, 1999:120). Capital is therefore the term used to refer to the amount invested in plant, property, equipment, inventory and other physical assets (Samuelson & Nordhaus, 2004). Capital expenditure represents the funds used to acquire or upgrade fixed assets other than those associated with acquisitions (Koller, Goedhart & Wessels, 2010:154). It includes but is not restricted to additions to property, plant and equipment, as well as investments in machinery and equipment. It typically represents the necessary expenditure associated with maintaining or increasing the scope of operations.
Capital intensity refers to the amount of capital a business requires to generate one unit of revenue. It therefore gives an indication of the amount of plant, property, equipment, and other tangible assets required to produce a unit of sales. This characteristic can be quantified by using the ratio of a company’s annual capital expenditure divided by revenues, as indicated by Equation 1.1. A lower ratio would indicate a lower amount of capital needed per unit of sales produced; consequently a lower ratio would be more favourable.
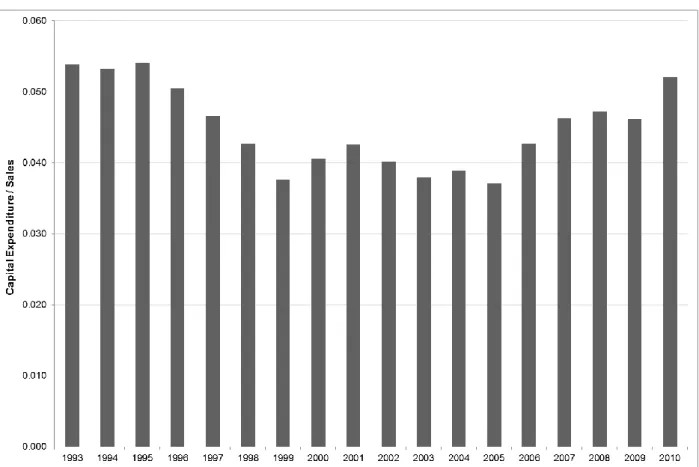
(1.1) The strength of this metric is its ability to measure a firm’s efficiency in the deployment of its assets. However, as firms typically go through capital cycles – periods of increased capital expenditure followed by periods of lower capital expenditure – this metric tends to be unstable over time (Coles, 1997:8). Therefore, as capital expenditure varies from year to year, the static capital-intensity measure tends to fluctuate.
Figure 1.1: Capital intensity for Nestle SA over time Source: Bloomberg
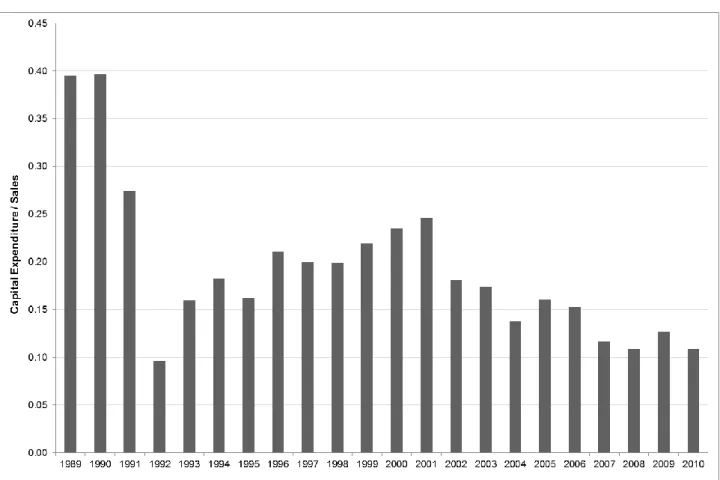
Figure 1.1 shows the capital intensity over time for Nestle SA. It is evident that capital intensity can change over time and fluctuate with the company’s specific capital cycle. The effect of the capital cycle is also evident in the fluctuation of capital intensity over time for Vodafone Group PLC (Figure 1.2). Technical obsolescence can mean the end for a telecom company in a competitive market place. Consequently, it is not unusual for a telephone company to spend a large percentage of its revenues to renew plant, property and equipment. Cellular phone companies are under continuous pressure to migrate from analogue to digital to third generation networks (Elmasry, 2004). This relentless progress and obsolescence of technology manifests itself in hefty capital spending cycles by telephone companies.
Figure 1.2: Capital intensity for Vodafone Group PLC over time Source: Bloomberg
A more stable proxy for capital intensity is normalising the capital expenditure over five years and dividing by sales, as indicated by Equation 1.2. This metric will take into account the effect of the capital cycle most companies are subject to.
(1.2) A low value for capital intensity will mean that the company makes relatively modest use of physical capital to generate revenue through its capital cycle. Firms that can produce a unit of sales revenue with the least amount of capital expenditure through the capital cycle are probably more reliant on intangible assets for their competitive advantage. Intangible assets include customer loyalty, brand names, patents, licences, copyrights and distribution networks (Johnson & Kaplan, 1987). These companies tend to have business models that are not easy to replicate and thus deter new competitive entry into the industry (Porter, 1979).
A high capital-intensity ratio would mean that the company relies heavily on the competitive advantage of its physical capital in order to earn a return. These companies
tend to have business models that are easy to replicate and, as such, invite incursion from rivals (Porter, 1979). New entrants in a market typically absorb excess return as competition in the sector increases. This results in the sharing of the market and competing on price (Madden, 2005; Elmasry, 2004).
Even though the capital cycle varies between companies and between industries, the average capital expense over five years gives a more accurate reflection of a firm’s actual capital intensity through the capital cycle.
1.2.2 Return on capital employed (ROCE)
The return on capital employed (ROCE) ratio compares a firm’s earnings from its primary operations with the capital invested in the company and can serve as a reliable measure of corporate performance (McClure, 2010). ROCE provides a means of measure to determine how well a company invests funds in its basic business operation (Eilon, 1992). The financial ratio used to express ROCE uses Operating Income in the numerator and Capital Employed in the denominator (Elliott & Elliot, 2001). Essentially, ROCE is the operating profit per unit of capital employed, as expressed by Equation 1.3.
(1.3)
Earnings before interest and taxes (EBIT) is a measure of a firm’s profitability that excludes interest and income tax expenses (Bodie, Kane & Marcus, 2004). EBIT indicates the level of operating income the firm is generating.
Capital employed is the total amount of share capital and debt that a company has and uses (Scarlett, 2006:289); it refers to the amount of assets that contribute to a company’s ability to generate revenue. It represents the financial resources necessary for the company to continue functioning and engage in its primary task of revenue generation (Eilon, 1988). Although capital employed has many definitions, it is commonly defined as Total Assets less Current Liabilities (Robinson, 2011). Therefore the ROCE ratio can be expanded as indicated in Equation 1.4:
ROCE is widely used as a performance measure in the profit-seeking sector (Rutherford, 2002) and is commonly employed in making intra- and inter-organisational comparisons (Drury, 2000; Skinner, 1990). The objective usually is to maximise this ratio.
As the ROCE ratio gives an indication of management’s ability to effectively allocate
capital (White et al., 1998), it should be useful as a screen to indicate profitable
companies. The nature of a firm’s competitive advantage stems from its basic business function and ROCE measures how well a company invests in its core operation. A high ROCE should typically be indicative of a company that is both well-managed and profitable.
1.3 PROBLEM STATEMENT
The results obtained from academic research have formed the basis of many investment strategies that are applied in financial markets. An example of the rewarding exchange of ideas between academic research and investment practice is the topic of value versus growth investing (Chan & Lakonishok, 2004). Issues encountered by portfolio managers and investment professionals similarly encourage research and ongoing analysis. Academic research often serves to find empirical evidence for a theory or a specific belief, or to provide logical reasoning behind the justification for an investment strategy. Oftentimes an investment strategy or a fund mandate comprises the application of academic research in practice.
Long-term excess returns that lead to increased shareholder wealth is one of the most important goals for investors (Chugh & Meador, 1984; Campbell & Viciera, 2001). Using a strategy of selecting shares for portfolio inclusion based on certain methods that are substantiated by research may prove valuable to portfolio managers, especially those who attempt to generate long-term excess returns. Although past performance is not an indication of future return, an analysis of past relationships can prove to be a valuable source of information in order to forecast the future. A back-test can aid in the understanding of causality factors relating to past performance, and therefore help make inferences about likely future outcomes based on current conditions.
The purpose of this study was to determine whether the use of capital intensity and ROCE as filters for portfolio inclusion, both separate and together, can produce long-term excess returns. Identifying an investment strategy based on these metrics, which result in consistent superior returns, is the central theme of this study.
1.4 OBJECTIVES AND HYPOTHESES
Portfolio managers of global franchise funds look to invest in companies of exceptional quality whose primary operations are dominated by intangible assets and high operational profitability (Madden, 2005). Metrics such as capital intensity and ROCE could be employed in the research process of these funds to aid in identifying investment candidates. Researchers at Morgan Stanley Investment Management have shown that lower capital-intensity companies on average perform better than high capital-intensity
stocks over time (Elmasry, 2004; Parker et al., 2010).
An investment strategy that produces long-term excess returns proven by a back-test analysis could potentially be employed in the money management industry. It could, for example, be used in a quantitative or fundamental fund as part of a large investment house’s product offering.
Against this background, the current study had three primary objectives, namely: 1. Investigating capital intensity and stock returns
The objective was to determine whether there was a causal link between the level of capital intensity of firms and subsequent total returns, in order to establish whether capital intensity can be used as a value-indicating financial metric. This objective also included determining whether an average return of the lowest capital-intensity firms outperforms the average return of the highest capital-intensity firms on a consistent basis. From this objective, the first hypothesis was formulated as:
H0: An equally weighted portfolio composed of high capital-intensity stocks will
outperform a portfolio composed of low capital-intensity stocks.
Ha: An equally weighted portfolio composed of high capital-intensity stocks will
underperform a portfolio composed of low capital-intensity stocks. 2. Investigating ROCE and stock returns
The study was aimed at determining whether a relationship existed between ROCE and total return. This objective included determining whether an average return of the lowest ROCE firms lags the performance of the highest ROCE companies on a consistent basis. The hypotheses follow:
H0: An equally weighted portfolio composed of low ROCE stocks will outperform a portfolio composed of high ROCE stocks.
Ha: An equally weighted portfolio composed of low ROCE stocks will underperform
a portfolio composed of high ROCE stocks.
3. Investigating the resulting stock returns of an investment strategy using a combination of capital intensity and ROCE as filters for portfolio inclusion
H0: An equally weighted portfolio composed of stocks with the lowest capital
intensity and highest ROCE will underperform a portfolio composed of stocks with the highest capital intensity and lowest ROCE.
Ha: An equally weighted portfolio composed of stocks with the lowest capital
intensity and highest ROCE will outperform a portfolio composed of stocks with the highest capital intensity and lowest ROCE.
In addition, this study investigated the effect of different holding and time periods on the results.
1.5 METHODOLOGY
The proposed methodology included primary as well as secondary research; however, the emphasis in this study was on the empirical results produced by the primary research. 1.5.1 Primary research
Primary research involves the collection and analysis of data collected to specifically address the problem under investigation (McDaniel & Gates, 2001:25). The research process involved defining the population and the sample, the acquisition of the data and, lastly, the data analysis.
1.5.1.1 Population
The universe of securities used included all the constituents of the MSCI World Index for each year over the sample period starting June 1989 to June 2010. The sample period was chosen to provide a sufficient length of time to incorporate the effect of market cycles.
1.5.1.2 Sample
Only companies with a market capitalisation above USD 1 Billion (at 2007 MSCI level) were included in the sample. The 2007 MSCI level was used as the discount factor to filter out small-cap stocks because the constituents are international and, as such, no CPI figure would have been relevant. Firms with small capitalisations were excluded from the universe so that results were not distorted by very small, illiquid firms. Micro- and small-capitalisation shares tend to be more volatile, and small price fluctuations are typically recorded as large percentage return movements, which could significantly skew results when an equally weighted return is calculated (MSCI Barra, 2010).
Firms included in the financial sector were excluded since their financial characteristics and their use of leverage are considerably different from firms in other sectors. The high leverage that is normal for financial firms probably does not have the same meaning as for non-financial firms. Also the capital-intensity metric is less meaningful as financial institutions typically rely less on physical capital investment to generate revenue and more on human and financial capital (both of which are not reflected in the capital-intensity metric).
Companies located in emerging markets were also excluded from the sample. This was done to give the study a developed market focus. Emerging markets constitute a small percentage of the MSCI World Index, and the potential impact of excluding emerging market firms is negligible.
1.5.1.3 Acquisition of Data
Data were taken from Compustat via FactSet. In order to avoid look-ahead bias, all
financial data were lagged by 90 days. Look-ahead bias refers to the use of historical data in the wrong time frame (Daniel, Sornette & Wohrmann, 2008). It is the bias created by the use of information that would not have been known or available during the period being analysed. The best example is the release of a company’s financial results only after a certain period after year-end to allow the audit process to be completed. This lag in financial disclosure could lead to an inherent bias if not addressed.
1.5.1.4 Data analysis
The primary research constituted different phases of data analysis in line with the different objectives of the study. The three primary phases investigated the effect on portfolio returns of two separate metrics as well as a combination of both.
The first two phases of the research followed a similar methodology as studies conducted
by Fama and French (1992) and Lakonishok et al. (1994) into the differences in return
between value and growth stocks. This involved dividing the sample into five subsets, or quintiles, according to the specific metric (for example capital intensity). The companies with the most favourable metric were assigned to the first quintile and the least favourable to the fifth quintile. This was done on an annual basis on the same date (30 June). The total return of an equally weighted portfolio was then measured for the subsequent 12 months. The portfolio was rebalanced annually and the subsequent 12-month return recorded. The cumulative performance of this portfolio could then be compared to a portfolio composed of other quintiles and the average return of the sample.
The third phase incorporated both capital intensity and ROCE in the portfolio composition process. This entailed constructing a matrix by dividing the sample into quintiles based on capital intensity and then arranging the constituents of each quintile into subsets based on their profitability (ROCE). Therefore a primary capital-intensity filter essentially was applied, followed by a secondary filter. This means that there were 25 boxes, as reflected in Figure 1.3. The total return for portfolios composed of the different boxes was recorded and the cumulative performance over the period compared to one another.
Figure 1.3: The construction of a matrix incorporating both metrics as filters 1.5.2 Secondary research
Secondary research (also known as desk research) involves the summary, comparison and systematic review of existing research rather than primary research, where data is collected from, for example, research subjects or experiments (Crouch & Housden, 2003). The main disadvantage of using secondary research is that it may not precisely meet the user’s need or be sufficiently recent to be useful (McDaniel & Gates, 2001).
Secondary research was conducted predominantly to investigate three different themes. Firstly the concept of capital intensity as well as its use in practice as an investment tool was examined. Secondly, the relative merits and theory behind franchises, intangible assets and barriers to entry were looked at. Lastly, profitability and the merits of using ROCE were analysed.
1.6 ORIENTATION OF THE STUDY
This section presents a brief outline and short description of the chapters of the thesis.
Chapter 1 Introduction to the study
In this chapter, a background to the study is provided, the research problem and objectives are formulated, and the research method for the study is discussed.
Chapter 2 Literature review
This chapter will be divided into three different sections, namely capital intensity, ROCE and the theory behind franchises, intangible assets and barriers to entry. Each section covers an in-depth discussion of the relevant theories and research on each topic.
Chapter 3 Research methodology
This chapter is focused on the main methods utilised to conduct the research. A discussion of the research process is included and is followed by a detailed explanation of the data that were used.
Chapter 4 Research results
The findings and the results of the data analysis are presented in this chapter. These findings refer to the results gained from applying each metric in a portfolio construction process over time.
Chapter 5 Summary and recommendations
Based on the results from Chapter 4, a broad summary draws attention to the usability and relevance of each metric investigated. The results are interpreted with reference to the initial objectives of the study. Conclusions drawn from the results are subsequently presented and recommendations are provided. Areas for further research are also mentioned.
CHAPTER 2
LITERATURE REVIEW
2.1 INTRODUCTION
An investment comprises the current commitment of money or resources with the
expectation to benefit from the sacrifice in the future (Bodie et al., 2010:2). Investment
management is the act of planning, implementing and overseeing the funds of an individual or institutional investor (Fabozzi, 2009:1). The investment process followed by portfolio managers and professional investors include the following main activities (Fabozzi, 2009:1):
Setting investment objectives
Establishing an investment policy
Selecting an investment strategy
Constructing and monitoring the portfolio
Measuring and evaluating investment performance
Although investment objectives may vary among investors, investment managers typically aim to achieve an acceptable level of return commensurate with the investor’s stipulated level of risk. Setting investment objectives usually starts with a thorough analysis of the entity whose funds are being managed (Fabozzi, 2009:2). After the investment objectives are established, the investment policy statement is created. The investment strategy must be consistent with the investment objectives and the policy guidelines of the client. Portfolio strategies can be classified as either active or passive (Focardi & Fabozzi, 2004:6). An active portfolio strategy uses available information and forecasting techniques to seek a better performance than a portfolio that is simply diversified broadly. A passive portfolio strategy involves no effort to search for underpriced securities but instead relies on diversification to match the performance of a specified index (Fabozzi, 2009:9).
Two important actions within the constructing and monitoring step are asset allocation and security selection. Asset allocation refers to the process of deciding what proportion of the portfolio should be invested in various classes of assets (Mayo, 2010:98). In most developed countries, the four main asset classes are common stocks, bonds, cash, and real estate (Fabozzi, 2009:5). The asset allocation decision is regarded by many
investment professionals as the most important part of portfolio construction (Bodie et al.,
2010:131), and has been shown to account for almost 94 per cent of the differences in total returns achieved by institutionally managed pension funds (Bogle, 1994:235). Within each asset class, specific securities are chosen for investment. This security selection function involves deciding which specific investments to hold within a particular asset class (Riepe, 2002:38). It is a very important activity for investment managers of portfolios focused on a specific asset class, as security selection explains almost 100 per cent of the difference in performance among funds with restricted mandates. An investment manager’s revenue is fee driven, and fees primarily are based on a percentage of the average amount of assets under management (Jackson, 2003:147). The ability of portfolio managers to find undervalued securities is often the source of their competitive advantage. As such, successful investment managers will be able to attract new funds with greater ease than less successful managers. New methods of evaluation and selection that enhance their security selection skill may therefore be of importance for portfolio managers.
The security selection process starts with screening the universe of available securities and reducing the number by filtering the securities to eliminate those that have undesirable characteristics (Ferri, 2011). The analyst, or portfolio manager, can choose specific factors to screen for, and can, for example, eliminate securities with certain fundamental qualities, or lack of those qualities. By focusing on a reduced number of suitable securities, the analyst can use thorough financial analysis to determine which companies have the most favourable outlook. The portfolio manager typically tries to understand the fundamental profit drivers of companies, and aims to identify firms with favourable prospects.
The investment style describes the approach of the process of managing portfolios, allocating proportions of the portfolio to different asset classes and selecting individual investments (St. Giles, Alexeeva & Buxton, 2003:74). The most prominent equity investment styles are the ‘value’ investment style and the ‘growth’ investment style (Lederman & Klein, 1995:297). The value portfolio manager invests in companies whose current market price appears to be below the company’s real worth, and typically uses fundamental measures such as price-to-earnings (P/E) ratio and price-to-book value (P/B) ratio, amongst others, to help identify these companies (Hall, 2010:135). A portfolio manager who uses the ‘growth’ investing approach selects a potential company based on expectations of strong growth in earnings (Hall, 2010:136). Many other investment styles
exist, such as technical, balanced, core, socially responsible and momentum investing, to name a few.
Similarly, equity investment strategies exist that have a strong disposition towards focusing on capital intensity and return on capital employed (ROCE) in their investment processes. One such investment strategy is what is known as franchise investing. Global franchise funds typically aim to achieve attractive long-term returns by investing in a concentrated portfolio of exceptionally high quality global companies. The specific franchise equity investment strategy focuses on factors such as strong cash flows, modest capital requirements, capable management, and growth potential. The research process typically focuses on identifying companies that can consistently and reliably compound shareholder wealth at superior rates of return over the long term (Allison, 2009). Companies deemed to be of high quality, which are typically associated with global brands or franchises, fall into this category. Three key attributes that companies must possess to be considered for portfolio inclusion in franchise funds are:
• Sustainable and high returns on capital on an un-leveraged basis
• Difficult to replicate intangible assets which protect against mean-reversion of the returns on capital
• A reliable recurring revenue stream, which supports a high free cash flow
Capital intensity is an important consideration for global franchise funds, as its application can filter out capital-intensive firms and indicate possible companies for consideration. The amount of capital expended to produce a unit of sales revenue gives an indication of the level of capital intensity of a company. A business that requires a large amount of capital investment in physical assets to generate revenue can be labelled as being more
capital-intensive (Parker et al., 2011), whereas less capital-intensive companies typically do not
rely as much on physical assets in the business model. These companies rather depend on intangible assets as sources of income. It is likely that the nature of the intangible assets of a business and the extent to which it depends on physical assets for its competitive advantage will affect its ability to produce superior returns on invested capital. A company that relies heavily on physical assets and requires continuous capital expenditure in order to sustain its competitive advantage is unlikely to outperform over the long term (Elmasry, 2004).
On the other hand, companies that have a proclivity to intangible assets, such as patents and licenses, tend to have lower capital intensities. As they require less capital investment
to sustain their competitive advantage, and rather enjoy a competitive advantage by virtue of their intangible assets, they are more likely to earn consistent excess returns over the long term (Barney, 1991). In addition, intangible assets are more difficult to replicate than physical assets. A company that relies on its physical assets for its competitive advantage is more exposed to the risk of duplication by competitors, which could lead to excess capacity which, in turn, could lead to erosion of returns (Porter, 1979).
It is intuitive that investors should prefer companies with higher levels of profitability to those yielding lower profitability; consequently the shares of more profitable companies should experience higher returns. Businesses that can deliver strong operational performance (returns from core operations) relative to the capital used to generate those returns should increase shareholder wealth over time. ROCE is widely used as a performance measure in the profit-seeking sector (Rutherford, 2002) and, in effect, measures how well management is able to employ a firm’s assets to generate returns. ROCE is generally characterised as measuring ‘management’s ability and efficiency in
using the firm’s assets to generate…profits’ (White et al., 1998:167). Firms with a high
ROCE will therefore be indicative of potential outperforming shares. It can therefore be argued that a portfolio consisting of higher ROCE companies should outperform a portfolio comprising lower ROCE firms over the long term.
This chapter presents a review of literature relating to the concepts of capital intensity and ROCE, and their relation to stock market performance. Secondary research was conducted to find evidence to support the expectation that firms with greater capital intensity and lower profitability experience diminished long-term stock returns. In the first part of this chapter, capital intensity-related studies are examined and the second part is focused on ROCE. Lastly, quality investing as an investment style is examined and its similarities to franchise investing are highlighted.
2.2 CAPITAL INTENSITY
Current management literature focuses on classical value levers, such as cost reduction, sales optimisation, and mergers and acquisitions; thereby neglecting a vitally important aspect, namely capital expenditure (Hansen, Huhn, Legrand, Steiners & Vahlenkamp, 2009: 43).
Capital refers to the plant and equipment used in the production function of a business, as well as its stock of financial assets (Link & Boger, 1999:120). Capital expenditure is the amount invested in physical assets and immovable property during the financial year
(Koller et al., 2010:154). To generate revenue, most companies need to invest capital in
their revenue generating process. A firm needs to make capital investments in order to maintain and grow its operations. Although capital expenditure has received limited attention as a value enhancer, it has a considerable influence on long-term company
performance (Hansen et al., 2009:3).
The traditional view is that higher capital expenditures are to be interpreted as good news and rewarded in the market by share price appreciation (Zacks, 2011:124). McConnell and Muscarella (1985) found that stock prices tend to respond favourably to announcements of major capital investment. The rationale is that higher investment expenditures are likely to be associated with greater investment opportunities. It may also indicate that capital markets, which provide financing, have greater confidence in the firm and its management. Capital investment also plays a role in optimising the asset structure of a firm and enabling the introduction of new products. However, Abarbanell and Bushee (1998) found evidence of a negative relationship between capital expenditure and future stock returns. They suggest that it is difficult to interpret evidence of event studies that found higher stock returns in years when firms increased capital expenditure because firms tend to publicly announce only those expenditures that are likely to be viewed favourably. In theory, increased investment expenditures can provide both favourable and unfavourable information. Firms that invest more are more likely to be managed by individuals who have a tendency to over-invest. Thus, by increasing capital expenditure, they are sending a negative signal to the market regarding managerial intentions. Chung, Wright and Charoenwong (1998) argue that share price reaction to a firm’s capital expenditure decisions depends critically on the market’s assessment of the quality of its investment opportunities. Empirical evidence shows that firms that do not have valuable investment
opportunities will experience a decline in share price after announcements of increases in capital spending.
Titman, Wei and Xie (2004) indicate that prior research shows that share prices react favourably to announcements of major capital investment. However, they found evidence that investors tend to under-react to empire building implications of increased investment expenditures. Specifically, they found that firms with the largest increase in investment expenditure tend to underperform their benchmarks over the following five years. This negative relationship cannot be explained by either the risks or the characteristics of the firms. Additionally, they found that firms that increase their capital investments tend to
have high past returns and often issue equity. In their empirical analysis, Titman et al.
(2004) examined firms listed on the New York Stock Exchange (NYSE), American Stock Exchange (AMEX) and NASDAQ during July 1973 to June 1996, that report an annual net sales figure larger than USD 10 million. Additionally, only firms with a positive book value
of equity, and more than two years’ history on Compustat were included. They define an
abnormal capital investment (CI) metric as capital expenditure to sales in year t-1 divided
by the average capital expenditure to sales for years t-4 to t-2. The sample firms are then
divided into quintiles based on the CI metric. Titman et al. (2004) then examine a trading
strategy that forms portfolios in July of year t by taking a long position in firms in the lowest quintile of CI and a short position in firms in the highest quintile of CI. They found that the hedged return is about 16.8 per cent per year. The authors further show that the hedged returns are higher for firms with high cash flows and low debt-to-assets ratios. These firms typically have more flexibility in terms of capital expenditures as they are not encumbered with high levels of debt.
Chan, Martin and Kensinger (1990) found that share price responses to 95 announcements of increased research and development (R&D) spending are significantly positive on average, even when the announcement occurs during a period of declining earnings. The effect differed between high-technology and low-technology companies. Announcements regarding increased R&D expenditure by high-technology firms were followed by positive abnormal returns on average, whereas announcements by low-technology firms are associated with negative abnormal returns.
Traditionally, a firm’s degree of capital intensity is not considered an important indicator of expected future financial performance. Other measures like the price-to-earnings ratio, earnings-per-share and the dividend yield are more popular. Bloom, Lambrechts and Le Roux (1998) found that the ability to differentiate between capital- and labour-intensive
firms has specific consequences for predicting expected financial performance of the two types of enterprises.
From a managerial perspective it is important to determine the level of capital intensity of a firm. Labour-intensive firms react differently to changes in the economic environment than
capital-intensive firms (Bloom et al., 1998). If the degree of capital intensity is known, it can
be used to predict how a firm will react to economic changes, which could be a valuable source of information for financial decision making. A large number of different capital intensity measures have been developed and used in the literature (Sen, 1957; Burger & Hamman, 1999; Shepard, 2005:257; Stickney & McGee, 2007). These definitions were developed in different fields of study and could all be used to define the concept of capital intensity. In the field of financial management a firm is defined as being capital-intensive if a large percentage of total assets consists of property, plant and equipment (PPE), or a large amount of capital is needed to generate a certain level of revenue (Erasmus, Lambrechts, Le Roux & Gardner, 2000). However, the different definitions focus on different aspects of a firm. In some instances it may therefore be possible that one definition is more applicable to a specific firm than another.
Lim (1976) showed that the different techniques developed in the literature to measure capital intensity leave much to be desired and argues that a modified capital-labour ratio, with capital adjusted for utilisation, is theoretically the most suitable measure of capital intensity. Lim (1976) asserts that the common measure of capital intensity as total capital divided by labour has many weaknesses. One weakness is the failure to define labour as the number of workers on the biggest shift. It also assumes that the stock of capital is utilised at the same rate across firms and industries. Previous studies have shown that the level of capital utilisation varies considerably between industries in less developed countries (Winston, 1971).
Erasmus et al. (2000) critically considered various traditional measures of capital intensity
and developed a method to determine the appropriate measure of the capital intensity of a firm. After classifying firms listed in the industrial sector of the Johannesburg Stock
Exchange (JSE) during the time period from 1989 to 1996, Erasmus et al. (2000) used
principal component analysis and related biplots to provide a multidimensional graphic representation of the multivariate data. The results of the study indicated that the five traditional measures of capital intensity not based on value-added figures are all suitable
composite measure composed of the five traditional measures of capital intensity as the most appropriate definition.
Burger and Hamman (1999) investigated selected listed companies in the industrial sector of the JSE to determine the degree of capital intensity of the selected companies. This was done by calculating various measures of capital intensity and ranking the companies accordingly. It was found that there were no significant differences between the rankings of the ratios. It was also found that some companies displayed a dualism in that they were capital-intensive on some measures and not capital-intensive on others.
Capital-intensive firms use large amounts capital to invest in PPE, which exposes the firm to a number of risks (Lee, Lee & Lee, 2009:301). Changes in the economic cycle could have a negative effect on the financial performance. A change in factors such as interest rates, inflation, the availability of capital and liquidity in capital markets could all have a detrimental impact on the profitability of a capital-intensive firm. An increase in the interest rates in the economy, for example, will lead to an increase in the cost of capital, which will have a negative impact on the profitability of the firm. In an environment of high inflation, the capital-intensive firm needs to ensure that provision is made for the increased
replacement value of assets (Erasmus et al., 2000). If liquidity in capital markets is low, a
capital-intensive firm may find it difficult to obtain sufficient capital to support its operations. Similarly, if there is a shortage of capital in the market, or low availability of capital, the implication would be that the capital-intensive firm may have to pay more to obtain the limited amount of capital that is available, or not be able to obtain capital at all.
Lee et al. (2009) emphasise that capital intensity increases total business risk. A firm with
a large dependence on capital expenditure to support its operating function tends to have more fixed costs, like depreciation, as a result of the large amount of PPE. Business risk increases as the amount of fixed costs utilised in operations increases (Kapil, 2011:248). The percentage fixed costs in the total cost structure is directly proportional to the operating leverage of the firm. In a firm with a high operating leverage, a small change in sales will result in a large change in operating income. Fixed costs do not decline when demand drops off, so when there is a downturn in the economic cycle, the large operating
leverage has an amplified negative effect on profitability (Lee et al., 2009:301). Variable
costs, on the other hand, are adjustable in meeting changes in revenue. When a decrease in sales occurs, variable costs can be reduced to meet the lower output demand. The extent to which firms can control operating leverage depends on the type of product or service they provide. Companies that require large investments in fixed assets, like steel
mills and automobile manufacturers, have large fixed costs and a resulting high operating leverage (Bhabatosh, 2008:158). If a capital-intensive firm increases its debt or issues securities to finance large capital expenditures, the financial risk of the firm would increase as well. However, the latitude available to management in terms of economic stress tends to be less for capital-intensive companies (Burger & Hamman, 1999). A risk-averse firm may opt for alternatives with smaller investments and lower fixed costs, or use finance arrangements like leases to shift the burden of ownership and thereby reduce the investment requirement.
According to Giovinazzo (2008), high-margin businesses that are not capital-intensive are intuitively preferable to investors compared to low margin, high capital-intensive businesses. The author investigated whether a strategy based on selecting firms with lower capital intensity produced long-term excess returns. Giovinazzo (2008) used asset intensity as a proxy for the net investment a firm needs to make to attain a given growth rate. The study showed that firms with heavy (light) asset intensity have lower (higher) subsequent stock returns. A long-short portfolio based on this effect yielded abnormal returns of around 0.4 per cent per month. He also found that asset-heavy stocks miss consensus analyst earnings forecast 16 per cent more often than asset-light stocks, suggesting that investor forecast error is the main driver of the return difference. Giovinazzo (2008) used a universe of stocks that included all listed stocks on the NYSE, AMEX and NASDAQ for the period 1963 to 2006. He excluded all American Depository Receipts (ADRs), Real Estate Investment Trusts (REITs), Financial firms and Indices. Elmasry (2004) investigated the relative performance of low versus high capital-intensive companies over different time horizons through to 2002. The universe of stocks included more than 2200 listed firms in North America and Europe, but excluded financial firms. Quintiles were created on the basis of capital intensity where the least capital-intensive stocks were assigned to the first quintile and the most capital-intensive companies to the fifth quintile. The average return for the stocks in each quintile was then measured over the following year and the quintiles rebalanced annually. The results showed that the lower capital-intensive quintiles outperformed the more capital-intensive quintiles over three-, five-, ten- and eighteen-year horizons. This effect is more pronounced over longer periods. However, it was not the least capital-intensive quintile that performed best in any of the time periods, but rather the second quintile. More capital-intensive companies struggle to generate consistently superior growth in shareholder value. This may be because capital-intensive firms typically rely on tangible assets for their competitive advantage which is
easy to reproduce by rivals. This ease of replication promotes ample capacity, tough competition, feeble pricing, margin pressure and lower returns on capital. In contrast, companies that use more intangible assets can benefit from a gentler pricing environment, higher returns on capital and greater compounding of shareholder wealth.
Corporations often choose between increasing capital intensity by installing expensive
technology, like using robotics in place of labour, and increasing their labour inputs (Lee et
al., 2009:301). A recent trend for many growth-oriented firms, whether manufacturers or
other members of the business sector, is to increase their efficiency through increased investments in physical capital. Automobile firms, for example, are finding that robots assemble cars of high and consistent quality at a fraction of the cost of assembly line labour. This may result in automobile firms increasing their capital intensity ratio over the short term becoming more efficient and ultimately more profitable over the longer term.
Hansen et al. (2009) assert that there is value-creating potential in optimising capital
investments. By introducing structural cost reductions, amongst others, Hansen et al.
(2009) specifically found that the potential increase in a firm’s return on investment (ROI) is between 15 per cent and 40 per cent. The authors assert that this potential increase arises from the acceleration of production ramp-up and increases in operating cash flow during the productive life of the project. A company that is able to employ optimising strategies effectively may create value for shareholders despite seemingly high capital intensity.
According to Shapiro (1982:399) investments are made to increase the assets of a company, as greater output requires an increase in assets. Companies can, however, increase their output by using existing assets more productively, but there is a limit to which this could occur.
Kostin, Fox, Maasry, Sneider and Timcenko (2009) suggest that there are two primary factors that determine the quantity and timing of capital expenditure:
1. Anticipated end-market demand. 2. Cost of financing.
Using the S&P 500 during 1985 to 2007 as the sample, these researchers found that capital expenditure is highly correlated with sales. The computed correlation increased to 0.85 from 0.62 when sales are lagged for two quarters. This shows that capital expenditure