22
Static and Dynamic Revealed Comparative Advantage:
A Comparative Analysis of Turkey and Russia
Sevcan GÜNEŞ1, Marina TAN2
Pamukkale Üniversitesi ABSTRACT
With respect to bilateral trade between Turkey and Russia, static and dynamic RCA was calculated for 14 ‘common sectors’, in which Russia and Turkey exported similar quantities of goods to the rest of the world. The static RCA is indicative of the fact that Turkey is more advantageous than Russia at both bilateral and global levels. However; an analysis of dynamic RCA for the 14 common sectors revealed that while Turkey has dynamic comparative advantage for six sectors, Russia has dynamic comparative advantage for 11 sectors. Despite the fact that Russia is more disadvantageous than Turkey in static terms, it has more sectors falling under the rising star category in dynamic terms. In this context the results of this study could be used to develop new fiscal policies to improve both static and dynamic sectorial comparative advantage.
Keywords: Trade, Revealed Comparative Advantage, Balassa Index, Dynamic Revealed Comparative Advantage.
JEL Classifications: F10, F14
I. INTRODUCTION
The globalization process, particularly resulting in reduction of trade barriers, makes the competitive position of the countries in the world market increasingly important. A significant amount of empirical evidence point towards the positive effects of openness on the economic growth of a country (Balassa (1982), Edwards (1993), Grossman and Helpman (1991), Gul and Kamaci (2012). In this context, it is important for a country to improve its trade performance against its competitors for acquiring higher levels of competitiveness in a fast globalizing world.
Traditional trade theory provides us with a useful framework for understanding the manner in which countries compete in the international markets. In this framework, competitiveness is generally linked to relative price (cost) differences. Comparative advantage is referred to as a country’s ability to produce a good at a lower opportunity cost than its trading partner (Ekmen-Ozcelik and Erlat, 2013:205). Balassa (1965) proposes that comparative advantage is revealed by observable trade patterns as well as the unobservable relative prices.
Thus, the inference of comparative advantage from observed data is referred to as revealed comparative advantage (RCA). In practice, this is a commonly accepted method of analyzing
1 Doç.Dr. Sevcan Güneş, Pamukkale Üniversitesi İİBF İktisat Bölümü, 20070, Denizli, Türkiye, [email protected]
2 Marina Tan, Pamukkale Üniversitesi İİBF İktisat Bölümü Yüksek Lisans, 20070, Denizli, Türkiye, [email protected]
23 trade data. The Balassa index tries to identify whether a country possesses a ‘revealed’ comparative advantage, instead of determining the underlying sources of comparative advantage.
This paper analyzes both static and dynamic RCA of Turkey and Russia in the world market. The selection of these two countries is influenced by a few factors. First, Russia and Turkey are located between Europe and Asia, sharing the Black sea and the Turkish straits, Bosphorus and Dardanelles. This geographical positioning has led the countries to associate with similar trade partners, with Europe being the leading trade partner for both countries. Second, Russia and Turkey are positioned close to each other in the World Competitiveness Report. Third, both countries are categorized as ‘developing’ countries. Morgan Stanley defined Turkey as one of the ‘fragile five emerging markets’, and Russia was categorized as part of the BRICS group by Goldman Sachs, years ago. Finally, although the resource endowment is different in Russia and Turkey, both countries exhibit export oriented growth strategies.
Concerning bilateral relations, it is hard to describe the modern Russian-Turkish relations in one word. Russian-Turkish relations started transforming post the Russo-Turkish wars, which took place in the 18th and 19th century. The post-war period witnessed growing economic interdependence between Russia and Turkey, and increased participation of both the countries in political, economic and cultural exchanges involving neighboring countries, bordering the Black sea, and principal geopolitical rivals.
This relationship was jeopardized after a Turkish jet shot down a Russian fighter jet, which was accused of violating the Turkish airspace in late November 2015. This incident led the Russian President, Vladimir Putin, to sign an executive order detailing “special economic measures against the Turkish Republic,” which included restrictions or ban on imports of certain products from Turkey and stalling of long-term projects in gas and nuclear energy industries that were scheduled to commence on 1st January, 2016. Additionally, many other potential projects are being cancelled until political situation is restored to normalcy.
While experts are calculating the possible losses in tourism, construction and power sectors, entrepreneurs of both countries are trying to solve the problems by redirecting trade flows and elaborating substitutional solutions for restricted sectors. An analysis of trade flows between Russia and Turkey allows us to state the mutually complementary nature of bilateral trade. This mutual interest in trade is implied by the strong advantages for Russia in exporting oil and natural gas, and similar advantages for Turkey in the fruit and vegetable sector.
Russia and Turkey export similar volume of goods (in USD measure). This analysis is also different in scope as it focuses on two countries and the export performance of their common sectors against the rest of the world. The time period “2007-2014” is selected for the study to analyze the comparative advantage performance of each countries’ common export sectors because the negative effects of political shocks may effect comparative advantage results
.
The current study aims to compare export performance of both the countries in the common sectors for the period between 2011 and 2014. The questions answered in this paper include: (i) Which sectors have advantages in bilateral and world trade for Russia and Turkey? (ii) What are the competitive dynamics of these sectors? (iii) What factors are likely to affect the trade patterns? In this context using the sectoral-based trade statistics, the various indexes like24 static and dynamic Revealed Comparative Advantages (RCAs) were calculated. Then the result of the indexes were discussed.
2. LITERATURE
Yilmaz (2003) examined the competitiveness of Turkey in comparison to the European Union (EU) countries including Bulgaria, Czech Republic, Hungary, Poland, and Romania3. He used the sectoral classification, which was first explained by Hufbauer and Chlas (1974) and implemented by many others studies (Erlat, 2005; Yilmaz, 2002; Ekmen Ozcelik & Erlat, 2013), including the present one. Commodities were grouped with the Standard International Trade Classification (SITC), and various indexes4 were calculated.
Yilmaz’s findings state that Turkey has a strong comparative advantage in RMIG and LIG, and comparative disadvantage in EIRIG and in DIRIG5. With respect to the five EU countries, Hungary was the only country that had a comparative advantage in exporting EIRIG, and Bulgaria and Czech Republic possessed competitiveness in CIG.
Yilmaz and Ergun (2003) continued to analyze the same set of countries using seven different measures of competitiveness. The findings showed that the export performance of all the analyzed countries was weak in the research-oriented goods segment. These countries exhibited weak production performance and poor competitiveness in the research-oriented goods domain.
However, the dynamics of indexes for Turkey revealed an improvement in Turkey’s trade diversification. The positive effect of the customs union on the Turkish trade pattern was revealed through the acceleration observed from the indexes.
In another study, Ferman, Akgüngör and Yüksel (2004) found that Turkey’s closest rivals in the EU market are China and India. The study also showed that although Turkey possessed international competitiveness in labor intensive and easily imitable research-oriented goods, the country had low competitiveness in difficult-to-imitate research-oriented products.
3 Now all countries are full members of EU
4 RCA – Revealed Comparative Advantage, CEP – Comparative Export Performance, TO – Trade Overlap, ES – Export specialization
5 Hufbauer and Chilas (1974) use a three-way classification: Ricardo goods, which use primarily natural resources in their production; Heckscher-Ohlin goods, which are produced using a standard technology that may either be labor or capital intensive; product cycle goods, which use high-technology with an important research component. In terms of the classification above, Raw-Material Intensive Goods (RMIG), obviously, correspond to Ricardo goods, Heckscher-Ohlin goods are subdivided into Labor Intensive Goods (LIG) and Capital Intensive Goods (CIG), and product cycle goods into Easy-to-Imitate Research Goods (EIRG) and Difficult-to-Imitate Research Goods (DIRG).
25
Author, Countries Method used Conclusions
Yilmaz (2003) Yilmaz and Ergun
(2003) Turkey vs Bulgaria, Check Republic, Hungary, Poland, and Romania towards EU-15 market Technological groups from Hufbauer and Chilas (1974), RCA indexes, Including CEP – Comparative Export Performance, TO – Trade Overlap, ES – Export Specialization
Turkey has a strong comparative advantage in RMIG, LIG and comparative disadvantage in EIRIG and in DIRIG. Among 6 only Hungary had a comparative advantage in exporting EIRIG and only Bulgaria and Check Republic had a competitiveness in CIG. All countries export performance are weak in the segment of research-oriented goods. All countries were weak in the performance of production and competition in research-oriented goods. Dynamics of indexes for Turkey revealed the improvement in Turkey’s trade diversification. The positive effect of Custom Union on Turkish trade pattern was proved by the acceleration observed from indexes
Utkulu and Seymen (2004), Turkey vis-à-vis EU/15 Balassa RCA, Vollrath RCA, Brülhart B Marginal Intra-Industry Trade, Grubel-Lloyd, Trade Overlap Indexes
Turkey has revealed comparative advantage for seven of the 63 product groups: closing and closing accessories; vegetables and fruit; sugar, honey; tobacco; oil seeds and oleaginous fruits; rubber manufactures; textile yarn, fabrics and related products. First two groups having highest RCA seemed to lose their level of comparative advantages in time. Authors suggest that CU could cause such behavior as commodity “closing and accessories” losing its comparative advantage in EU, was gaining it in the world market
Erlat&Erlat (2005), Turkey’s comparative advantage vis-à-vis pre-expanded EU-15, 1990-2000
Traditional and non-traditional, Technical
classification, RCA as period average
More than a half of all exporting sectors are traditional and also dominating over time. The share of the exports of the sectors with Balassa index greater than unity in total exports were above 50% in all countries but highest for Turkey. Taking into account the shares in actual exports the dominant class for Turkey is LIG in both non-traditional traditional categories. The shares of Easy-to imitate and Difficult-to-imitate Research Intensive Goods both showed increase in last three years. A country that exhibited a similar to Turkey trade pattern was Belgium.
Ekmen-Ozcelik&Erlat (2013), Turkey vs non-EU countries in EU market, 1996-2010 RCA Balassa, Edwards Dynamic RCA
Turkey has 68 (85% of total export) over-unity RCA sectors with 13th rank. Russia has the highest share of over-unity RCA sectors in total exports (93%) with one of the lowest percentage of over-unity RCA sectors in total number of sectors (31th rank) which proves Russian very concentrated export structure. For Turkey LIG category has the highest share in total export. Highest share of Turkey’s total exports fall in the category of “rising stars,” second-highest share has the “lagging retreat,” that is that a considerable portion of Turkish exports belong to sectors which are declining in terms of their share in EU-15 market. Russia appeared to have the highest share in “lagging opportunity” with 1st rank among all countries (68.6%), and second highest share in “rising stars” although with considerably low share in total exports (13.1%).
Table 2.1 Literature Review, Turkey’s RCA
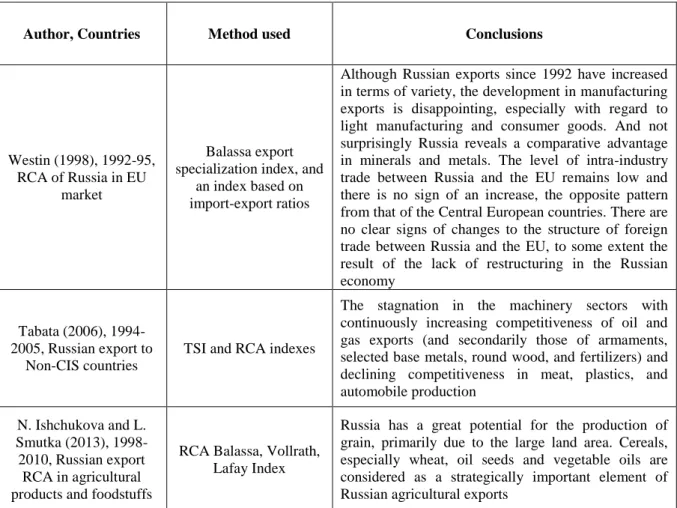
Westin (1998) investigated the effect of the first four years of reforms (1992-95) on Russia's comparative advantage in trading with the EU. This investigation employed the Leamer goods classification, Balassa export specialization index, and an index based on import-export ratios. The outcome of the analysis shows that although Russian exports since 1992 have increased in terms of variety, the development in manufacturing exports is disappointing, especially with regards to light manufacturing and consumer goods. It is not surprising to note that Russia reveals a comparative advantage in minerals and metals.
The level of intra-industry trade between Russia and the EU remains low, and there is no sign of an increase in the trading activities between the countries. However, an opposite trade
26 pattern was detected among the Central European countries. Overall, this study shows that there are no clear signs of changes to the structure of foreign trade between Russia and the EU, which, to some extent, is attributed to the lack of restructuring in the Russian economy. Tabata (2006) calculated trade specialization index (TSI) and RCA for trade with non-CIS countries. The findings of this study again asserted stagnation in the machinery sectors, continuously increasing competitiveness of oil and gas exports, followed by armaments, selected base metals, round wood, and fertilizers, and declining competitiveness of meat, plastics, and automobile production segments.
Author, Countries Method used Conclusions
Westin (1998), 1992-95, RCA of Russia in EU
market
Balassa export specialization index, and
an index based on import-export ratios
Although Russian exports since 1992 have increased in terms of variety, the development in manufacturing exports is disappointing, especially with regard to light manufacturing and consumer goods. And not surprisingly Russia reveals a comparative advantage in minerals and metals. The level of intra-industry trade between Russia and the EU remains low and there is no sign of an increase, the opposite pattern from that of the Central European countries. There are no clear signs of changes to the structure of foreign trade between Russia and the EU, to some extent the result of the lack of restructuring in the Russian economy
Tabata (2006), 1994-2005, Russian export to
Non-CIS countries
TSI and RCA indexes
The stagnation in the machinery sectors with continuously increasing competitiveness of oil and gas exports (and secondarily those of armaments, selected base metals, round wood, and fertilizers) and declining competitiveness in meat, plastics, and automobile production
N. Ishchukova and L. Smutka (2013),
1998-2010, Russian export RCA in agricultural products and foodstuffs
RCA Balassa, Vollrath, Lafay Index
Russia has a great potential for the production of grain, primarily due to the large land area. Cereals, especially wheat, oil seeds and vegetable oils are considered as a strategically important element of Russian agricultural exports
Table 2.2. Literature Review, Russian RCA
This study follows Utkulu and Seymen (2004) and Ekmen-Ozcelik and Erlat’s (2013) approach by calculating original Balassa index (1965) and modified measures of RCA indexes (Edwards and Shoer, 2002). This analysis is also different in scope as it focuses on two countries and the export performance of their common sectors against the rest of the world. The time period (2007-2015) selected for analysis also renders uniqueness to the analysis
.
3. STATIC AND DYNAMIC RCA ANALYSIS RESULTS
The Balassa or RCA index tries to identify whether a country has a revealed comparative advantage, instead of determining the underlying sources of comparative advantage. In other words, the RCA index is used to identify the commodity trade potential between countries,
27 and determine the trade potential between new partners. However, since first suggested by Balassa (1965), the definition of RCA has been revised and modified, thereby leading to multiple implementations of RCA. A few studies refer to the RCA index as Comparative Export Performance (CEP) (like in Yilmaz and Ergun, 2003; Yilmaz, 2002; Erlat and Erlat, 2005; Akgüngör et.al., 2002). With regards to measurement, some studies measure RCA at the global level (see e.g., Vollrath, 1991), while others measure RCA at a sub-global/regional level (see Balassa’s original index). There are also studies that use the measurement for identifying bilateral trade between two countries or trading partners. (Utkulu and Seymen, 2004:15)
The present paper measures Balassa index for Turkey and Russia at a bilateral level, and subsequently widens the analytical framework to measure comparative advantage of both the countries at a global level.
RCA = (Xij / Xit) / (Xwj / Xwt) = (Xij / Xwj ) / (Xit / Xwt) (1)
Where,
xij: Exports of ith country in ‘j’th product Xit: Total Exports value of the ith country. Xwj: Total World Exports of ‘j’th product Xwt: Total World Exports
As stated earlier, RCA measures a country’s commodity (or industrial) exports relative to its total exports and to the corresponding exports of a set of countries. The RCA index ranges between 0 and 1. An RCA index equals to 0 indicates disadvantage for a country exporting a particular commodity category, while an RCA value greater than 1 indicates a higher degree of advantage for the country in the exports of the commodity. Although RCA indicates a country’s trading potential, it is sometimes argued that the RCA index is biased because it does not consider a country’s imports, especially when the size of openness of a country is important (Greenaway and Milner, 1993).
The export commodities measured through RCA are classified in accordance of their technological characteristics, based on the approaches adopted by Hufbauer and Chilas (1974) and Yılmaz (2002). The latter also utilized the approach suggested by Ekmen-Ozcelik and Erlat (2013). Yilmaz’s method classifies the products as raw material intensive goods (RMIG), labor-intensive goods (LIG), capital-intensive goods (CIG), easy-to-imitate research goods (EIRG), and difficult-to-imitate research-intensive goods (DIRG). This classification can be summarized as follows:
SITC 0, 2 (ex.26), 3 (ex.35), 4, 56 are classified as raw material intensive goods (RMIG),
SITC 26, 6 (ex.62, 67, 68), 8 (ex. 87, 88) are classified as labor-intensive goods (LIG),
SITC 1, 35, 53, 55, 62, 67, 67, 78 are classified as capital-intensive goods (CIG),
SITC 51, 52, 54, 58, 59, 75, 76 are classified as easy-to-imitate research-intensive goods (EIRG),
SITC 57, 7(ex.75, 76, 78), 87, 88 are classified as difficult-to-imitate research-intensive goods (DIRG).
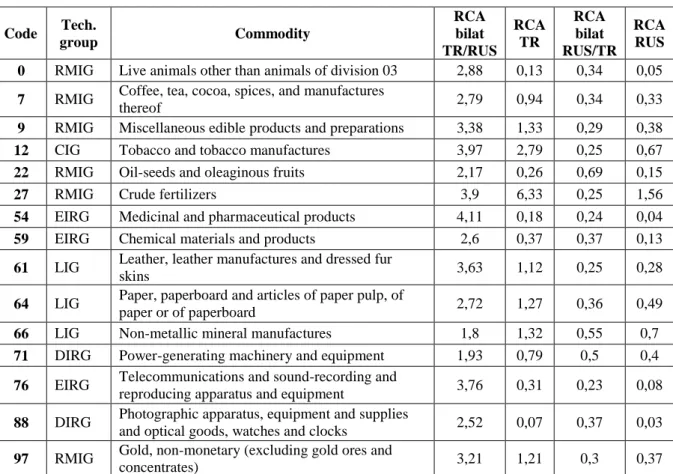
28 Note, that the current analysis covers common sectors, which were selected by comparing export values of commodities in Russian and Turkish exports in 2014. The result of the division of the export value of commodity ‘i’ is in the range from 0.8 to 1.3. For example, the export of live animals from Turkey was 26,720,290 USD, and the Russian export of the same commodity was 28,924,796 USD in 2014. A division of the Russian and Turkish export values for the selected commodity gives 1.08, which is within the specified range of 0.8 and 1.3. This value implies that the ‘live animals’ category belongs to the common sector. Similar procedure was applied to all the commodities for extracting 15 common sectors, with an aim of conducting further analysis. It is important to mention that the number of common sectors has changed over the years. For example, in 2007-2010, there were only five common sectors, which increased to 11 in 2011 and 13 in 2013. There has also been a notable year-on-year change in the sectors classified under the common sectors category. Although our methodology allowed the extraction of 15 sectors in 2014, a growth or decline in commodities export values might lead to further change in the number and type of sectors in the near future. Code Tech. group Commodity RCA bilat TR/RUS RCA TR RCA bilat RUS/TR RCA RUS
0 RMIG Live animals other than animals of division 03 2,88 0,13 0,34 0,05
7 RMIG Coffee, tea, cocoa, spices, and manufactures
thereof 2,79 0,94 0,34 0,33
9 RMIG Miscellaneous edible products and preparations 3,38 1,33 0,29 0,38
12 CIG Tobacco and tobacco manufactures 3,97 2,79 0,25 0,67
22 RMIG Oil-seeds and oleaginous fruits 2,17 0,26 0,69 0,15
27 RMIG Crude fertilizers 3,9 6,33 0,25 1,56
54 EIRG Medicinal and pharmaceutical products 4,11 0,18 0,24 0,04
59 EIRG Chemical materials and products 2,6 0,37 0,37 0,13
61 LIG Leather, leather manufactures and dressed fur
skins 3,63 1,12 0,25 0,28
64 LIG Paper, paperboard and articles of paper pulp, of
paper or of paperboard 2,72 1,27 0,36 0,49
66 LIG Non-metallic mineral manufactures 1,8 1,32 0,55 0,7
71 DIRG Power-generating machinery and equipment 1,93 0,79 0,5 0,4
76 EIRG Telecommunications and sound-recording and
reproducing apparatus and equipment 3,76 0,31 0,23 0,08
88 DIRG Photographic apparatus, equipment and supplies
and optical goods, watches and clocks 2,52 0,07 0,37 0,03
97 RMIG Gold, non-monetary (excluding gold ores and
concentrates) 3,21 1,21 0,3 0,37
Table 3.1 Common sectors, Bilateral RCA and World RCA indexes in 2014, Turkey and Russia
The common sectors, in the year 2014, accounted for 5.2% of the total export value for Russia and 13.5% for Turkey. The RCA shows strong advantage of Turkey over Russia, at a bilateral level, in all the selected sectors. While on the global level Turkey has seven out of 15 sectors with RCA greater than unity, Russia only has one sector (crude fertilizers) with an RCA greater than one.
This study also uses the Dynamic RCA index by Edwards and Schoer (2002). According to Balassa (1965) and Vollrath’s (1991) static approach, this index is beneficial as it treats the concept of comparative advantage from a dynamic point of view. The indexes of Balassa and
29 Vollrath are limited in nature as they cannot be employed to explain the changes in comparative advantages that occur over a period of time. Edwards and Schoer (2002), in contrast, developed the Dynamic RCA index to analyze the changing comparative advantages over time. It is built by decomposing the growth in RCA into several components. Formally, by taking the logs of the conventional RCA index and then by total differentiation, Edwards and Schoer (2002) decomposed the growth in the RCA index as follows:
(5)
In this formula, the first term on the right-hand side reflects the growth in the share of commodity j in the total trade of the country i, and the second term reflects the growth in the share of commodity j in the world trade.
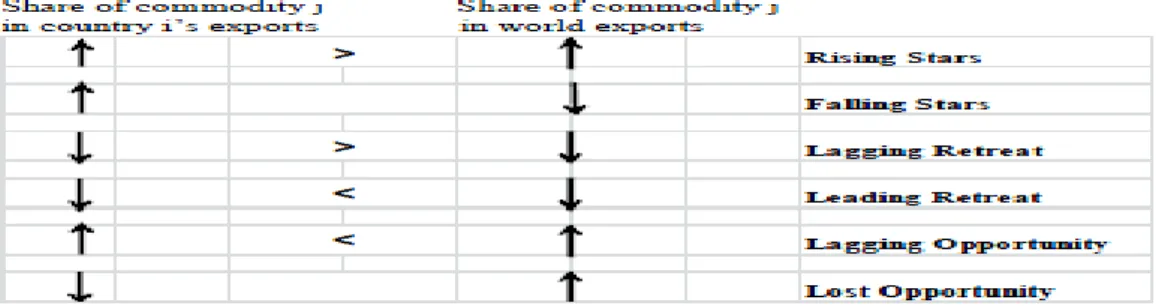
Observing the relative trends in the share of commodity j in the country i and the world exports, Edwards and Schoer (2002) analyze the dynamics of market position. This is summarized in Table 3.2 below:
Table 3.2 Definition of Dynamic Market Positioning of Exports
Source: Edwards and Schoer (2002)
Employing the dynamic RCA index, export goods in the dynamic market positioning are categorized into the following six groups:
Rising stars: If a country’s share rises in the world market more than the rise in the share of a commodity in world’s total exports. This is the most preferred location for a country since the market share of the country is increasing for commodity by virtue of its increasing global demand.
Falling stars: If country’s share rises while the share in worldwide exports is falling
Lagging retreat: If a country’s share falls more than the fall in the share of a product in the world market;
Leading retreat: If a country’s share falls less than the fall in the share of a product in the world market;
Lagging opportunity: If a country’s share rises, but less than the rise in the share of a product in world exports;
Lost opportunity: If a country’s share falls while the share of worldwide exports is rising. This is the least favorable position for a country.
Following Edwards and Schoer (2002) and Ekmen-Ozcelik and Erlat (2013), Turkish and Russian exports were classified according to their dynamic market positions. In this regard, the study compares the increase or decrease in the share of a product in Turkey’s total exports
30 and the increase or decrease in the share of that product in Russia’s total exports, with a decrease or increase in the world share. The cases of rising stars and leading retreat are considered as ‘successful restructuring of exports’, while the cases of falling stars and lost opportunity are evaluated as ‘poor restructuring of exports’. Leading retreat is referred to as successful restructuring as it might seem rational to retreat by restructuring away from the products that are experiencing a decline in demand in the world market. In addition, falling stars are not considered as undesirable as lost opportunity because of the gain that a country experiences in its market share. However, falling star is not as desirable as the rising star category (Ekmen-Ozcelik and Erlat, 2013:205). It should be noted that Edwards and Schoer (2002) evaluated the changes in RCA by comparing the values between an initial and a final year. In this study, dynamic index was also calculated for two periods, i.e., 2007-2010 and 2011-2014, wherein the first period reflects the impact of global crisis on trade and the second period covers the post-crisis recovery.
Dynamic Market Positions Turkey Russia
2007-2010 2011-2014 2007-2010 2011-2014 Rising Stars % 21,7 19,7 25,7 10,2 Sectors 1, 4, 5, 8, 9, 23, 25, 27, 29, 34, 41, 52, 54, 55, 56, 59, 62, 77, 83, 85, 87, 93 0, 1, 2, 3, 4, 8, 11, 12, 29, 54, 55, 58, 59, 61, 63, 82, 85, 87, 88, 89, 93, 97 0, 3, 27, 34, 35, 41, 52, 93 35 sectors Sectors, RCA>1 4, 5, 9, 27, 55, 62 4, 12, 55, 58, 61, 63, 82, 89, 97 27, 34, 35, 52, 93 4, 63 Falling Stars % 31,5 7,6 1,8 62,0 Sectors 2, 11, 24, 51, 53, 57, 58, 63, 64, 66, 67, 68, 6, 7, 25, 27, 32, 41, 42, 52,53, 57, 64, 72, 75 57, 66, 76, 79, 88 6, 7, 26, 27, 32, 33, 41, 42, 43, 51, 52, 53, 57, 62, 64, 72, 73, 75, 79, 96 Sectors, RCA>1 53, 58, 63, 66, 67, 69, 82 6, 27, 42, 53, 64 none 27, 32, 33 Lagging Retreat % 3,1 16,1 13,5 0,2 Sectors 21, 61, 76, 79 26, 33, 35, 43, 51, 56, 62, 67, 68, 73, 79, 96 2, 11, 21, 24,51, 53, 58, 61, 63, 64, 67, 68, 69, 72, 73,74, 75, 78, 81, 82, 89 35 Sectors,
RCA>1 none 62, 67 24,67, 68 none
Leading retreat
% 15,3 1,2 0,8 10,9
Sectors 71, 73, 75, 78, 81 23, 28 71 23, 25, 28, 56, 67,
68 Sectors,
RCA>1 78, 81 none none 23, 65, 67, 68
Lagging opportunity % 5,2 17,8 54,8 1,2 Sectors 3, 6, 7,12, 22, 28, 35, 43, 97 21, 22, 69, 74, 84 8, 23, 32, 33, 42, 56 24 Sectors, RCA>1 6, 12, 43, 97 69, 84 23, 32, 33, 56 24 Lost opportunity % 23,1 37,6 3,3 14,9 Sectors 0, 26, 32, 33, 42, 65, 84 5, 9, 24, 34, 65, 66, 71, 76, 77, 78, 81, 83 24 sectors 34, 93 Sectors, RCA>1 65, 84 5, 9, 65, 66, 78, 81 none 34
31 The export shares are calculated according to final year of each period (2010 and 2014). The Table 3.3 shows that the total export share of the sectors in rising star group in Turkey fell from 21.7% in the 2007-2010 period to 19.7% in the 2011-2014 period, whereas the export share of the sectors in lost opportunity group rose up to 37.6% from 23.1% for the same period. This means the export share of Turkey decreases in the sectors that experience an increase in the share of world trade.
A comparison of the 2007-2010 period with the 2011-2014 period shows that only the sectors numbered 1, 4, 8, 54, 55, 59, 85, 87, and 93 fall under the category of rising star in both the periods. It implies a lack of existing common sector for all the other classifications in both the analyzed periods.
In this sense, it is possible to say that the distribution of world trade and the export distribution in Turkey within the specified period do not change consistently. The 4th and 55th sectors are the only sectors having an RCA higher than one and falling under the rising star category in Turkey, within both periods.
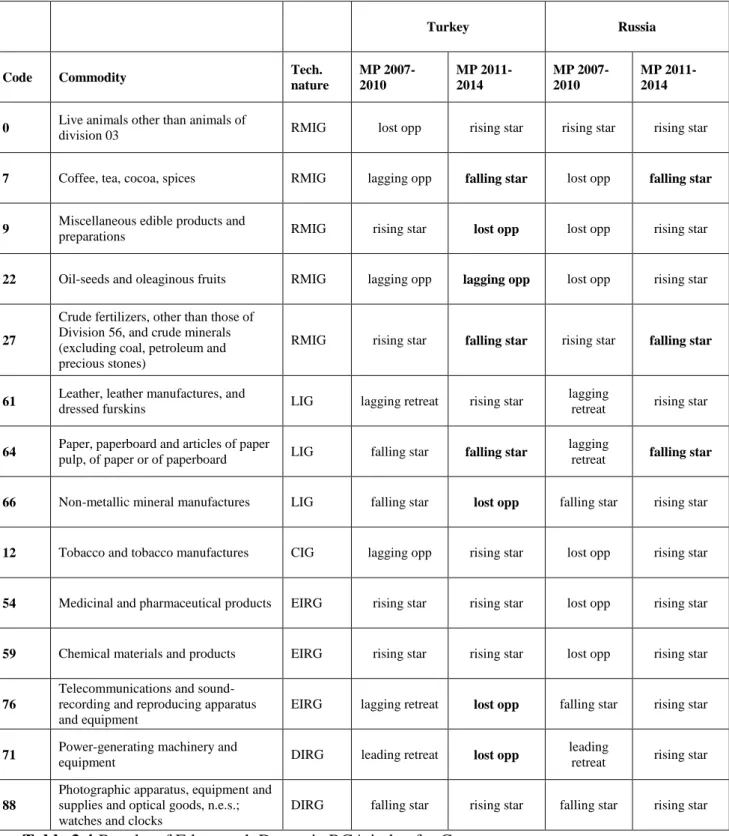
A total of eight Russian sectors—0, 3, 27, 34, 41, 52, and 93—fell under rising star category in the 2007-2010 period. However, 35 sectors fell under this category in the 2011-2014 period. Though the number of the sectors varied, the share of the sectors from rising star category in total export fell from 25.7% in the 2007-2010 period to 10.2% in the 2011-2014 period. Table 3.4 consists of data about the year 2014.
According to this table, the static RCA results calculated for the 14 common sectors, in which Russia and Turkey make quantitatively similar exports, are indicative of the fact that Turkey is more advantageous than Russia at both bilateral and global levels. Table 3.4 shows the analysis of dynamic RCA.
It is seen that Turkey has six sectors falling under the rising star category, whereas Russia has 11 sectors, out of the 14 common sectors analyzed for the 2011-2014 period. While Russia is more disadvantageous than Turkey in static terms, it has more sectors falling under rising star category in dynamic terms. This indicates the potential of Russia to get ahead in common sectors in due course of time.
32
Turkey Russia
Code Commodity Tech.
nature MP 2007-2010 MP 2011-2014 MP 2007-2010 MP 2011-2014
0 Live animals other than animals of
division 03 RMIG lost opp rising star rising star rising star
7 Coffee, tea, cocoa, spices RMIG lagging opp falling star lost opp falling star
9 Miscellaneous edible products and
preparations RMIG rising star lost opp lost opp rising star
22 Oil-seeds and oleaginous fruits RMIG lagging opp lagging opp lost opp rising star
27
Crude fertilizers, other than those of Division 56, and crude minerals (excluding coal, petroleum and precious stones)
RMIG rising star falling star rising star falling star
61 Leather, leather manufactures, and
dressed furskins LIG lagging retreat rising star
lagging
retreat rising star
64 Paper, paperboard and articles of paper
pulp, of paper or of paperboard LIG falling star falling star
lagging
retreat falling star
66 Non-metallic mineral manufactures LIG falling star lost opp falling star rising star
12 Tobacco and tobacco manufactures CIG lagging opp rising star lost opp rising star
54 Medicinal and pharmaceutical products EIRG rising star rising star lost opp rising star
59 Chemical materials and products EIRG rising star rising star lost opp rising star
76
Telecommunications and sound-recording and reproducing apparatus and equipment
EIRG lagging retreat lost opp falling star rising star
71 Power-generating machinery and
equipment DIRG leading retreat lost opp
leading
retreat rising star
88
Photographic apparatus, equipment and supplies and optical goods, n.e.s.; watches and clocks
DIRG falling star rising star falling star rising star
Table 3.4 Results of Edgeworth Dynamic RCA index for Common sectors
It is important for countries to sell a variety of products with high added value in order to become rich and raise welfare via foreign trade. A comparison of dynamic RCA results of the common sectors classified on the basis of technology level (RMIG, LIG, CIG, ERIG, DRIG) shows that the number of sectors falling under the rising star category, within five RMIG classifications, comes down to one for Turkey and three for Russia. In EIRG and DIRG
33 classifications, the number of sectors falling under the rising star category for five sectors totals to three for Turkey and five for Russia.
4. CONCLUSION
Liberalization of foreign trade and capital movements has increased the importance attached to the concept of competitiveness. This is because increasing competitiveness levels in international markets is considered to be one of the vital methods that are employed for raising welfare in both developed and developing countries.
An increase in value-added goods and services increases a country’s competitiveness, thereby increasing the welfare levels of that country. In other words, the key to raising welfare is to aim at complex production systems through innovative technology for increasing added value of a product. In this sense, the fact that Russia is in the rising star group in five common sectors, classified as DRIG and ERIG, which are assumed to comprise products with high added value, indicates that Russia might have a competitive advantage against Turkey in dynamic terms.
REFERENCES
Akgüngör S., Barbaros R.F., Kumral N. (2002), Competitiveness of the Turkish Fruit and Vegetable Processing Industry in the European Union Market Source: Russian & East European Finance and Trade, Vol. 38, No. 3 (May - Jun., 2002), pp. 34-53
Balassa, B. (1965), Trade Liberalization and Revealed Comparative Advantage, The Manchester School of Economic and Social Studies, 33,pp. 99-123.
Balassa B. (1982) Development Strategies in Semi-Industrialized Economies, Baltimore: John Hopkins University Press.
Balassa B. (1989), Comparative Advantage, Trade Policy and Economic Development, Harvester Wheatsheaf, New York.
Edwards S. (1993) “Openness, Trade Liberalization, and Growth in Developing Countries,” Journal of Economic Literature, Vol. 31, no 3,pp. 1358-93.
Edwards L. and W. Schoer (2002) “Measures of Competitiveness: A Dynamic Approach to South Africa‟s Trade Performance in the 1990s”, The South African Journal of Economics, 70(6),pp.1008-1046.
Erkan B. (2012), Determining With The Indices Of Revealed Comparative Advantage Of Countries’ Comparative Export Performances: A Case Study For Turkey And Syria. ZKU Journal of Social Sciences, Volume 8, Number 15,pp.197-202
Erkan B., Sarıçoban K. (2014), Comparative Analysis of the Competitiveness in the Export of Science-Based Goods Regarding Turkey and the EU+13 Countries, International Journal of Business and Social Science Vol. 5, No. 8(1);pp.117-130
Erlat G., Erlat H. (2005), Do Turkish Exports Have Comparative Advantage With Respect To The European Union Market, 1990-2000 Topics in Middle Eastern and North African Economies, electronic journal, Volume 7,pp.1-19
Ekmen-Özçelik S., Erlat G., (2013) Turkey’s Comparative Advantages and Dynamic Market Positioning in the EU market An Analysis by Extensive and Intensive Margins, Topics in Middle E astern and African Economies Vol. 15, No. 2,186-211
34 Ferman, M., Akgüngör S., Yüksel A.H. (2004), “Türkiye’nin İhracat Rekabet Gücü ve Sürdürülebilirliği: Avrupa Birliği Pazarında Rakip Ülkeler ve Türkiye Açısından Bir Karşılaştırma”, 2004 Türkiye İktisat Kongresi, İzmir, pp.4-29
Greenaway D., Milner C. (1986), The Economics of Intra-Industry Trade, Basil Blackwell Ltd., UK, Basil Blackwell Inc., USA.
Greenaway, D. and C. Milner (1993), Trade and Industrial Policy in Developing Countries: A Manual of Policy Analysis, The Macmillan Press, esp. Part IV Evaluating Comparative Advantage,pp.181-208.
Grossman G.M., Helpman E.(1991), “Trade, Knowledge Spillowers and Growth”, European Economic Review, Vol: 35, 1991;pp.517-526.
Gül E., Kamaci A. (2012) Effects of International Trade on Growth: A Panel Data Analyses. International Journal of Alanya Faculty of Business. 2012, Vol:4, No:3, pp.81-91 Hufbauer, C.G., Chilas J.C. (1974) Specialization by Industrial Countries: Extent and Consequences” in H. Giersch (ed.): The International Division of Labour: Problems and Perspectives. International Symposium. Tubingen, Germany: J.C.B. Mohr,pp. 3-38.
Ishchukova N., Smutka L. (2013), Revealed Comparative Advantage Of Russian Agricultural Exports, Acta Universitatis Agriculturae et Silviculturae Mendelianae Brunensis, 2013, LXI, No. 4, pp. 941–952.
İnce, M., Demir H.M. (2007), Comparative Advantage and Competitiveness: The Case of Turkey and Germany”, Review of Social, Economic and Business Studies, 5/6, 2007, pp. 149-171.
Kösekahyaoğlu L., Özdamar G. (2011), Türkiye, Çin Ve Hindistan’in Sektörel Rekabet Gücü Üzerine Karşilaştirmali Bir İnceleme, Uludağ Üniversitesi İktisadi ve İdari Bilimler Fakültesi Dergisi Uludağ Journal of Economy and Society Cilt/Vol. XXX, Sayı/No. 2, 2011, pp. 29-49
Liesner H.H. (1958), “The European Common Market and British Industry”, Economic Journal, 68,pp.302-316.
Raghuramapatruni R. (2015) Revealed Comparative Advantage and Competitiveness: A Study on BRICS Arabian Journal of Business and Management Review 2015, 5:5,pp.1-7 Özdamar G., Albeni M. (2011), A Research On The Foreign Trade Competitiveness Of Automotive Industry Of Turkey, Journal of Süleyman Demirel University Institute of Social Sciences Vol.(1),No:3,pp.193-216
Schwab K. The World Competitiveness Report 2015-2016.pp.17
Serin V., Civan A. (2008), Revealed Comparative Advantage and Competitiveness. A Case Study for Turkey towards the EU Competitiveness of Turkish Fruit and Vegetable Sectors in EU Market. Journal of Economic and Social Research 10(2) 2008,pp. 25-41
Simsek N., Seymen D., Utkulu U. (2010) Turkey’s Competitiveness In The Eu Market: A Comparison Of Different Trade Measures,Dokuz Eylül Üniversitesi Sosyal Bilimler Enstitüsü Dergisi,, Vol.12,No:2,pp.107-139
Utkulu U., Seymen D. (2004), Revealed Comparative Advantage and Competitiveness. Evidence for Turkey vis-à-vis EU/15. presented at the European Trade Study Group 6th Annual Conference, ETSG 2004, Nottingham, September ,pp.1-26
35 Tabata S. (2006)., Observations on Changes in Russia's Comparative Advantage, 1994-2005, Eurasian Geography and Economics, 47:6, 2006, pp. 747-759
Vollrath, T.L. (1991), A Theoretical Evaluation of Alternative Trade Intensity Measures of Revealed Comparative Advantage”, Weltwirtschaftliches Archiv, 130, pp.265-279
Westin P. (1998) Comparative Advantage and Characteristics of Russia's Trade with the European Union, Bank of Finland, Institute for Economies in Transition, Review of Economies in Transition 2/98,pp.1-33
Yılmaz B. (2002), “Turkey‟s Competitiveness in the European Union. A Comparison of Greece, Portugal, Spain and the EU/12/15”, Russian and East European Finance and Trade, 38(3), pp.54-72.
Yılmaz B., (2003) “Turkey’s Competitiveness in the European Union: A Comparison with Five Candidate Countries – Bulgaria, The Czech Republic, Hungary, Poland, Romania – and the EU15”, Ezoneplus Working Paper, No.12,pp.1-20
Yılmaz B., Ergun S.J. (2003), “The Foreign Trade Pattern and Foreign Trade Specialization of Candidates of the European Union”, Ezoneplus Working Paper, No.19,pp.1-30
World Competitiveness Report 2015 [http://reports.weforum.org/global-competitiveness-report-2015-2016/, accessed 18.05.2016
APPENDIX
The abbreviators used in this paper:
RCA – Revealed Comparative Advantage index, export based (Balassa) CEP – Comparative Export Performance
TO – Trade overlap ES – export similarity
ESI – Export specialization index NEI – Net Export Index (Balassa) ITO – index of trade openness
TCA - technological comparative advantage
RMA - import index of revealed comparative advantage RTA - revealed trade advantage
RSCA - revealed symmetric comparative advantage RMIG – row material intensive goods,
LIG – labor intensive goods, CIG – capital intensive goods,
ERIG – Easy-to-Imitate Research-Intensive Goods, DRIG – Difficult-to-Imitate Research-Intensive Goods Raw Material Intensive Goods
36 SITC 0 Food and Live Animals
SITC 2 Crude Material, Inedible, Except Fuels (excluding 26)
SITC 3 Mineral Fuels, Lubricants and Related Materials (excluding 35) SITC 4 Animal and Vegetable Oils, Fats and Waxes
SITC 56 Fertilizers (Other Than Those of Group 272) Labour-Intensive Goods
SITC 26 Textile Fibres (Other Than Wool Tops and Other Combed Wool) and Their Wastes (Not Manufactured Into Yarn or Fabric)
SITC 6 Manufactured Goods Classified Chiefly by Material (excluding 62, 67, 68) SITC 8 Miscellaneous Manufactured Articles (excluding 88, 87)
Capital-Intensive Goods SITC 1 Beverages and Tobacco SITC 35 Electric Current
SITC 53 Dyeing, Tanning and Colouring Materials
SITC 55 Essential Oils and Resinoids and Perfume Materials; Toilet, Polishing and Cleansing Preparations
SITC 62 Rubber Manufactures, n.e.s. SITC 67 Iron and Steel
SITC 68 Non-Ferrous Metals
SITC 78 Road Vehicles (Including Air-Cushion Vehicles) Easy-to-Imitate Research-Intensive Goods
SITC 51 Organic Chemicals SITC 52 Inorganic Chemicals
SITC 54 Medicinal and Pharmaceutical Products SITC 58 Plastics in Non-Primary Forms
SITC 59 Chemical Materials and Products, n.e.s.
SITC 75 Office Machines and Automatic Data-Processing Machines
SITC 76 Telecommunications and Sound-Recording and Reproducing Apparatus and Equipment
Difficult-to-Imitate Research-Intensive Goods SITC 57 Plastics in Primary Forms
SITC 7 Machinery and Transport Equipment (excluding 75, 76, 78)
SITC 87 Professional, Scientific and Controlling Instruments and Apparatus, n.e.s.
SITC 88 Photographic Apparatus, Equipment and Supplies and Optical Goods, n.e.s.; Watches and Clocks
37
0 - Food and live animals
o 00 - Live animals other than animals of division 03
o 01 - Meat and meat preparations
o 02 - Dairy products and birds’ eggs
o 03 - Fish (not marine mammals), crustaceans, molluscs and aquatic invertebrates, and preparations thereof
o 04 - Cereals and cereal preparations
o 05 - Vegetables and fruit
o 06 - Sugars, sugar preparations and honey
o 07 - Coffee, tea, cocoa, spices, and manufactures thereof
o 08 - Feeding stuff for animals (not including unmilled cereals)
o 09 - Miscellaneous edible products and preparations
1 - Beverages and tobacco
o 11 - Beverages
o 12 - Tobacco and tobacco manufactures
2 - Crude materials, inedible, except fuels
o 21 - Hides, skins and furskins, raw
o 22 - Oil-seeds and oleaginous fruits
o 23 - Crude rubber (including synthetic and reclaimed)
o 24 - Cork and wood
o 25 - Pulp and waste paper
o 26 - Textile fibres (other than wool tops and other combed wool) and their wastes (not manufactured into yarn or fabric)
o 27 - Crude fertilizers, other than those of Division 56, and crude minerals (excluding coal, petroleum and precious stones)
o 28 - Metalliferous ores and metal scrap
o 29 - Crude animal and vegetable materials, n.e.s.
3 - Mineral fuels, lubricants and related materials
o 32 - Coal, coke and briquettes
o 33 - Petroleum, petroleum products and related materials
o 34 - Gas, natural and manufactured
o 35 - Electric current
4 - Animal and vegetable oils, fats and waxes
o 41 - Animal oils and fats
o 42 - Fixed vegetable fats and oils, crude, refined or fractionated
o 43 - Animal or vegetable fats and oils, processed; waxes of animal or vegetable origin; inedible mixtures or preparations of animal or vegetable fats or oils, n.e.s.
5 - Chemicals and related products, n.e.s.
o 51 - Organic chemicals
o 52 - Inorganic chemicals
o 53 - Dyeing, tanning and colouring materials
o 54 - Medicinal and pharmaceutical products
o 55 - Essential oils and resinoids and perfume materials; toilet, polishing and cleansing preparations
o 56 - Fertilizers (other than those of group 272)
o 57 - Plastics in primary forms
o 58 - Plastics in non-primary forms
o 59 - Chemical materials and products, n.e.s.
38
o 61 - Leather, leather manufactures, n.e.s., and dressed furskins
o 62 - Rubber manufactures, n.e.s.
o 63 - Cork and wood manufactures (excluding furniture)
o 64 - Paper, paperboard and articles of paper pulp, of paper or of paperboard
o 65 - Textile yarn, fabrics, made-up articles, n.e.s., and related products
o 66 - Non-metallic mineral manufactures, n.e.s.
o 67 - Iron and steel
o 68 - Non-ferrous metals
o 69 - Manufactures of metals, n.e.s.
7 - Machinery and transport equipment
o 71 - Power-generating machinery and equipment
o 72 - Machinery specialized for particular industries
o 73 - Metalworking machinery
o 74 - General industrial machinery and equipment, n.e.s., and machine parts, n.e.s.
o 75 - Office machines and automatic data-processing machines
o 76 - Telecommunications and sound-recording and reproducing apparatus and equipment
o 77 - Electrical machinery, apparatus and appliances, n.e.s., and electrical parts thereof (including non-electrical counterparts, n.e.s., of electrical household-type equipment)
o 78 - Road vehicles (including air-cushion vehicles)
o 79 - Other transport equipment
8 - Miscellaneous manufactured articles
o 81 - Prefabricated buildings; sanitary, plumbing, heating and lighting fixtures and fittings
o 82 - Furniture and parts thereof; bedding, mattresses, mattress supports, cushions and similar stuffed furnishings
o 83 - Travel goods, handbags and similar containers
o 84 - Articles of apparel and clothing accessories
o 85 - Footwear
o 87 - Professional, scientific and controlling instruments and apparatus, n.e.s.
o 88 - Photographic apparatus, equipment and supplies and optical goods, n.e.s.; watches and clocks
o 89 - Miscellaneous manufactured articles, n.e.s.
9 - Commodities and transactions not classified elsewhere in the SITC
o 91 - Postal packages not classified according to kind
o 93 - Special transactions and commodities not classified according to kind
o 96 - Coin (other than gold coin), not being legal tender