MARIA MELODY GARCIA
GIOVANNI TROVATO
Credit Rationing and Credit View: Empirical
Evidence from an Ethical Bank in Italy
Attempts have been made in the empirical literature to identify credit ra-tioning and its determinants using balance sheet data or evidence from corporate surveys. However, observational equivalence, identification prob-lems, and interview biases are serious problems in these studies. We analyze directly the determinants of credit rationing in credit files by examining the difference between the amounts demanded by and supplied to each borrower, as shown by official bank records. Our findings provide microeconomic evi-dence that supports the credit view hypothesis by showing that the European Central Bank refinancing rate is significantly and positively related to partial (but not total) credit rationing. This finding is consistent with the hypothesis that this variable affects the total volume of bank loans.
JELcodes: E51, G21 Keywords: credit rationing, credit view, loan data.
THE DRIVERS OFcredit rationing and the validity of the credit view—that central bank policy rates affect the supply of bank loans—are important factors for study because credit constraints or lower aggregate loan volumes can curb firms’ investment plans. As firms often do not have sufficient internal resources to finance their own production entirely, credit rationing can have a serious effect on their success. On the aggregate level, this can result in lower overall economic growth.
The influence of central bank policy decisions on credit availability and the factors affecting the rationing decisions of lending intermediaries are controversial issues in the economic literature.
LEONARDOBECCHETTIis a Professor in the Department of Economics and Institutions,
Univer-sity of Rome(E-mail:leonardo.becchetti@uniroma2.it). MARIAMELODYGARCIAis a Researcher in German Development Institute(E-mail:melody.garcia@die-gdi.de). GIOVANNITROVATOis a Researcher in the Department of Economics and Institutions, University of Rome(E-mail:
trvgnn00@uniroma2.it).
Received October 22, 2008; and accepted in revised form January 10, 2011.
Journal of Money, Credit and Banking,Vol. 43, No. 6 (September 2011)
C
first is stickiness of loan rates (or bank credit margins) with respect to changes in base rates. A major contribution on this subject was made by Berger and Udell (1992), who, using a sample of more than one million individual loans in the United States between 1977 and 1988, find that bank margins are sticky with respect to shifts in nominal treasury rates. The slow adjustment they observe is consistent with that found in earlier studies by Goldfeld (1966), Jaffee (1971), and Slovin and Sushka (1983).
The second signal is that borrowers tend to switch to alternative sources of financing that are more expensive than the primary source (which is therefore assumed to be rationed). Sofianos, Wachtel, and Melnik (1990) find evidence that loan quantities, when free of commitment,1 react to monetary policy and regard this response as a signal that quantity rationing is occurring.
Berger and Udell (1992) also find that in the presence of credit rationing the proportion of loans used under commitment (not discretionary for the lender) falls by 1% when nominal rates of interest double.2 This is contrary to the expectation that, in the presence of credit rationing, lenders would cut discretionary lending during credit crunches. Petersen and Rajan (1995) and Harhoff and K¨orting (1998) use another specific property of loan contracts as a proxy for credit rationing: fast payment discounts that a firm takes as a proportion of the total available. Firms that do not exploit opportunities for fast payment discounts de factoswitch to a more expensive source of lending and are viewed as rationed with regard to their primary lender (a bank).
If the credit rationing theory looks at the problem of availability of credit at micro level, the credit view looks at it from an aggregate point of view and seeks to identify “a set of factors that amplify and propagate conventional interest rate effects” (Bernanke and Gertler 1995, p. 28).3The main difference between the credit view and the standard IS–LM “money view” is that the former holds that adjustment in the presence of changes in monetary policies occurs not only on the money demand (and bond demand) side, but also through a restriction of credit (the credit supply side).
There are several possible reasons that this occurs. First, the standard Stiglitz–Weiss (1981) adverse selection and moral hazard rationale may apply, and banks may become more reluctant to satisfy borrowers’ demands in order to avoid an increase in loan risk. Second, credit tightening may be related to a balance sheet effect (Bernanke and Blinder 1992): higher interest rates worsen the financial position of leveraged firms by increasing the cost of their preexisting (flexible interest rate)
1. Loans under commitment in the United States protect borrowers against credit rationing in the short run, albeit at considerable cost, because they include a clause that allows the borrower to obtain additional credit (without further review) at the current loan rate. The increase in volume of such loans in general, and especially when credit conditions get tighter, is regarded as reflecting a desire to avoid quantity rationing of the cheaper credit source (loans not under commitment).
2. Using an empirical approach similar to that of Berger and Udell (1992) but with original information on borrower risk, Cowling (2010) finds that a UK government loan guarantee scheme alleviates credit rationing.
3. Evidence in favor of the credit view is provided by Bernanke and Blinder (1992), Anari et al. (2002), and Suzuki (2004).
debt and reducing the net present value of their (collateralizable) assets. Third, if credit tightening narrows the gap between the loan and refinancing rate (or between the loan and government bond rates), bank lending activity becomes less rewarding. Fourth, monetary tightening may cause a contraction in capital adequacy ratios, thereby, inducing banks to reduce lending.
The difference between the first and second rationales above is subtle. Banks may ration either because they are afraid of selecting intrinsically riskier projects in the presence of higher loan rates or because they realize that the worsening of the balance sheet position makes investors more prone to take risks, irrespective of the intrinsic risk of their projects.
However, in the credit rationing and credit view literature, the testing of hypotheses is often compromised by problems of observational equivalence, identification prob-lems, and interview bias.4 Researchers tend to encounter such problems when con-ducting standard balance sheet- and/or survey-based empirical analyses. By contrast, the most relevant empirical analyses of credit rationing directly examine the behavior of banks and do not rely on the theoretical assumptions in the cash flow/investment literature (for a review of critical issues in this approach, see Schiantarelli 1995).
Furthermore, most empirical studies of the credit view consider aggregate evidence for the significance of the relationship between loan volumes and central bank policy rates. Two typical problems affecting such analyses of aggregate data are identifica-tion and the direcidentifica-tion of causality. By outlining a “supply versus demand puzzle,” Bernanke (1993) correctly points out that when we observe a significant negative relationship between policy rate and volume of loans, we cannot distinguish whether the change in the equilibrium volume of loans disbursed by the banking system results from a demand or supply effect (see also Suzuki 2004).
In the present study, we seek to overcome these problems by using direct evidence from official bank records of individual loan levels. These data indicate (i) whether borrowers received an amount of credit lower than that requested at a given lending rate or (ii) whether borrowers were refused credit entirely. Obtaining loan data with credit rationing information directly from official bank records allows us to measure credit rationing on the supply side by focusing on the difference between the amount requested and that financed by the bank. Hence, if we find evidence of a significant relationship between policy rates and rationing decisions, we defuse a typical objec-tion to the credit view: namely, that the financial system is passive and only responds to investors’ demand.
4. The three major sources of such bias are the interviewer (prejudices or desire to ask leading questions), the respondent (who may lie or evade questions), and the actual physical, and social setting of the interview. An example of the second is the Hawthorne Effect (Landsberger 1958) or the biases in measuring willingness to pay for public goods, as surveyed by Carson and Mitchell (1989) and Diamond and Hausman (1994). An example of the third source is in papers (such as that of Schwarz and Clore 1983) on the effect of weather conditions in life satisfaction inquiries. In empirical papers on credit rationing based on survey data, researchers rely on respondents’ answers about partial and credit rationing, using as a check the dynamics of some balance sheet data (investment, cash flow). Such answers are therefore subject to interview bias.
financing instruments, which is a crucial hypothesis of the credit view. As shown in the following sections, this is especially true in our sample, which mainly includes as borrowers small firms and cooperatives, nonprofit firms, and associations that may find it difficult to receive alternative financing instruments on the financial markets. This characteristic adds further interest to our study, because to our knowledge there are no empirical studies on the credit view and credit rationing that focus on bank lending to such firms. More specifically, the bank whose data we use in the study, Banca Etica, is a multistakeholder-oriented, nonprofit-maximizing bank.5The choice of Banca Popolare Etica gives generality to our results in the relatively under-researched field of behavior among nonprofit-maximizing financial institutions.
The next section of the present paper, Section 1, illustrates characteristics and relevance of nonprofit-maximizing banks and provides a simple theoretical argument showing that in general, although such banks pursue different goals from those of commercial banks, they exhibit very similar behavior in terms of credit rationing and attitude toward project risk. Section 2 then illustrates and comments on the descriptive findings. Section 3 presents the econometric findings and analyzes in detail the effects of borrower type, credit type characteristics, and macroeconomic variables on credit rationing. Section 4 presents conclusions.
1. CHARACTERISTICS AND RELEVANCE OF NONPROFIT-MAXIMIZING BANKS
Nonprofit-maximizing banks play a substantial role in financial systems. In the Italian banking industry, they account for market shares of 33.7% of deposits and 29.5% of loan volumes. In terms of branches, they represent 60% of the total in France, 50% in Austria, and about 40% in Germany, and the Netherlands. In 2007, EU cooperative banks held an average market share of 25% in terms of loans to small and medium enterprises (SMEs), while an average of 29% of their loans were issued to SMEs (Bongini and Ferri 2007).
At the global level, financial cooperatives serve more than 621 million people in the G-20 nations alone, “provide US$3.6 trillion in loans, hold US$4.4 trillion in savings, and have US$7.6 trillion in total assets.”6The highest ranking cooperative bank in terms of shareholder equity among the top 50 in 2008 was Cr´edit Agricole,
5. The bank declares that it adopts the following principles of ethical finance: (i) ethically oriented finance shows awareness of the noneconomic consequences of economic actions; (ii) access to finance, in all its forms, is a human right; (iii) efficiency and prudence are components of ethical responsibility; (iv) profit produced by the ownership and exchange of money must derive from activities oriented toward the common good and must be equally distributed among all those that contribute to its realization; (v) the maximum transparency of all operations is one of the main conditions of all ethical finance activities; (vi) the active involvement of shareholders and savers in the company’s decision-making process must be encouraged; and (vii) every organization that accepts and adheres to the principles of ethical finance undertakes to ground its entire activity on such principles.
which ranked seventh, with other cooperative banks in positions ranging from 20th to 40th, among them Rabobank, Caisse d’Epargne, Banque Populaire, and Cr´edit Mutuel. As emphasized by Canning, Spencer, and Jefferson (2003), even international institutions, such as the World Bank and the International Monetary Fund can be included in this group because in practice they act as nonprofit-maximizing financial institutions.
Interest in nonprofit-maximizing banks among academics, policymakers, and read-ers has increased since the beginning of the global financial crisis, during which the specific characteristics of banks of this kind seemed to provide a degree of protection against the effects of the crisis in Italy and many other countries.7
The nonprofit-maximzing bank object of our inquiry, Banca Popolare Etica, is a banca popolare, and its statutes share the principles of the International Cooperative Bank Association (ICBA).8The ICBA includes among its membersbanche cooper-ativeandbanche popolariin Italy, building societies and credit unions in the United Kingdom, and mutual savings and loans and credit unions in the United States. In the section which follows we argue that, although nonprofit-maximizing banks differ from commercial banks in terms of their goals, they exhibit the same behavior in relation to credit rationing and attitude toward project risk, in terms of the proportion of admissible loans that fulfill minimum socio-environmental criteria.9
1.2 Nonprofit-Maximizing Banks and Credit Rationing
The main aim of commercial banks is to maximize profits. By contrast, nonprofit-maximizing banks aim to maximize the volume of performing loans that pass a socioenvironmental threshold (see also Canning, Spencer, and Jefferson 2003 on this point). However, nonprofit-maximizing banks are subject to the same capital adequacy constraints as commercial banks. Given the compulsory requirement for a bank to increase its reserves whenever a new nonperforming loan position emerges, the common rule of such constraints (in the United States and Europe) is the definition of the ratio between reserves plus equity capital and the volume of loans:
7. The ICBA (March 9, 2009) declared: “In this financial crisis, the cooperative banking business model, relying on democratic governance, member participation, proximity, and the satisfaction of its members and clients interests, showed its benefits as a factor of stability and financial security for millions of people. Indeed, cooperative banks have a long-term view and do not rely on the financial market to raise their capital: Their first aim is not to maximize profit for the benefit of their share-holders but to provide the best possible products and services to their members. The recent financial crisis proves that the cooperative banking business model is, more than ever, appropriate and relevant” (http://icba.free.fr/IMG/pdf/G_20_MARCH_09.pdf, accessed April 30, 2009).
8. According to theInternational Cooperative Alliance Statement of Cooperative Identity, a cooperative is “an autonomous association of persons united voluntarily to meet their common economic, social, and cultural needs and aspirations through a jointly owned and democratically controlled enterprise. Cooperatives are based on the values of self-help, self-responsibility, democracy, equality, equity, and solidarity. In the tradition of their founders, cooperative members believe in the ethical values of honesty, openness, social responsibility, and caring for others.”
9. The theoretical argument we present here is in contrast to that of Canning, Spencer, and Jeffer-son (2003), who propose that nonprofit-maximizing banks introduce credit rationing to correct for the distortionary effect of subsidies.
+
Z ≥X ,
whereRs are reserves,Eis equity,Z is the total number of financed loans, andXis the policy ratio fixed by regulators.
We assume here that this constraint is binding, because by maximizing credit volumes, nonprofit-maximizing banks find sufficient admissible loans and satisfy the constraint with equality; in the short run, they cannot relax this constraint with equity issues. Their attitude toward risk will therefore be the same as that of commercial banks for three reasons.
First, although it involves diminishing returns, the benefit of risk is that, as in the Stiglitz–Weiss (1981) model, bank profits may be conveniently assumed to be concave in loan risk. Second, profits are accumulated into reserves and may slacken the capital adequacy constraint, thereby allowing NPM banks to increase credit volumes (their goal). Third, the drawback of greater risk is that it may increase the volume of nonperforming loans, leading in turn to an increase in reserves required with negative effects on the capital requirement ratio (and therefore on the maximum volume of loans that can be supplied).
To summarize, commercial banks may ration credit and fix a nonmarket-clearing lending rate that creates excess demand for loans because they know that a higher interest rate could create a moral hazard and adverse selection, thereby increasing risk and leading to nonmaximum profit (because bank profits do not monotonically increase with risk). The behavior of nonprofit-maximizing banks is observationally equivalent (nonmarket-clearing interest rates and credit rationing to avoid taking excessive risk) because the variable that they maximize (i.e., the volume of loans, thus creating economic, social, and environmental value) also increases nonmonotonically in project risk. This depends on the effects of risk on the capital adequacy constraint, as explained earlier.10In the empirical sections which follow we will evaluate whether, consistently with these theoretical considerations, and under which circumstances nonprofit-maximizing banks ration credit.
2. DESCRIPTIVE FINDINGS
Our data set is taken from the body of loans disbursed to nonindividual borrowers by Banca Etica from 1999 (when it was founded) to July 2006. The available data include information on individual credit files and borrower characteristics from the bank’s official records. To this information we have added data on relevant macroe-conomic and financial variables taken from ISTAT (the Italian national statistics institute), the OECD, and the Bank of Italy. We therefore omit these variables from
10. Although this theoretical argument is much more general, we show its application to a specific theoretical framework using an adverse selection case in the Stiglitz–Weiss (1981) model. The analytical results are available upon request on the authors’ websites.
our estimates. Descriptions and definitions of the variables are provided in Tables 1 and 2, respectively; Table 3 gives their summary statistics.
The first relevant finding of our analysis is that 20.42% of 1,009 positions are subject to partial credit rationing (i.e., the amount disbursed is below that requested by the borrower) and 15.36% to total credit rationing (the bank denies credit to the borrower) (Table 4). Total credit rationing in our sample refers to those borrowers with a credit file at the bank (who have therefore passed the first stage of a loan application at the branch level) but have not yet obtained final approval at the board level. Borrowers rejected at the branch level are not included in the sample. Of further note is that what we call “partial credit rationing” is akin to but not identical to De Meza and Webb’s (2006) well-known definition of Type I credit rationing: “At the ruling interest rate, borrowers may prefer larger loans than that offered by banks, although everyone willing to pay the market interest rate obtains some finance.” Given that our sample comprises both partial and total credit rationing, the second part of their definition does not apply. Similarly, our “total credit rationing” is akin to but not identical to Stiglitz and Weiss’s (1981) definition of Type II credit rationing: “Some applicants may be refused loans altogether, despite being willing to pay an interest rate above that charged to identical but fully funded borrowers.” The difference in our study is that total credit rationing is affected by individual company characteristics, with the consequence that borrowers cannot be considered identical.
With regard to credit performance,sofferenze11represent only 0.2% of total credit positions (11 cases) andincagli account for an additional 0.59%. Although many loans are still outstanding, the result is interesting because the average proportion of nonperforming loans in the Italian banking system was approximately 4% in the same period, and Banca Etica’s share of uncollateralized loans is much higher than the average. One of the main reasons for this is that most borrowers belong to second-level organizations (consorzi). A long-term relationship between aconsorziand a bank generates an implicit commitment by the former to intervene if the credit risk of one of its members increases, althoughconsorzido not provide any formal guarantee for the borrower. In a sense, this mechanism is a special case of relationship lending that gives Banca Etica the advantages of secured loans without incurring the cost of pledging collateral.
With regard to borrower characteristics, 79% of borrowers in our sample are microfirms (firms with fewer than 15 employees), 17% are small firms (from 16 to 50 employees), and only 3.7% are medium or large firms (more than 50 employees). If we consider borrower types, 43.5% are cooperatives (28.2% are social cooperatives and 15.3% traditional worker and consumer cooperatives or consortia) and 46.6% are
11. According to Italian financial regulations, a loan is classified as: (i)sofferenzawhen a formal restructuring process or bankruptcy procedure has been started and (ii)incaglioif no repayment (interest and/or principal) has been made for 180 days. Application of the Basel II rules in Italy by Bank of Italy establishes that a loan is under default if it is anincaglioor asofferenza. Capital adequacy ratios are therefore calculated on the basis of this definition. A third classification of lower risk (sotto osservazione) is based on a discretionary evaluation by the bank; it is applied when the credit position is considered risky, with possible evolution to the two abovementioned default states.
TABLE 1
DESCRIPTIONS ANDCONSTITUENTS OFVARIABLECATEGORIES
Definitions
Cooperatives
Cooperatives differ from traditional for-profit firms in their goal ofprevalente mutualit`a. This means that, unlike for-profit firms, cooperatives create benefitsnot under the prevailing form of profitsfor some of their stakeholders. The two main types of traditional cooperative areworker cooperatives(where workers are the dominant stakeholders and receive benefits in the form of safer working conditions and/or profits) andconsumer cooperatives(where consumers are the dominant stakeholders and receive benefits in the form of lower prices and higher-quality goods). In exchange for a preferential tax regime for cooperatives, Italian law establishes that the payout from equity of cooperative members must be lower than that from short-term bonds.
Social cooperatives
Unlike traditional worker or consumer cooperatives, social cooperatives pursue the goal of providing a social service to beneficiaries other than their shareholders. According to Italian Law 381/1991, the goals of social cooperatives are social integration, community well-being, and general promotion of human welfare. There are two types of social cooperative: type A social cooperatives deliver health and education services, and type B social cooperatives operate in industry, agriculture, trade, or services with the goal of including “disadvantaged” workers (people with disabilities, former prisoners), who must make up at least 30% of the workforce.
Consortia
The distinguishing feature of a consortium or “second-level cooperative” is that its shareholders are not individuals but cooperatives. Consortia are generally created by cooperatives to achieve the economies of scale necessary to develop efficient services for all members.
Associations
Associations are formally organized private nonprofit organizations. Their field of action covers sport, environment, art, leisure, and professional life. Nonrecognized associations have a more flexible structure (they do not have to report detailed balance sheet data) but with some restrictions (they cannot inherit sums of money, etc.) compared with recognized ones.
Onlus
ONLUS are a special kind of association whose mission is to help people in need. They are regulated by Law 460/1997. Their most important characteristic is the preferential fiscal treatment (tax deductions and allowances) granted to those furnishing them with financial resources.
Cosigning agreements
By means of cosigning agreements, the bank guarantees to a third party (usually the government) that the NGO that benefits from specific government financing will use the money for the goal stated in the agreement. If this is not the case, the bank must repay the entire sum to the government. Cosigning agreements may or may not be covered by real and personal guarantees.
Constituents of variable types
Industry affiliation
Nonprofit, health services, recreation, other, agriculture, retail, high-tech. Financial services are the default omitted variable.
Borrower’s legal status
Associations with legal personality, associations without legal personality, individual firms, religious entities, social cooperatives, limited liability companies, nonprofit organizations. Consumer and worker cooperatives are the default omitted variable.
Credit position, type of borrower action
Advances on receivables, purchase/restructuring of tangible assets, advances on contracts/projects, liquidity needs, cosigning on projects, advances on subsidies. Capital investment is the default omitted variable.
Credit position, sector of operation
International cooperation, domestic health and social welfare services, domestic cultural services, workers’ recreation activities. Bio (or organic produce) is the default omitted variable. Note that the credit sector of operation does not necessarily coincide with the borrower’s main sector of activity.
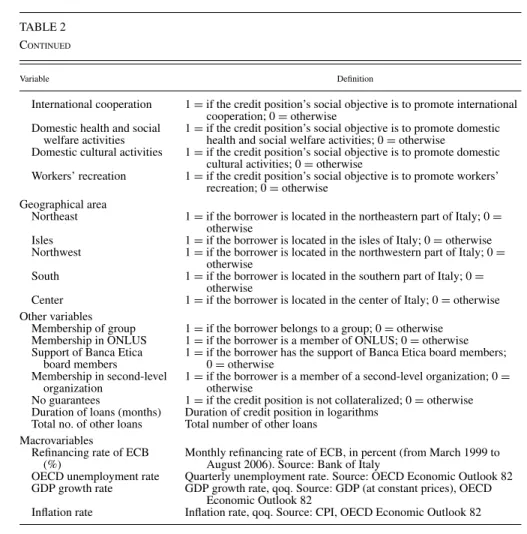
TABLE 2
DEFINITIONS OFVARIABLES
Variable Definition
Not rationed 1=if amount of credit requested is fully granted; 0=otherwise
Partial rationing 1=if amount of credit requested is partially granted; 0=otherwise Total rationing 1=if amount of credit requested is completely refused; 0=otherwise Rationed type (for 0=if not rationed; 1=if partially rationed; 2=if totally rationed
multinomial logit)
Bad credit position 1=if credit position is underincaglio,sofferenzaorsotto osservazione (see footnote 12); 0=otherwise Firm size
Large firms 1=if number of employees is>50; 0=otherwise
Small firms 1=if number of employees is>15 and≤50; 0=otherwise
Microfirms 1=if number of employees is<15; 0=otherwise
Borrower’s industry
Financial services 1=if the borrower belongs to the financial services industry; 0= otherwise
Nonprofit 1=if the borrower belongs to the nonprofit sector; 0=otherwise
Health services 1=if the borrower belongs to the health industry; 0=otherwise
Recreation 1=if the borrower belongs to the recreation industry; 0=otherwise
Other 1=if the borrower belongs to another type of productive services
industry; 0=otherwise
Agriculture 1=if the borrower belongs to the agriculture industry; 0=otherwise
Retail 1=if the borrower belongs to the retail industry; 0=otherwise
High-tech 1=if the borrower belongs to the high-tech industry; 0=otherwise
Borrower’s legal status Consumer or worker
cooperative
1=if the borrower is a consumer or worker cooperative; 0= otherwise
Association without legal status
1=if the borrower belongs to an association without legal status; 0= otherwise
Association with legal status 1=if the borrower belongs to an association with legal status; 0= otherwise
ONLUS association 1=if the borrower belongs to an ONLUS association; 0=otherwise Social cooperative 1=if the borrower is a social cooperative; 0=otherwise
Limited liability company 1=if the borrower is a limited liability company; 0=otherwise
Other 1=if the borrower is from another type of association; 0=otherwise
Credit position, type of borrower action
Capital investment 1=if the credit position is for financing capital investment or other nonhuman productive inputs; 0=otherwise
Advances on receivables 1=if the credit position is for advances on receivables; 0=otherwise Purchase/restructuring of
tangible assets
1=if the credit position is for purchasing or restructuring of tangible assets; 0=otherwise
Advances on contracts/ projects
1=if the credit position is for advances on contracts or projects; 0= otherwise
Liquidity needs 1=if the credit position is for liquidity needs; 0=otherwise Cosigning on projects 1=if the credit position is for cosigning on projects; 0=otherwise Advances on subsidies 1=if the credit position is for advanced payment on subsidies; 0=
otherwise Credit position type
Advances on documents/
contracts 1=if the credit position is classified under advances on documents orcontracts; 0=otherwise Credit lines 1=if the credit position is classified under credit lines; 0=otherwise Bank cosigning (credito di
firma)
1=if the credit position is classified under bank cosigning; 0= otherwise
Credit position, sector of operation
Bio 1=if the credit position’s social objective is to promote biological
products; 0=otherwise
TABLE 2 CONTINUED
Variable Definition
International cooperation 1=if the credit position’s social objective is to promote international cooperation; 0=otherwise
Domestic health and social welfare activities
1=if the credit position’s social objective is to promote domestic health and social welfare activities; 0=otherwise
Domestic cultural activities 1=if the credit position’s social objective is to promote domestic cultural activities; 0=otherwise
Workers’ recreation 1=if the credit position’s social objective is to promote workers’ recreation; 0=otherwise
Geographical area
Northeast 1=if the borrower is located in the northeastern part of Italy; 0=
otherwise
Isles 1=if the borrower is located in the isles of Italy; 0=otherwise
Northwest 1=if the borrower is located in the northwestern part of Italy; 0=
otherwise
South 1=if the borrower is located in the southern part of Italy; 0=
otherwise
Center 1=if the borrower is located in the center of Italy; 0=otherwise
Other variables
Membership of group 1=if the borrower belongs to a group; 0=otherwise Membership in ONLUS 1=if the borrower is a member of ONLUS; 0=otherwise Support of Banca Etica
board members
1=if the borrower has the support of Banca Etica board members; 0=otherwise
Membership in second-level organization
1=if the borrower is a member of a second-level organization; 0= otherwise
No guarantees 1=if the credit position is not collateralized; 0=otherwise Duration of loans (months) Duration of credit position in logarithms
Total no. of other loans Total number of other loans Macrovariables
Refinancing rate of ECB (%)
Monthly refinancing rate of ECB, in percent (from March 1999 to August 2006). Source: Bank of Italy
OECD unemployment rate Quarterly unemployment rate. Source: OECD Economic Outlook 82
GDP growth rate GDP growth rate, qoq. Source: GDP (at constant prices), OECD
Economic Outlook 82
Inflation rate Inflation rate, qoq. Source: CPI, OECD Economic Outlook 82
associations (19.8% have the special legal status of ONLUS, 12.4% have standard legal status, and 14.4% are nonrecognized associations). Residual groups accounting for a total of 10% of the sample are sole proprietorships (ditte individuali), religious organizations, and limited liability corporations (Srl) (for a definition of these different corporate forms, see Table 1).
Overall, 46.8% of the borrowers may be classified as not-for-profit entities. It should be pointed out that 41.2% of the borrowers have links to a second-level entity (consortium) that may offer informal guarantees (morally but not legally binding obligations). With regard to loan type, 52.6% are credit lines and 18.6% are bank cosigning agreements (see definition in Table 1), while the rest are advances on contracts.
Thirty-nine percent of credit positions included in the database were closed at the date of our inquiry; the remaining 61% are ongoing. With regard to credit motivation,
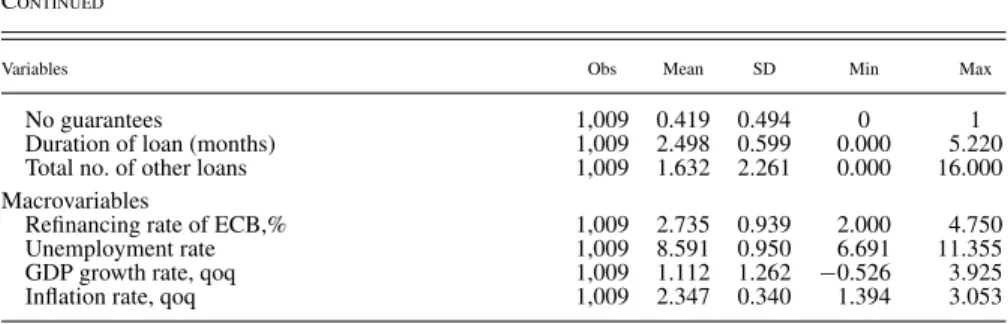
TABLE 3
SUMMARY OFSTATISTICS
Variables Obs Mean SD Min Max
(Partial or total) credit rationing 1,009 0.358 0.480 0 1
Bad credit position (credit position underincaglio, sofferenzaorsotto osservazione)
1,009 0.350 0.477 0 1
Employment size (default: 15<no. of employees≤50) 1,009 0.169 0.375 0 1
Large firms 1,009 0.037 0.188 0 1 Microfirms 1,009 0.794 0.405 0 1 Borrower’s industry Financial services 1,009 0.062 0.242 0 1 Nonprofit 1,009 0.468 0.499 0 1 Health services 1,009 0.081 0.273 0 1 Recreation 1,009 0.076 0.266 0 1 Other 1,009 0.126 0.332 0 1 Agriculture 1,009 0.061 0.240 0 1 Retail 1,009 0.039 0.193 0 1 High-tech 1,009 0.086 0.281 0 1
Borrower’s legal status
Consumer or worker cooperative 1,009 0.153 0.360 0 1
Association without legal status 1,009 0.144 0.351 0 1
Association with legal status 1,009 0.124 0.330 0 1
ONLUS association 1,009 0.198 0.399 0 1
Social cooperative 1,009 0.282 0.450 0 1
Limited liability company 1,009 0.051 0.219 0 1
Other 1,009 0.049 0.215 0 1
Credit position, type of borrower action
Capital investment 1,009 0.065 0.247 0 1
Advances on receivables 1,009 0.197 0.398 0 1
Purchase/restructuring of tangible assets 1,009 0.015 0.121 0 1
Advances on contracts/projects 1,009 0.108 0.311 0 1
Liquidity needs 1,009 0.371 0.483 0 1
Cosigning on projects 1,009 0.151 0.358 0 1
Advances on subsidies 1,009 0.093 0.291 0 1
Credit position type
Advances on documents/contracts 1,009 0.287 0.453 0 1
Credit lines 1,009 0.526 0.500 0 1
Bank cosigning 1,009 0.186 0.390 0 1
Credit position, sector of operation
Bio 1,009 0.420 0.494 0 1
International cooperation 1,009 0.140 0.347 0 1
Domestic health and social welfare activities 1,009 0.192 0.394 0 1
Domestic cultural activities 1,009 0.167 0.374 0 1
Workers’ recreation 1,009 0.080 0.272 0 1 Geographical areas Northeast 1,009 0.231 0.422 0 1 Isles 1,009 0.021 0.143 0 1 Northwest 1,009 0.183 0.387 0 1 South 1,009 0.188 0.391 0 1 Center 1,009 0.377 0.485 0 1 Other variables Membership in group 1,009 0.073 0.261 0 1 Membership in ONLUS 1,009 0.480 0.500 0 1
Support of Banca Etica board members 1,009 0.040 0.195 0 1
Membership in second-level organization 1,009 0.412 0.492 0 1
TABLE 3 CONTINUED
Variables Obs Mean SD Min Max
No guarantees 1,009 0.419 0.494 0 1
Duration of loan (months) 1,009 2.498 0.599 0.000 5.220
Total no. of other loans 1,009 1.632 2.261 0.000 16.000
Macrovariables
Refinancing rate of ECB,% 1,009 2.735 0.939 2.000 4.750
Unemployment rate 1,009 8.591 0.950 6.691 11.355
GDP growth rate, qoq 1,009 1.112 1.262 −0.526 3.925
Inflation rate, qoq 1,009 2.347 0.340 1.394 3.053
TABLE 4
CREDITPOSITIONS ANDCREDITRATIONINGTYPE
Rationing type Freq Percent Cum
Not rationed 648 64.22 64.22
Partial rationing 206 20.42 84.64
Total rationing 155 15.36 100
Total 1,009 100
as expressed by borrowers in credit records, the largest number of positions (37%) were required to satisfy liquidity needs and 15% were advance payments for borrow-ers’ credit to third parties (a standard type is that of borrowers with receivables from the public administration at the national or local levels for the provision of a social service for which the payment has been deferred).
The largest proportion of destination credit sectors pertains to the organic or biological produce industry (42%), followed by international cooperation, domestic health and social welfare, and domestic cultural activities. Forty-one percent of the loans were issued to members of second-level organizations, which were therefore part of larger networks.
Table 5 provides descriptive statistics on the interplay between the two types of credit rationing and various controls. With regard to partial credit rationing, we find marked deviations from the sample mean (which is around 20%) for nonsocial coop-eratives (16%), advances on documents and contracts (14%), advances on subsidies (16%), credit positions of borrowers operating in health services (22%), borrow-ers located in central regions (26%), and borrowborrow-ers with a relationship with board members (13%).
When we consider total credit rationing, the main deviations from the 15% sample mean concern borrowers working in not-for-profit industries (20%), in commercial industries (0%), or located in the south of Italy (23%), with previous loans defaulted or under scrutiny (sotto osservazione) (23%). Associations without legal status are
TABLE 5
RATIONINGTYPE ANDSELECTEDVARIABLES
Not rationed Partial rationing Total rationing Total
Total sample 648 64% 206 20% 155 15% 1,009
Bad credit position
0 455 69% 128 20% 73 11% 656
1 193 55% 78 22% 82 23% 353
Year of the credit request
1999 17 43% 21 53% 2 5% 40 2000 39 36% 60 55% 10 9% 109 2001 51 42% 54 44% 17 14% 122 2002 70 61% 16 14% 29 25% 115 2003 107 69% 17 11% 32 21% 156 2004 140 78% 11 6% 29 16% 180 2005 166 74% 26 12% 33 15% 225 2006 58 94% 1 2% 3 5% 62
Borrower’s legal status
ONLUS association 118 59% 46 23% 36 18% 200
Limited liability company 34 67% 11 22% 6 12% 51
Social cooperative 197 69% 60 21% 28 10% 285
Consumer or worker coop. 104 68% 25 16% 25 16% 154
Association with legal status 82 66% 23 18% 20 16% 125
Association without legal status 79 54% 29 20% 37 26% 145
Other 34 69% 12 24% 3 6% 49
Credit position type
Advances on documents and contracts 231 80% 42 14% 17 6% 290
Cosigning 100 53% 33 18% 55 29% 188
Credit line 317 60% 131 25% 83 16% 531
Credit position, type of borrower action
Capital investment 46 70% 14 21% 6 9% 66
Advances on subsidies 59 63% 15 16% 20 21% 94
Cosigning on projects 77 51% 29 19% 46 30% 152
Liquidity needs 238 64% 83 22% 53 14% 374
Advances on contracts 75 69% 25 23% 9 8% 109
Purchase/restructuring of tangible assets 8 53% 5 33% 2 13% 15
Advances on receivables 145 73% 35 18% 19 10% 199
Credit position, sector of operation
Bio 292 69% 84 20% 48 11% 424
Workers’ recreation 58 72% 11 14% 12 15% 81
Domestic cultural activities 105 62% 31 18% 33 20% 169
Domestic health and social welfare activities 114 59% 43 22% 37 19% 194
International cooperation 79 56% 37 26% 25 18% 141 Borrower’s size Large firms 31 84% 3 8% 3 8% 37 Medium-sized firms 114 67% 33 19% 24 14% 171 Microfirms 503 63% 170 21% 128 16% 801 Borrower’s industry High-tech 59 68% 16 18% 12 14% 87 Retail 32 82% 7 18% 0 0% 39 Agriculture 41 66% 11 18% 10 16% 62 Finance 41 65% 13 21% 9 14% 63 Other 86 68% 23 18% 18 14% 127 Recreation 55 71% 16 21% 6 8% 77 Health services 55 67% 21 26% 6 7% 82 Nonprofit 279 59% 99 21% 94 20% 472 Total 648 64% 206 20% 155 15% 1,009 (Continued)
TABLE 5 CONTINUED
Not rationed Partial rationing Total rationing Total
Geographical area Isles 13 62% 5 24% 3 14% 21 Center 223 59% 97 26% 60 16% 380 South 112 59% 34 18% 44 23% 190 Northwest 133 72% 34 18% 18 10% 185 Northeast 167 72% 36 15% 30 13% 233
Support of Banca Etica board members
0 620 64% 201 21% 148 15% 969 1 28 70% 5 13% 7 18% 40 Membership in ONLUS 0 331 63% 102 19% 92 18% 525 1 317 65% 104 21% 63 13% 484 Membership in group 0 599 64% 193 21% 143 15% 935 1 49 66% 13 18% 12 16% 74 No collateral 0 389 66% 120 20% 77 13% 586 1 259 61% 86 20% 78 18% 423
No. of credit positions granted previously
0 354 68% 122 24% 43 8% 519 1 119 63% 36 19% 35 18% 190 2 72 61% 21 18% 25 21% 118 3 42 67% 10 16% 11 17% 63 4 17 53% 6 19% 9 28% 32 5 14 56% 6 24% 5 20% 25 6 11 39% 0 0% 17 61% 28 7 8 57% 1 7% 5 36% 14 8 4 67% 0 0% 2 33% 6 9 1 20% 3 60% 1 20% 5 10 2 100% 0 0% 0 0% 2 11 2 67% 0 0% 1 33% 3 12 0 0% 1 100% 0 0% 1 13 1 50% 0 0% 1 50% 2 14 1 100% 0 0% 0 0% 1
subject to a larger proportion of total credit rationing (26%) as well. Pronounced deviations were also caused by cosigning on projects (29%) and advances on contracts (6%).
Finally, we found an 89 basis point difference between the European Central Bank (ECB) refinancing rates for partially rationed (3.42) and nonrationed (2.53) borrowers and a 0.4 difference in terms of GDP growth in the quarters before the loan (Table 6). These latter findings show a positive correlation between the rationing decision and both variables. The econometric analysis developed in the section which follows will tell us whether the observed correlations are robust when controlling for concurring factors.
TABLE 6
SHARE OFRATIONEDLOANS, MAINLOANDATA,ANDMACROECONOMICVARIABLES
Not rationed Mean SD Min Max
Duration of loan 648 2.52 0.53 0.00 5.22
Total no. of other loans 648 1.86 2.53 0.00 16.00
Refinancing rate, monthly 648 2.53 0.82 2.00 4.75
Unemployment rate, quarterly 648 8.37 0.85 6.69 11.21
GDP growth rate, qoq 648 0.92 1.06 −0.53 3.92
Inflation, qoq 648 2.30 0.33 1.45 3.05
Partial rationing Mean SD Min Max
Duration of loan 206 2.63 0.64 0.69 4.87
Total no. of other loans 206 1.26 1.63 0.00 7.00
Refinancing rate, monthly 206 3.42 1.03 2.00 4.75
Unemployment rate, quarterly 206 9.34 1.01 7.31 11.35
GDP growth rate, qoq 206 1.96 1.58 −0.53 3.92
Inflation, qoq 206 2.45 0.37 1.39 3.05
Total rationing Mean SD Min Max
Duration of loan 155 2.25 0.72 0.00 4.53
Total no. of other loans 155 1.18 1.57 0.00 7.00
Refinancing rate, monthly 155 2.66 0.86 2.00 4.75
Unemployment rate, quarterly 155 8.52 0.73 7.31 11.10
GDP growth rate, qoq 155 0.81 1.06 −0.53 3.92
Inflation, qoq 155 2.39 0.31 1.72 3.05
NOTES: qoq=quarterly rate of growth. See Table 1 for descriptions of variables.
3. ECONOMETRIC METHODOLOGY AND FINDINGS
Our sample consists ofnfirms. For eachith firm (i=1 ,. . .,N) we have information on the values assumed by a binary response (credit rationing) variableYiand a vector
ofj covariatesxi =(xi1,xi2,. . .,xij)T, (withj=1 ,. . .,M), where superscript, T,
denotes vector transposition.
Binary data are often analyzed by means of a logistic model where the response variable is assumed to be Bernoulli distributed:
f(yi|θi)=p yi
i (1−pi)1−yi =exp[yiθi−log(1+exp(θi))] (1)
and the canonical parameterθi=logit(pi) has an identity link to the linear predictor
θi =α+βTxi,
wherepi =Pr{yi = 1}, αrepresents the overall intercept, and β is a vector of p
regression parameters.
The corresponding estimated model (Tables 7 and 8) is
TABLE 7
DETERMINANTS OFCREDITRATIONING(GLM ESTIMATIONUSINGLOGITLINKFUNCTIONCLUSTERED BYYEAR AND BORROWER)
Partial or total Partial rationing Total rationing
Credit rationing Coeff. SE Coeff. SE Coeff. SE
Bad credit position 0.606∗∗∗ 0.175 0.18 0.221 1.126∗∗∗0.253
Borrower’s size (default: 15<no. of employees≤50)
Microfirms −0.564∗∗∗ 0.207 −0.673∗∗∗ 0.261 −0.491∗ 0.293
Large firms −1.072∗ 0.566 −1.075 0.748 −0.885 0.766
Industry (default: financial services)
Not for profit −0.172 0.586 −0.267 0.739 −0.273 0.621
Health service −0.49 0.447 −0.387 0.512 −0.687 0.672 Recreation −0.823∗ 0.431 −0.761 0.505 −0.922 0.601 Other −0.394 0.382 −0.519 0.434 −0.2 0.498 Agriculture −0.416 0.473 −0.219 0.544 −0.626 0.65 Retail −1.352∗∗∗ 0.500 −1.004∗ 0.535 −14.074∗∗∗0.482 High-tech −0.599 0.374 −0.582 0.505 −0.584 0.522
Borrower’s legal status (default: worker or consumer cooperatives)
Associations without legal status −0.53 0.572 −0.486 0.694 −0.536 0.648
Associations with legal status −0.914 0.571 −0.828 0.709 −0.706 0.646
Other −0.563 0.409 0.056 0.496 −1.496∗ 0.766
Social cooperatives −0.084 0.457 0.161 0.565 −0.513 0.64
Limited liability company −0.3 0.365 0.016 0.461 −0.85∗ 0.483
ONLUS associations −0.666 0.715 −0.737 0.923 −0.513 0.895
Credit position, type of borrower action (default: capital investment)
Advances on receivables 0.162 0.391 −0.21 0.472 1.029∗ 0.610
Purchase/restructuring of tangible assets 0.363 0.65 −0.246 0.646 1.154 1.158
Advances on contracts/projects −0.108 0.393 −0.305 0.479 0.539 0.613
Liquidity needs −0.295 0.334 −0.628∗ 0.369 0.679 0.517
Cosigning on projects 0.375 0.504 −0.274 0.693 1.452∗∗ 0.651
Advances on subsidies −0.197 0.402 −0.775 0.48 0.972∗ 0.577
Credit position type (default: advances on contracts)
Credit lines 1.139∗∗∗ 0.272 0.879∗∗ 0.362 1.394∗∗∗0.403
Cosigning 1.002∗∗ 0.414 0.285 0.557 1.718∗∗∗0.502
Credit position, sector of operation (default: bio)
International cooperation 0.31 0.332 0.461 0.437 −0.136 0.501
Domestic health and social welfare activities 0.35 0.274 0.096 0.32 0.364 0.393
Domestic cultural activities 0.22 0.25 −0.071 0.312 0.555 0.355
Workers’ recreation −0.216 0.349 −0.757∗ 0.412 0.222 0.451
Geographical areas (default: Northeast)
Isles 0.29 0.511 0.015 0.531 0.481 0.738 Northwest 0.042 0.25 0.186 0.306 −0.123 0.386 South 0.45 0.274 0.108 0.331 0.678∗ 0.386 Center 0.462∗∗ 0.211 0.672∗∗∗ 0.253 0.111 0.324 Other variables Membership in groups −0.213 0.322 −0.619 0.426 0.273 0.442 Membership in ONLUS −0.327 0.443 −0.268 0.563 −0.265 0.644
Relationship with Banca Etica −0.634 0.433 −0.875 0.621 −0.324 0.603
Membership in second-level organizations 0.05 0.169 0.052 0.21 0.211 0.236
No guarantees 0.16 0.169 0.162 0.206 0.131 0.233
Duration of loans (months), ln −0.352∗∗ 0.145 0.23 0.17 −0.823∗∗∗0.199
Total no. of other loans −0.15∗∗∗ 0.042 −0.179∗∗∗ 0.050 −0.144∗∗ 0.061
Macrovariables
Refinancing rate of ECB,% 0.633∗∗∗ 0.137 1.175∗∗∗ 0.184 0.186 0.217
Unemployment rate OECD 0.068 0.081 0.023 0.092 −0.152 0.139
TABLE 7 CONTINUED
Partial or total Partial rationing Total rationing
Credit rationing Coeff. SE Coeff. SE Coeff. SE
GDP growth qoq 0.069 0.087 0.174∗ 0.099 −0.177 0.169
Inflation qoq −0.841∗∗∗ 0.257 −1.922∗∗∗ 0.369 0.063 0.383
Log-pseudolikelihood −563.37 −377.39 −309.46
LR testχ2(1) (prob> χ2)a 23.14 (0.00) 47.39 (0.00)
Number of observations 1,009 854 803
NOTES: qoq=quarterly rate of growth. See Table 1 for descriptions of variables.∗p<0.10,∗∗p<0.05,∗∗∗p<0.01. The calculation model
is described in Section 3 (equation (2)). The dependent variable equals 1 if loans were either partially or totally rationed (in columns 1 and 2), if loans are partially rationed (in columns 3 and 4), if loans are totally rationed (in columns 5 and 6), and 0 otherwise. Totally rationed loans are excluded from columns 3 and 4 estimates and partially rationed in columns 5 and 6 estimates.
aLikelihood-ratio test. The null hypothesis is lack of significant difference in the explanatory power of the unrestricted model (including the
ECB refinancing rate regressor) and the restricted model (not including the ECB refinancing rate regressor). TABLE 8
MARGINALEFFECTS AFTERGLM ESTIMATION, SIGNIFICANTVARIABLES
Partial or total Partial rationing Total rationing
Credit rationing Coeff. SE Coeff. SE Coeff. SE
Bad credit position 0.138∗∗∗ 0.040 0.028 0.035 0.105∗∗∗ 0.027
Microfirms −0.131∗∗∗ 0.049 −0.115∗∗ 0.048 −0.044 0.03
Large firms −0.191∗∗ 0.074 −0.118∗∗ 0.054 −0.051∗ 0.030
Recreation −0.158∗∗ 0.068 −0.094∗ 0.050 −0.054∗∗ 0.025
Retail −0.225∗∗∗ 0.055 −0.113∗∗∗ 0.043 −0.143∗∗∗ 0.016
High-tech −0.121∗ 0.067 −0.076 0.055 −0.038 0.027
Associations with legal status −0.176∗ 0.091 −0.103 0.071 −0.045 0.033
Other (associations) −0.113 0.073 0.009 0.078 −0.07∗∗∗ 0.019
Limited liability companies −0.063 0.073 0.002 0.071 −0.05∗∗ 0.020
Liquidity needs −0.065 0.072 −0.091∗ 0.051 0.059 0.048 Advances on subsidies −0.042 0.084 −0.096∗∗ 0.047 0.106 0.082 Credit lines 0.246∗∗∗ 0.056 0.132∗∗ 0.053 0.115∗∗∗ 0.036 Bank cosigning 0.237∗∗ 0.100 0.046 0.095 0.211∗∗ 0.086 Workers’ recreation −0.046 0.072 −0.094∗∗ 0.040 0.019 0.042 Center 0.104∗∗ 0.048 0.108∗∗ 0.042 0.009 0.026 Membership in groups −0.046 0.067 −0.079∗ 0.045 0.024 0.042
Support of Banca Etica board members −0.125∗ 0.074 −0.102∗ 0.053 −0.023 0.037 Duration of loans (months), ln −0.078∗∗ 0.032 0.035 0.026 −0.065∗∗∗ 0.016 Total no. of other loans −0.033∗∗∗ 0.009 −0.027∗∗∗ 0.007 −0.011∗∗ 0.005
Refinancing rate of ECB,% 0.141∗∗∗ 0.031 0.179∗∗∗ 0.026 0.015 0.017
GDP growth rate qoq 0.015 0.019 0.026∗ 0.015 −0.014 0.013
Inflation rate qoq −0.187∗∗∗ 0.057 −0.292∗∗∗ 0.052 0.005 0.03
Number of observations 1,009 854 803
NOTES: qoq=quarterly rate of growth. See Table 1 for descriptions of variables.∗p<0.10,∗∗p<0.05,∗∗∗p<0.01. Based on the logit
model in equation (1), the marginal effects are calculated as:
MEj=∂
E(yi=1|xi).
∂xi j .
That is, the marginal effect identifies the slope for the unitiof the probability curve relating to the unitary changes of the regressorj(j=
1 ,. . .,M) to Pr(y=1|x), holding all other variables constant. In the case of dummy explanatory variables, the change in the probability of
Pr(y=1|x), which results from changing thesth dummy from zero to one, holding all other variables at some fixed values, denoted by X∗, is
given by the difference: Pr(y=1|xs=1, X∗) – Pr(y=1|xs=0, X∗). For the definition of the dependent variables in the different estimates,
= = | = = | i
of the credit position provided by the lender was lower than that required by the borrower i=1, . . . ,N in time t =1, . . . ,T. The (N ×M) matrix of regressors includes borrower or credit type characteristics and macroeconomic variables. We first consider the borrower’s size, industry affiliation, legal status, type of borrower action, and the sector of operation (the constituent elements of each category are listed in Table 1), along with the borrower’s geographical location, the total number of the borrower’s outstanding loans, the borrower’s group affiliation or affiliation to a consortium, the dummy assuming value if the loan was proposed and supported by one of the bank board members, and a dummy taking a value if the borrower at the moment of its request has a previous credit position classified as nonperforming (sofferenza), in distress (incaglio), or under scrutiny (sotto osservazione)12. Second, we include GDP growth in the previous quarter, unemployment and (consumer price index) inflation rates calculated by the OECD, plus the ECB refinancing rate.13More specifically, we are interested in testing a restriction of the model by which H0:
βECB = 0, where βECB is the coefficient of the ECB refinancing rate. For this purpose, beyond the standard test of significance of the specific coefficient, we add to any relevant estimate a likelihood ratio (LR) test14 for which the null hypothesis is the absence of a difference in the explanatory power of the unre-stricted model (with the ECB variable) and the reunre-stricted model (without the ECB variable).
In choosing the methodological approach for our estimates, we had to take into account the complexity of the structure of our data and their peculiar time/space relationship. Our observation units are cross-sectional and at the credit position level, but there exist both a second level (borrowers who may have more than one loan with the bank) and a third level of aggregation (the year of the loan concession).
In a robustness check we took into account that partial and total rationing may be seen as two different phenomena. This is why, in addition to the estimated logit model for the rationed/nonrationed status (see Table 7, columns 1 and 2), we performed two separate estimates for partial and total credit rationing. In the partial rationing model, the dependent variable is 1 if the amount of credit requested is only partially granted, and totally rationed firms are excluded from the sample (Table 7, columns 3 and 4). In the total rationing model, the dependent variable has the value of 1 if credit is completely refused, and otherwise zero (see Table 7, columns 5 and 6). We opted for the exclusion of cases of partial rationing in total rationing estimates. The alternative estimate from which partial cases are not excluded yields results substantially similar to those described in Section 3.3 and shown in Table A2 in the Appendix.
12. In this base estimate Rati takes a value equal to 1 not only for totally denied credit but also for companies “only” partially rationed.
13. For the complete set of variables, see Tables 1 and 2.
14. The test is LR=2∗(uL – rL), where uL and rL are, respectively, the log-likelihoods maximized with respect to unrestricted and restricted model parameters.
Finally, we estimated a multinomial logit model in which partial and total rationing are the dependent variables of the two-equation systems (Table 9). More formally, the response variable in the multinomial logit model assumes three specifications:
Rati = ⎧ ⎪ ⎨ ⎪ ⎩ 0 if no rationing 1 if totally denied 2 partially refused. The estimated model is15
logit[P(Yi,rat=k|xi) ]=α0+Xijβj, (3)
whereP(Yi,rat=k|xi).identifies the probability of arriving at a valuek(fork=0,1,2)
for companyifor the (partially, totally) rationed/nonrationed status and conditional upon the set of regressors specified in model (2). The alternative estimate, from which partial cases are not excluded, yields results substantially similar to those described in Section 3.3. With regard to the specification choices above, one may discuss whether the partial and total choices can be ranked or must be considered separately. However, the results from separate estimates seem to show that the two decisions derive from different policies. Total rationing is related more strongly to the borrower’s individual characteristics, while decisions regarding partial rationing may also be conditioned by macroeconomic conditions affecting all borrowers in a given time period. For this reason, we chose the multinomial (instead of an ordered) logit approach.
Finally, because we were interested not only in statistical but also in economic significance, for each model we calculated the magnitude of the impact of a unit change (marginal effect) of a given regressor on the probability that the dependent variable would have a value of 1 (Tables 8 and 10).16
3.1 Findings Regarding Variables at the Credit or Borrower Level
The first result was the strong significance of a borrower’s past record. As expected, the existence of a nonperforming loan or of anincaglioorsotto osservazioneposition with the same bank significantly raised the probability of credit rationing. Hence, as already demonstrated in the literature (Cleary 1999), some credit rationing is justified and is related to the credit risk evaluation of the borrower. If we consider the model discussed in Section 1,17the result is consistent with optimal nonprofit-maximizing bank behavior under the Basel constraint. From a quantitative point of view, we
15. Note that in the multinomial (in contrast to the ordered) logit model there is no ranking between the three different choices.
16. Full details on how the impact was calculated in the analysis are found in the legends to Tables 8 and 10.
TABLE 9
DETERMINANTS OFCREDITRATIONING(MULTINOMIALLOGITESTIMATIONCLUSTERED BYYEAR ANDBORROWER)
Partial rationing Total rationing
Credit rationing Coeff. SE Coeff. SE
Bad credit position 0.016 0.022 0.110∗∗∗ 0.025
Borrower’s size (default: 15≤no. of employees<50)
Microfirms −0.707∗∗∗ 0.262 −0.44 0.277
Large firms −1.101 0.746 −0.821 0.765
Borrower’s industry (default: financial services)
Nonprofit −0.137 0.778 −0.314 0.611 Health services −0.306 0.516 −0.771 0.677 Recreation −0.657 0.525 −1.038∗ 0.609 Other −0.439 0.44 −0.234 0.504 Agriculture −0.166 0.53 −0.631 0.671 Retail −0.882 0.536 −33.052∗∗∗ 0.470 High-tech −0.635 0.5 −0.567 0.506
Borrower’s legal status (default: worker or consumer cooperatives)
Associations without legal status −0.414 0.736 −0.551 0.631
Associations with legal status −0.789 0.743 −0.901 0.643
Other −0.028 0.488 −1.564∗∗ 0.762
Social cooperatives 0.303 0.556 −0.501 0.647
Limited liability companies 0.052 0.452 −0.816∗ 0.474
ONLUS associations −0.723 0.944 −0.491 0.888
Credit position, type of borrower action (default: capital investment)
Advances on receivables −0.161 0.453 0.995 0.611
Purchase/restructuring of tangible assets −0.124 0.644 1.127 1.087
Advances on contracts/projects −0.312 0.468 0.419 0.613
Liquidity needs −0.639∗ 0.366 0.577 0.518
Cosigning on projects −0.149 0.658 1.346∗∗ 0.648
Advances on subsidies −0.841∗ 0.478 0.951∗ 0.577
Credit position type (default: advances on contracts)
Credit line 0.907∗∗∗ 0.344 1.46∗∗∗ 0.398
Cosigning 0.274 0.561 1.737∗∗∗ 0.511
Credit position, sector of operation (default: bio)
International cooperation 0.633 0.425 −0.053 0.499
Domestic health and social welfare activities 0.15 0.316 0.396 0.399
Domestic cultural activities −0.165 0.323 0.671∗ 0.350
Workers’ recreation −0.675 0.413 0.245 0.452
Geographical areas (default: Northeast)
Isles 0.07 0.545 0.487 0.712 Northwest 0.103 0.296 −0.097 0.385 South 0.147 0.313 0.677∗ 0.396 Center 0.639∗∗∗ 0.247 0.139 0.327 Other variables Membership in groups −0.63 0.401 0.292 0.427 Membership in ONLUS −0.398 0.557 −0.308 0.642
Rapport with Banca Etica −0.84 0.609 −0.348 0.601
Membership in second-level organizations −0.017 0.201 0.27 0.239
No guarantees 0.195 0.203 0.096 0.235
Duration of loans (months), ln 0.151 0.167 −0.843∗∗∗ 0.195
Total no. of other loans −0.167∗∗∗ 0.049 −0.154∗∗ 0.064
Macrovariable
Refinancing rate of ECB,% 1.135∗∗∗ 0.177 0.199 0.205
Unemployment rate OECD 0.027 0.091 −0.155 0.134
TABLE 9 CONTINUED
Partial rationing Complete rationing
Credit rationing Coeff. SE Coeff. SE
GDP growth qoq 0.191∗ 0.098 −0.16 0.152
Inflation qoq −1.847∗∗∗ 0.355 0.089 0.367
Waldχ2(prob> χ2) 22,203.88 (0.00)
LR testχ2(1) (prob> χ2)a 46.70 (0.00)
No. of observations 1,009
NOTES: qoq=quarterly rate of growth. See Table 1 for descriptions of variables.∗p<0.10,∗∗p<0.05,∗∗∗p<0.01. The estimated model
is described in Section 3 (equation (3)). The variable Bad Credit Position is rescaled by 10 for derivative calculation.
aLikelihood-ratio test. The null hypothesis is lack of significant difference in the explanatory power of the unrestricted model (including the
ECB refinancing rate regressor in both equations of the system) and the restricted model (not including the ECB refinancing rate regressor in both equations of the system).
calculate that the existence of a bad loan position in the borrower’s record with a lender raises the probability of credit rationing by 13.8% (Table 8).
Upon investigating partial and total credit rationing separately, we found that only the latter is affected by a bad track record (the magnitude of the effect is 0.4% but significant; see Tables 9 and 10). The explanation for this result is that past nonperformance affects the borrower’s creditworthiness and not the availability of credit. As a consequence, it leads to rejection of the borrower’s request and not just to reduction of the loan.
With regard to industry affiliation dummies, we found (consistent with descriptive evidence provided in Table 5) that borrowers in the retail industry are significantly less rationed than the benchmark for financial services. In the multinomial logit estimate, the abovementioned effect for borrowers in the retail industry is explained by less total (but not partial) credit rationing.
With regard to loan types, we found that credit lines and bank cosigning agreements are subject to significantly more credit rationing than the omitted type of advances on contracts. Here again, the entire effect is to be attributed to total credit rationing choices.
Another interesting finding is that microfirms (firms with fewer than 15 employees) are significantly less rationed than the benchmark (firms 16 to 50 employees). Both separate partial and total and multinomial logit results highlight that this is mainly a partial rationing phenomenon. The explanation may be twofold. First, microfirms ask for small credit quantities and are therefore less likely to receive a lower amount than requested.
Second, higher firing costs arising from the application of Italian law (Law 300/1975) expose small firms (but not microfirms) to greater risk and make them more sensitive to the business cycle. The law establishes that workers fired from firms with more than 15 employees must be reinstated if a judge concludes that they have been fired withoutgiusta causa(i.e., on fair grounds). The “fair grounds” rule cannot be applied to workers fired from firms with fewer than 15 employees.
central regions of Italy had a much higher probability of experiencing (partial) credit rationing. It should be remembered that many of the Banca Etica’s borrowers located in the center of the country receive contracts for work from public administration authorities. A likely interpretation is that the liquidity risk of these borrowers (delays in payment from the government and risks that not all receivables are acknowledged by the government itself) induces the bank to reduce the amount of credit.
The somewhat surprising result here is the absence of significant effects of location in the Italian Mezzogiorno (southern Italy) on credit rationing, because nearly all previous empirical studies on credit rationing in Italy have shown borrowers located in the south of Italy to be rationed to a greater degree. To understand the scenario of financial intermediation in the south of Italy, it is necessary to note that several mergers and acquisitions in the Italian banking system during the 1990s transferred ownership of overindebted banks in the south in large part to banks in the north. Empirical studies of the effects of this change have documented that bank concentration has improved bank performance (Focarelli et al. 2002) in the area. Parallel to this, some authors have complained that the process has also generated a loss of local information and reduced the credit issued to local firms, as shown by the dramatic drop in the total volume of financed investment in the area (Mattesini and Messori 2004). These considerations help explain why location in the south is significant (and negative) in the credit rationing estimate for the 1998–2000 period but not for the 1989–1991 period (Bagella, Becchetti, and Caggese 2001). The anomaly of our finding in this framework is, however, consistent with Banca Etica’s policy: an explicit social goal of this policy is to promote credit in the south. Indeed, the bank is one of the few for which credits are higher than deposits from the Mezzogiorno.
Finally, the number of preexisting loans with other banks and loan durations are all significantly and negatively correlated with the dependent variable. These final two findings may seem odd, but are perfectly reasonable if we interpret them together with the effect of the previous loan risk classification dummy. Net of the borrower loan risk identified by the bank, the presence of multiple loans is a proxy for creditworthi-ness,18and as such should be negatively correlated with credit rationing. However, the same variable also indicates that Banca Etica may have a lower probability of being a senior creditor in bankruptcy procedures and therefore should have an oppo-site (positive) effect on credit rationing.19 Our findings indicate that the first effect prevails.
The partial and total separate estimates and the multinomial logit estimate show that the loan duration effect exists only for total credit rationing, while the multiple borrowing effect does so only for partial credit rationing. The negative relationship
18. Detragiache, Garella, and Guiso (2000) argue that multiple banking reduces the probability of credit rationing. Von Thadden (1995) finds that a higher number of lenders reduces banking rent extraction.
19. Bolton and Scharfstein (1996) argue that multiple banking may make debt renegotiation more difficult, and Petersen and Rajan (1994) show that the passage from single to multiple borrowing increases the cost of credit and reduces its availability.