A City-Wide Experiment on Trust Discrimination
∗
Armin Falk
†and Christian Zehnder
‡November 2012
Abstract
This paper reports evidence from a city-wide field experiment on trust. About 1,000
inhabitants of Zurich take part in a trust experiment, in which first movers can condition their investments on the residential districts of second movers. First movers differentiate their investments systematically depending on where in Zurich the second mover lives. The observed discrimination pattern is robust as indicated by additional data collected in a newspaper study and a laboratory experiment. Economic status seems to be key for a district’s reputation: first movers invest more if second movers live in high-income districts. Investments into districts are positively correlated with the corresponding willingness to repay, which indicates that first movers correctly anticipate the relative trustworthiness of inhabitants of different districts. Furthermore, we find that people trust strangers from their own district significantly more than strangers from other districts. This in-group effect is, at least partly, driven by more accurate beliefs about the trustworthiness of in-group members.
JEL-Classifications: C90, D63
Keywords: Trust, Field Experiment, Discrimination, In-group Effect
∗Financial support by the Research Committee and the Young Academics Support Committee of the
University of Zurich is gratefully acknowledged. We thank the Statistical Office of Zurich for very valuable support. We would also like to thank Iris Bohnet, Martin Brown, Urs Fischbacher, Edward Glaeser, Lorenz Goette, Michael Kosfeld and seminar participants at Caltech, ENABLE Workshop (Fraueninsel), Mac Arthur Research Network Workshop (Philadelphia), University of Southern California, University of Chicago, Harvard University and University of Munich for helpful comments.
†University of Bonn, [email protected]
1
Introduction
This paper reports evidence from a city-wide field experiment on trust. We study whether people exhibit different levels of trust depending on which city district their trading part-ner comes from. Different to the standard approach used to study variation in trust across regions, we do not rely on answers to general trust questions but we elicit incentive compatible trust decisions of the city’s inhabitants. We directly observe trust related, economically relevant decisions that inform us about the inhabitants’ perception of trust-worthiness of populations of different city districts. In addition, we use district-specific characteristics to identify the determinants of cross-district variation. The methodology suggested in this study can be applied to any city or region as a simple tool to identify trust discrimination and its determinants. This type of discrimination is important in light of the fact that trust and trustworthiness constitute central components of a community’s social capital (see e.g., the definitions in Loury, 1977; Coleman, 1990; Putnam, 2000). In this sense trust can be seen as a lubricant for economic transactions.1 Thus,
identi-fying problem areas allows policy makers to target appropriate policies to enhance the reputation of districts which are perceived to exhibit low levels of trustworthiness.
We conducted our field experiment in the city of Zurich. Roughly 1,000 inhabitants, representing all 12 districts of Zurich, took part. They participated in a trust experiment in which subjects’ decisions may depend on everyday knowledge about characteristics of city districts.2 The design of the experiment is based on a variant of the so-called trust
or investment game (Berg et al., 1995). In this sequential two-player game first movers send money to second movers, which is tripled by the experimenters. Second movers then decide how much to return. The amount sent tells us how much trust the first mover places in the second mover. The amount returned provides an indication of the second mover’s trustworthiness. In order to link the trust decisions to the context of the city, first movers made a contingent decision: before knowing the residential district of their second mover they had to decide on an investment decision for each of the 12 districts, including their own district. This design feature allows us to study trust discrimination across city districts in a straightforward way. By comparing the amounts sent into different districts, we can measure whether the perceived trustworthiness of a trading partner depends on where in the city the person lives. If the inhabitants of these districts are perceived as more trustworthy than others, these high reputation districts will attract higher investments. In
1In a famous quote Kenneth Arrow notes: “Virtually every commercial transaction has within itself
an element of trust...”, (see Arrow, 1972, p. 357).
2In the taxonomy of Harrison and List (2004) our study would therefore be classified as a “framed
this sense we can interpret the perceived trustworthiness as an indications for a district’s level of social capital. To check whether observed differences in received investments across districts are really driven by differences in perceived trustworthiness, first movers were also asked about expected back transfers for each investment. Second mover decisions were elicited using the contingent response method, i.e., second movers indicated their repayment for each possible first mover investment. This has the big advantage that we can measure the actual trustworthiness of inhabitants of different districts independent of actually received first mover investments. To check the robustness of our results, we also make use of survey data, a newspaper poll, and a laboratory experiment.
Our main findings can be summarized as follows. First, investment levels differ system-atically across residential districts of second movers, i.e., many first movers discriminate in their trust decision. These differences largely reflect first movers’ beliefs, i.e., they expect different returns on investment and invest accordingly. The systematics of the discrimina-tion pattern is supported by our survey results, the newspaper study, and the laboratory experiment. The fact that we find very similar results using four different methods of data elicitation underlines that beliefs about the districts’ different reputations are commonly shared. In terms of district characteristics that determine a trustworthy reputation, eco-nomic status is key: the higher the ecoeco-nomic status, the more money is transferred to the inhabitants of a particular district.
Second, on a district level, both expected returns on investment as well as investments are positively and significantly correlated with actual willingness to repay displayed by second-movers.3 In other words, first movers correctly anticipate the relative
trustworthi-ness of inhabitants of different districts and discriminate on the basis of this belief. In a third step, we explore in-group aspects of trust. As many every-day transactions take place in people’s neighborhood, it is important to understand how in-group effects affect trust decisions. We show that first movers send significantly higher amounts to strangers who belong to their own district than to strangers from other districts. First movers invest higher amounts, because they expect higher repayments from their fellow citizens than from strangers who live outside of their district. Since in-group beliefs re-garding trustworthiness are more accurate than beliefs of outsiders, the higher investments to in-group members seem to stem from superior information about fellow citizens rather than from overoptimism regarding the trustworthiness of in-group members.
We believe that studying trust at the city level is useful: The fact that people dis-criminate in their trust between strangers from different districts can have important
3Notice that we elicit second mover responses with the contingent response method. Thus, we can
measure the second mover’s willingness to repay independently from the actually received first mover investment.
consequences, not only for an individual living in a particular district but also for dis-tricts as a whole. Discrimination based on residential disdis-tricts can affect individuals in their daily interactions. In the hiring process, for example, it may be a disadvantage if an applicant lives in a district with a bad reputation. Otherwise identical applicants may be treated differently simply because of district specific beliefs held by the personnel man-ager. On the level of districts, trust discrimination may foster the process of segregation. Our study suggests that districts with higher economic status enjoy a reputation of be-ing trustworthy. Since this reputation turns inhabitants of these districts into interestbe-ing trading partners and attracts investments, there is an endogenous tendency to reinforce inner city inequalities. Relatively richer districts are trusted more and therefore become even richer. This process may be reinforced by moving decisions and the choice of busi-ness locations. Our results and the suggested methodology are therefore relevant from a city development point of view. The study demonstrates that policy makers can use simple tools to identify the reputation of different neighborhoods. Running similar studies can help identifying problem areas. It also helps providing potential indicators for future district development, which allows targeting appropriate policies to specific districts.
We also think that our study is methodologically helpful. Most previous papers on cross-sectional comparisons of social capital have relied on the following trust question: “Generally speaking would you say that most people can be trusted or that you can’t be too careful in dealing with people?” (for a critical review see, Sobel, 2002). This question which comes from the General Social Survey (GSS) has been criticized, because answers to it are difficult to interpret (see, e.g., Glaeser et al., 2000). Since the question does not specify who is meant by “most people”, it remains unclear whether variations in responses reflect differences in beliefs about the trustworthiness of a common set of people or differences in interpretation of who is meant by “most people”. In addition, some of the variance in responses may also be driven by the fact that some respondents are not willing to answer truthfully when asked such a question in a survey or do not take it seriously. Our behavioral measure avoids both these concerns. Trust decisions are incentivized and the group targeted by each decision is clearly specified as the population of a narrowly defined area (in our case a specific city district of Zurich).4
Our study also contributes to the literature on trust discrimination. Our results show that first movers have relatively accurate expectations about the relative trustworthiness of districts and invest more in districts that are actually more trustworthy. This is
differ-4McEvily et al. (2012) highlight the importance of clearly identifying the target of trust. When the
target of trust is held constant, they observe a strong relationship between behavioral and attitudinal (i.e., questionnaire based) measures. In contrast, when trust measures are aggregated across targets, the relationship between behavioral and attitudinal measures of trust is much weaker.
ent to previous studies. Fershtman and Gneezy (2001), e.g., investigated gender and race effects in a trust game played between Ashkenazic and Eastern Jews from two Universities in Israel. While there is no evidence for ethnic discrimination to and by women, male sub-jects exhibit a significant discrimination pattern, transferring less money to Eastern males than to Ashkenazic males. Different to our findings, however, this discrimination turns out to be the consequence of largely mistaken stereotypes (i.e., first movers differentiate based on biased beliefs about variation in the trustworthiness of different groups).
Furthermore, our findings shed new light on the controversial issue of in-group ef-fects, i.e., the possibility that people treat in-group members differently than out-group members. Starting with the famous “Robber’s Cave Experiment” by Sherif et al. (1961) many experiments in psychology have demonstrated the presence of in-group favoritism in several domains (see, e.g., Tajfel and Turner, 1986). In our experiment we find that first movers invest substantially more money if the second mover lives in the same district than if he or she lives outside of the own district. Investments to in-group members are higher, because first movers expect higher repayments from in-group members than they expect from out-group members. Interestingly, the first mover beliefs regarding in-group behavior are more accurate than the beliefs regarding out-group behavior. This suggests that the in-group effect in our experiment is, at least partly, the consequence of superior information about in-group behavior rather than a bias.
The remainder of the paper is organized as follows: in the next section we describe the design and the used background information. In section 3 we present our results. Section 4 summarizes and concludes the paper.
2
Design and Background Information
In this section we first explain how we extend the trust game to a city-wide experiment. We then provide some background information about Zurich and discuss our experimental procedures. Finally, we also describe how we elicit the complementary data sets (survey, newspaper poll, and laboratory experiment) on which our robustness checks are based.
2.1
A Field Experiment on Trust Discrimination at the City
Level
Our experiment is based on the trust game introduced by Berg et al. (1995). Two ran-domly chosen subjects constitute an interaction group. At the beginning of the experiment both subjects receive an endowment of 20 Swiss Francs (CHF 1 ∼ US-$ 1.05, November 2012). One person is assigned the role of the first mover, the other the one of the second
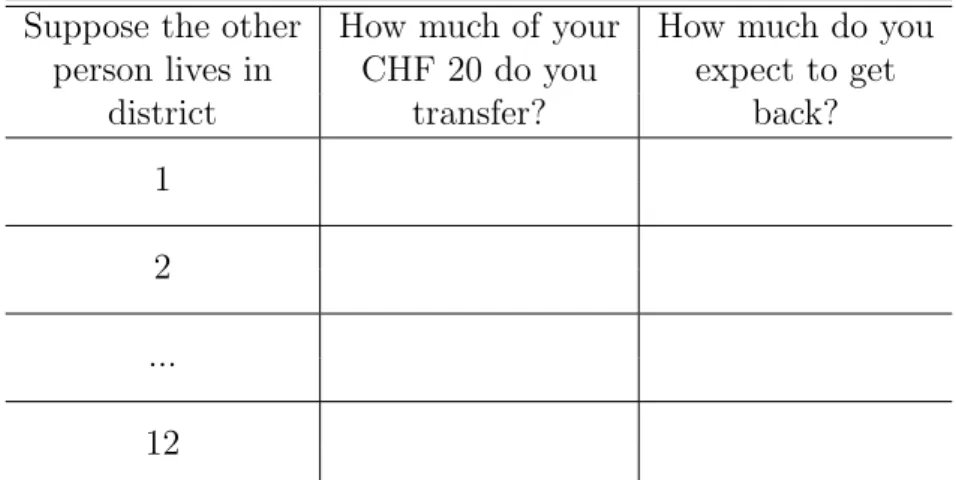
mover, respectively. The first mover decides how much of his endowment to transfer to the second mover. The transfer can be any amount in steps of 2 Swiss Francs, i.e., 0, 2, 4, ..., or 20 Francs. The chosen transfer is tripled by the experimenter and passed to the second mover. Contingent upon the first mover’s transfer the second mover decides on a back transfer to the first mover. This back transfer can be any integer amount between 0 and 80 Swiss Francs. Incomes are determined as follows: the first mover earns his en-dowment minus his own transfer plus the back transfer of the second mover. The second mover gets his endowment plus 3 times the first mover’s transfer minus his back transfer. Our design differs in important ways from previous trust experiments. Since we are mainly interested in the variation of trust across residential backgrounds of potential in-teraction partners, we add concrete context to the decision environment. In particular, first movers could condition their investment decision on the residential district of the second mover. When they took their decision, they did not yet know in which of Zurich’s districts their second mover lived. Therefore they had to make twelve investment deci-sions, one for each of the 12 districts of Zurich. First movers made their decisions with the help of a table with twelve rows (see Table 1). The first column of this table said“Suppose the other person lives in district X”. In the second column first movers indicated how much they invest if the second mover lives in district 1, in district 2 etc. up to district 12. In Column (3), first movers were also asked to state their beliefs about the second movers’ repayment decision for each of the twelve districts. Thus first movers made 12 investment decisions and indicated 12 beliefs, one for each district. Knowing first movers’ beliefs is important as it allows us to calculate expected returns on investments and to distinguish between different motivations behind investment decisions.
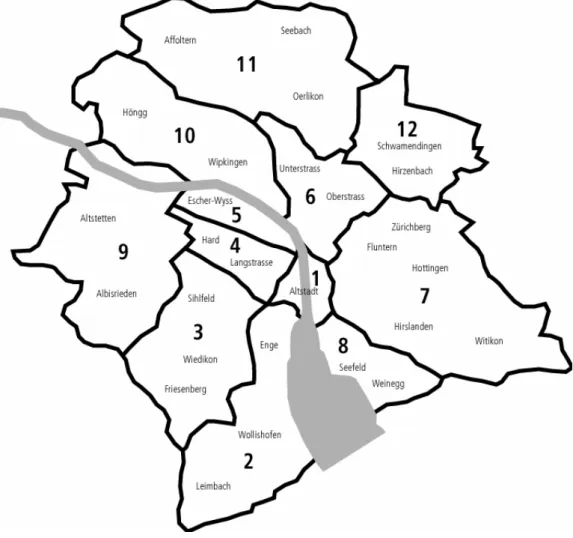
The instructions also contained a map of Zurich, which displayed the district borders as well as the names of the neighborhoods in each district (see Figure 1). Notice, however, that we did not provide subjects with any statistical information concerning the districts’ characteristics. Thus, any observed differentiation across districts is based on the subjects’ everyday knowledge about Zurich.
Eliciting multiple observations per first mover has the decisive advantage that we can eliminate the impact of inter-individual differences in the baseline trust level when analyzing first mover decisions. Since each first mover made a decision for each possible district, inter-individual differences in the level of trust cancel out in our cross-district comparisons. Had we elicited only one decision per first mover, we would have ended up with a data set consisting of about 42 first mover decisions for each residential district of second movers (we have 508 first movers and 12 districts). Given that first mover investments exhibit substantial cross-subject variance (see the result section for details),
so few observations would have made it very hard to identify a systematic discrimination pattern and its determinants. Furthermore, the structure of our data allows us to identify the presence of discrimination at the individual level. For each first mover we can observe whether investments vary across districts, or whether the same amount is invested for all districts. Finally, multiple observations per individual make it possible to study in-group effects at the individual level: since first movers invest in all districts, including their own, we can identify at the individual level whether first movers treat people living in their own district in a special way.5
To elicit second movers’ willingness to reciprocate, we used the contingent response method. This means that each second mover, before knowing the actual first mover’s investment, made a back transfer decision for each of the 11 possible investments (0, 2, ..., 20). Whether the contingent response method affects the measurement of people’s willingness to reciprocate is an open question.6 For our purpose, however, the contingent
response method has an important advantage. It provides us with a measurement of each second mover’s willingness to reciprocate which is independent of the actual trans-fer received from the first mover. This measurement is key for a clean and comparable calculation of the level of reciprocation on the district level. Moreover, we are not predom-inantly interested in the level of reciprocity but in the differences across districts, which should not be confounded by using this elicitation method. Finally, since the strategy method allows for the simultaneous elicitation of first and second mover decisions it also facilitated the procedures of our experiment considerably.
2.2
The City of Zurich
Our study investigates trust discrimination at the city level. As first movers have the chance to condition their investment decision on the residential district of the second mover based on their personal knowledge about the different neighborhoods in Zurich, we find it useful to provide some information about the city’s background. Zurich is the largest city in Switzerland. Located in the northern part of Switzerland the municipality has approximately 400’000 inhabitants. Zurich is among the world’s largest financial centers and serves as a mixed hub for railways, roads, and air traffic.
Before 1893 the boundaries of the city of Zurich were more or less defined by what is
5The fact that first movers made multiple decisions may raise concerns about a potential experimenter
demand effect. We will address this point in section 2.3 when we discuss our robustness checks.
6Brandts and Charness (2011) survey the evidence on whether the strategy method leads to other
results than the direct-response method. Of the twenty-nine comparisons considered, sixteen find no difference, four do find differences, and nine comparisons find mixed evidence. However, they never find that a treatment effect found with the strategy method is not observed with the direct-response method.
nowadays called the “old town” (in German: “Altstadt”, see District 1 in Figure 1). In 1893 the city expanded extensively when it merged with 11 of the surrounding villages. In 1934, the city borders were again extended when Zurich incorporated another 8 villages. Today, the city consists of twelve districts, numbered 1 to 12 (see Figure 1 for a city map containing the numbered districts and the names of the neighborhoods contained in each district). In contrast to other cities where district numbers are often used predominantly for administrative purposes, the district numbers in Zurich are an integrated part of every-day language, i.e., when people refer to a specific location in the city, it is very common to use the district number to give an indication of where approximately to find it.
What makes Zurich an interesting city for our study is the fact that the different dis-tricts are quite heterogeneous with regard to many of the variables that the social capital literature identifies as important determinants of trust. In Table 2 we list these variables and show how they are distributed across the 12 districts of Zurich (the data underlying this table is provided by the statistical office of Zurich). Table 3 shows the Spearman rank correlations between the different district characteristics (p-values in brackets).
Several authors have pointed out a positive relation between economic and social status and trust (Alesina and La Ferrara, 2002; Alesina and La Ferrara, 2000; Glaeser et al., 2000). We use the variables income and high education as proxies for social and economic status. Income is the taxable median income per district in 1000 Swiss Francs. High education measures the fraction of people who hold at least a “Matura” degree, an exam that comes at the end of university-track high school in Switzerland and is a prerequisite for attending university. Income and high education are strongly correlated (Spearman’s rho = 0.81, p = 0.001, see Table 3) and both variables vary considerably across districts. Median income ranges from 30,000 to 44,000 Swiss Francs, while high education is distributed between 0.15 and 0.48.
Another important factor is ethnic and religious heterogeneity (Putnam, 2000; Alesina and La Ferrara, 2000). The negative correlation between heterogeneity and trust may reflect the fact that each ethnic and religious group is characterized by specific cultural and social norms. Heterogeneity in norms and cultures may therefore negatively affect social networks and trust. We use two variables capturing this heterogeneity. Our measure of ethnic heterogeneity is the fraction of foreigners in a given district. The variation in the fraction of foreigners is quite substantial ranging from 19 to 44 percent. Religious heterogeneity is measured with a fragmentation index, i.e., 1 minus the sum of squared fractions of the following religious groups: protestant, catholic, muslim, jewish and other. While ethnic and religious heterogeneity are correlated (Spearman’s rho = 0.62, p = 0.03), there is only little variation in religious heterogeneity across districts.
In a similar vein a high degree of mobility and low rates of home ownership have been shown to be negatively correlated with social capital (Glaeser et al., 2002; DiPasquale and Glaeser, 1999). We measure mobility with the variable years of residency which shows how long people have lived in their respective district, on average. While the shortest average time lived in a district is 6.7 years, people in other districts stay as long as 11.3 years, on average. We measure home ownership as the fraction of homes (apartments and houses) owned by inhabitants.7 Table 3 shows that in Zurich home ownership is
not correlated with years of residency (Spearman’s rho = -0.01, p = 0.983). However, there is a strongly positive and significant correlation between home ownership and income (Spearman’s rho = 0.88, p<0.001). In combination with the fact that it is rather common that tenants rent the same apartment for many years in Switzerland, this suggests that home ownership probably reflects economic status rather than mobility in the case of city districts in Zurich.8
This heterogeneity in district characteristics provide us with a good chance to identify the main determinants of possible trust discrimination across districts.
2.3
Experimental Procedures
For logistical reasons the experiment was conducted via mail correspondence. The Sta-tistical Office of Zurich was willing to provide us with a set of 340 addresses for each of the 12 city districts of Zurich (4080 addresses in total). The addresses were randomly drawn from the adult population (18 years or older) in the registry of residents of the city of Zurich.9 From the 4080 letters sent out 191 were returned as undeliverable. In total
984 persons took part in the experiment (508 first movers and 476 second movers). This amounts to a participation rate of about 25 percent.10
All potential participants received a mailing including a cover letter, detailed instruc-tions, a decision sheet and a questionnaire.11 The cover letter informed subjects about
7It may seem that the numbers reported for home ownership in Table 2 are very low. However,
renting apartments instead of owning is much more common in Switzerland than in many other countries (country wide the fraction of homes owned by inhabitants is only 0.34, see http://www.bfs.admin.ch). Swiss cities, in general, tend to have especially low home ownership rates.
8Rental agreements last for five years on average in Switzerland. Furthermore, it is not unusual that
people rent the same apartment for ten or more years (see http://www.bfs.admin.ch).
9People who live in Zurich are legally obligated to register at the registration office at the latest 14 days after arrival.
10There was variation in the participation rate across districts. The number of participants varied
between 64 and 101. We get back to this point when we describe the data analysis in the result section. See Footnote 18 for a detailed description.
11An English version of the instructions can be obtained at
the possibility to take part in a paid experiment, conducted by the University of Zurich. In order to enhance the credibility that we would actually pay subjects we added the remark that the Legal Service of the University guarantees that the study is run exactly according to the rules stated in the instructions. We also made clear to subjects that the study was run in accordance with the data protection legislation of the city of Zurich. In particular, we stated that all data will be used only for scientific purposes and not given to any third party. Moreover, we guaranteed that data will be stored in anonymous form and that any information specific to persons will be destroyed after the data collection is completed. We offered participants to send us an email (using a neutral University email address) or to call us, in case of questions. Only few people made use of these options. The instructions explained the idea and the rules of the experiment in detail. First and second movers were told that they were matched with another anonymous person who was randomly selected and lives in Zurich. Participants had to complete the decision sheet, i.e., first movers filled out the table concerning investments and beliefs and second movers filled out the table concerning back transfers. The questionnaire elicited person-specific information about the participants (demographics, values, residential background).
Subjects returned the completed decision sheet and questionnaire to us, using a pre-stamped envelope. It was made clear in the cover letter that the materials had to be returned before the end of a deadline, which was about one week after subjects had received their letter. Among all participants we randomly formed pairs. Given the district of the second mover we determined the respective investment of the first mover. Using the investment we then checked the corresponding back transfer.12 In a second mailing all
participants were informed about the outcome of the experiment, including the district of the second mover, the investment and back transfer decisions and the resulting payoffs for both players. The second mailing also contained the payments in a sealed envelope.13
2.4
Robustness Checks: Newspaper and Laboratory Studies
In order to get additional and independent information about the systematics and robust-ness of the trust discrimination that we observe in the field experiment we collected data from three additional sources: a newspaper study, a survey, and a laboratory experiment. To test the robustness of the observed pattern with regard to the particular data elicitation method used in our field experiment we also conducted a newspaper study. Several months after we had collected the data from our field experiment we contacted a
12As there were a few more first movers than second movers, some second movers were matched twice.
The payoff of these players was determined by the decisions associated with the first match.
13As agreed upon with the Statistical Office, we deleted all names and address files immediately after
large daily newspaper in the Zurich area, the Tages-Anzeiger. We decided to publish two articles in the newspaper. The first one reported in detail aims and design of the study. In particular, we explained the rules of the experiment and the fact that randomly drawn people from all districts of Zurich had taken part in the study. The first article did not mention any result, however. Instead readers were invited to take part in a quiz. They were asked to answer the following two questions:
(1) What do you think, which are the two districts that received the lowest investments?
(2) What do you think, which are the two districts that received the highest investments?
To guarantee incentive compatibility, we promised to randomly select three readers among all those readers whose answers were correct, and to pay them 200 Swiss Francs. Readers could either email their answers or send them by postcard, within three days after the article had been published. A total of 281 readers took part.14 If the newspaper readers
succeed in predicting the results of our field experiment, this provides evidence for the robustness of our results with regard to different data elicitation procedures. The second article appeared one week after the first one and contained the results of our field exper-iment and the newspaper study. Since there was much public interest, the second article also contained an interview with the authors as well as with the mayor of Zurich.
The fact that first movers made multiple decisions may raise concerns about a potential experimenter demand effect. One could argue that by presenting twelve options, subjects were induced to differentiate their investment decisions overstating the differences in trust across districts. While this is a potentially important concern, we are confident that it does not compromise our findings. Independent of the level of discrimination our method does not induce a particular pattern of discrimination. Since we do not provide any information on districts, we do not induce the participants to focus on a particular aspect that varies across districts. Thus, if subjects were simply induced to choose different investments in different rows, the resulting pattern would not be systematic but random. Ultimately, however, it remains an empirical question whether the elicitation of multiple decisions of first movers affects behavior. Our questionnaire data allows us to shed some light on this point. Our questionnaire includes two measures of participants’ trust placed into fellow citizens living in the same district. The first item was: “If you needed help, do you think that a stranger living in your district would help you?” The second item was: “How safe do you feel regarding violence and crime as a pedestrian in your district in the
14The Tages-Anzeiger is one of the largest newspaper in Switzerland with a daily circulation of about
200’000 copies. The article was published in a region specific part of the newspaper (contained in about 50’000 copies). There is the possibility that participants of our original field experiment have also partici-pated in the newspaper study. Unfortunately, we were not able to determine whether there is an overlap, because we had committed to delete the addresses of participants right after the experiment.
evening?” Both these questions were asked only with respect to the participants’ own residential district and are therefore not subject to the potential experimenter demand effect discussed above. If the answers to these two questions reveal a discrimination pattern which is similar to the one observed in the field experiment, this provides evidence against the hypothesis that the results of the field experiment are driven by a demand effect caused by the elicitation of multiple decision per participant.
To facilitate understanding of the experiment the instructions contained more infor-mation about the purpose of the study than it is typically the case in laboratory studies. In particular, parts of our instructions mentioned that people are invited to participate in a “Scientific Study on Trust in the City of Zurich”, explained the relation between the investment decision and trust, and provided a trust based description of the possibility to differentiate across districts. While we are convinced that the explicit trust framing improved the comprehensibility of the instructions, using this context specific language might have affected the participants’ mindset and therewith their decisions. To investigate the empirical relevance of the concern that the trust framing in our instructions shaped the observed discrimination pattern, we conducted an additional laboratory experiment with 178 student participants (the participants were recruited with the online recruiting software ORSEE, Greiner, 2004). All of these participants were in the role of first movers and played against a randomly selected second mover from the original study. The in-vestment decision together with the corresponding repayment decisions determined the participant’s payoff. The second movers were not paid out again. All these procedural de-tails were common knowledge among the participants. The experiment was programmed and conducted with z-Tree (Fischbacher, 2007). Half of our participants received our original instructions using the trust related language, while the other half of the partici-pants received neutral instructions in which we never mentioned trust.15 Comparing the
observed discrimination patterns in the two laboratory experiments with each other as well as the pattern observed in our original field experiment allows to cleanly isolate the effect of the trust related language in the instructions on observed trust discrimination.
3
Results
We first investigate prevalence and determinants of trust discrimination across districts. We then explore the systematics behind the variation and analyze the nature of the discrimination process by relating districts’ reputations to their actual level of trustwor-thiness. In a third step we investigate in-group aspects of trust decisions.
3.1
Trust Discrimination Across City Districts
Our first result summarizes our findings regarding the first mover trust decisions.
Result 1 (Trust and discrimination) On average first movers reveal a relatively high
willingness to trust and invest about 66 percent of their endowment. However, trust levels differ systematically across the residential districts of second movers, i.e., there is trust discrimination across districts.
Support for Result 1 comes from Figure 2 and Tables 4 and 5. Figure 2 shows a his-togram of all investment decisions of first movers.16 The amounts invested are comparable
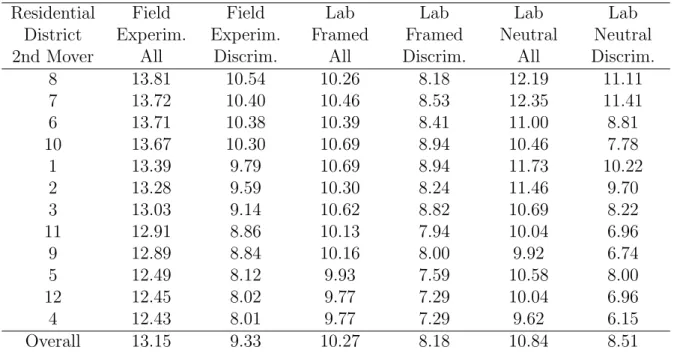
to what has been observed in laboratory studies (see, e.g., Camerer (2003), p. 86, and the references therein) and reveal that the citizens of Zurich display a relatively high level of trust towards their fellow citizens. On average, first movers invest 13.15 Swiss Francs (see the first column of Table 4), which corresponds to 66 percent of their endowment, with a standard deviation of 7.08.17 If we collapse our data and examine the distribution
of average investments per first mover, we observe an average investment of 13.14, with a standard deviation of 6.51. This indicates that there are substantial cross-individual differences in the baseline trust level. Most of the variation in individual investment de-cisions comes from inter-individual differences in trust rather than from intra-personal differentiation across potential residential districts.
The first column of Table 4 shows the overall average investment level, and average investments conditional on the 12 possible residential districts of second movers. For a better readability the districts are ordered by the level of received investments. The table reveals that there is variation in the level of received investments. The district with the lowest average investment, e.g., is district 4 while the district that received the highest investment is district 8. In terms of magnitude the variation between lowest and highest investments is 11 percent. Thus, the mere fact that someone lives in a district with a low vs. a high reputation, induces first movers to reduce their investments substantially. This
16Since we used the strategy method to collect the decisions, each first mover made 12 investment
decisions, one for each of the possible residential districts of the second mover. All these decisions are included in Figure 2.
17Our questionnaire also includes the GSS trust question, which is the most commonly used
measure-ment of trust in research on social capital (see the introduction for more details). Previous research found that the GSS trust question does not have a significant predictive value for behavior of first movers in a trust game (see, e.g., Glaeser et al., 2000; Lazzarini et al., 2005). In our data the GSS trust question is a significant predictor for first mover investment. However, while the previous studies elicited the responses to the trust question three to four week before the experiment, the participants completed the experiment and the questionnaire at the same time in our case. Accordingly, we cannot exclude that our results are affected by a desire for consistency (see also, Falk and Zimmermann, 2012).
finding suggests that there is variation in social capital across districts.18
Based on the expected back transfers indicated by first movers on their decision sheet we are able to calculate expected returns on investment = expected back transferinvestment −1
for each district.19 The resulting levels vary substantially, from 0.15 in districts 4 and 5 to 0.30 in
district 1.20 Moreover, at the district level investments and expected returns on investment
are strongly positively correlated, suggesting different levels of investments are driven by different expectations concerning the districts’ levels of trustworthiness (Spearman’s rho = 0.89, p < 0.001).21 This finding reinforces the notion that differences in received
investments represent variations in social capital across districts. First movers invest more into districts where they expect higher repayments, i.e., the investment pattern is shaped by districts’ reputation regarding trustworthiness.
These differences at the aggregate level are the result of the investment behavior of the 54 percent of first movers who discriminate. 46 percent of first movers do not discriminate and send the same amount into each district. On average discriminating first movers make substantially lower investments than non-discriminating first movers (discriminators: 9.33 Swiss Francs, non-discriminators: 17.68 Swiss Francs). The reason for this substantial difference is that a large fraction (75 percent) of the non-discriminating first movers actually invest the maximum amount irrespective of the residential district of the second mover. The second column of Table 4 displays average investments only for those first movers who do discriminate. Restricting observations to discriminating first
18We sent out the same number of letters to each district. However, since participation in the
exper-iment was voluntary, the actual number of participants varies across districts (Participants per district: 1 (79), 2 (95), 3 (72), 4 (64), 5 (87), 6 (95), 7 (100), 8 (86), 9 (66), 10 (101), 11 (69), 12 (70)). Not surprisingly, the participation rates are significantly correlated with some of the district characteristics
(Spearman correlations: Income (rho = 0.84, p <0.001), High education (rho = 0.69, p = 0.01),
For-eigners (rho = -0.84, p = 0.01), Home ownership (rho = 0.72, p<0.01)). Thus, districts with a higher
economic and social status and less heterogeneity are overrepresented in our sample. If in-group effects are relevant, the unequal distribution of participants could potentially affect our results on discrimination. For example, as first movers from districts 8 are over-represented in our sample, the high investments into district 8 may simply be a consequence of the in-group bias of people in district 8. To exclude the potentially confounding effects of in-group effects, we repeated the whole analysis of this section without investments into own districts. We find that all our results remain qualitatively unchanged. Regarding Result 1, taking out investments into own districts only slightly changes the discrimination pattern ob-served in Table 4, such that average investments with and without the observations into own districts are highly correlated (Spearman’s rho = 0.90, p<0.001).
19We calculate the expected return on investment for each single positive investment decision of first
movers. In cases where investments are zero, no meaningful values can be calculated. These observations are therefore neglected (7 percent of our observations contain investments equal to zero; in 91 percent of these cases expected back transfers are zero as well).
20The expected returns on investments for the 12 residential districts of second movers are: 1 (0.30), 2 (0.23), 3 (0.24), 4 (0.15), 5 (0.15), 6 (0.24), 7 (0.25), 8 (0.25), 9 (0.19), 10 (0.23), 11 (0.17), 12 (0.16).
21If investments into own districts are excluded from the analysis, the correlation between investments
movers accentuates the discrimination pattern and reveals a difference of more than 30 percent between the lowest and highest investments (district 4 vs. district 8).
Since first movers not only state their investment decision for each district but also their belief about the second mover’s back transfer, we can also check whether first movers who do not discriminate, i.e., who send the same amount to all districts expect different back transfers from each district. We find that among those first movers who do not discriminate, 37 percent indicate varying beliefs, i.e., they expect district specific levels of trustworthiness. When we compare this belief based ranking with the one that results from the differences in investments (see Table 4) we find a positive and significant correlation (Spearman’s Rho = 0.59; p = 0.041). This finding further supports the systematics of discrimination across different districts.
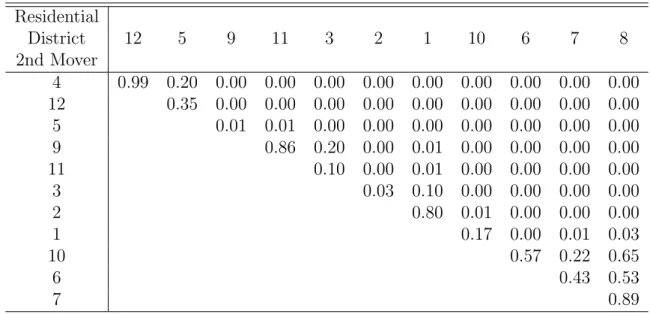
Table 5 reveals that the investment differences observed in the field experiment (see first column of Table 4) are significant for most district comparisons. This table reports the p-values of Wilcoxon-signed-rank tests conducted for pairs of districts. Districts are sorted by the level of received average investment. For example, investments into districts 4 and 12, the two districts with the lowest reputation, are not significantly different. Neither are districts 4 and 5 significantly different. However, from district 9 up to district 8, all districts received significantly higher investments than district 4. In total we find that out of the 66 possible comparisons, 51 are significant at least at the 5 percent level.22,23
3.2
Robustness Checks on Trust Discrimination
In this section we present the results of our robustness checks. A first test for the system-atics of the ranking of district with regard to trust decisions is to test whether inhabitants of Zurich are able to predict the pattern. This is what we did in our newspaper study. We asked the readers of a large daily newspaper from Zurich to assess which are the two dis-tricts that received the lowest and highest investments, respectively. 281 readers took part in this incentive compatible study. Their answers are shown in Figure 3. The gray bars indicate the fraction of readers who think that a specific district is among the two districts that received the lowest investments, the black ones represent the respective fraction of readers concerning the two districts with the highest reputation. Districts are displayed on the horizontal axis, ordered according to the actual level of received investments. Figure 3 shows that the newspaper readers predicted the outcome of the experiment extremely well. For example, almost 70 percent think that district 4 is among the two districts
22The same comparisons remain significant if we ignore investments into own districts.
23An alternative way to show the significance of the investment differences across districts is to simply regress first mover investments on district dummies (robust standard errors, clustering on individuals). An F-Test shows that district differences are jointly significantly different from zero (p<0.0001).
receiving the lowest investments and about 50 percent think that this holds for districts 12 and 5, respectively. Almost nobody believes that districts 3 or higher (in terms of ac-tually received investments) are among the two lowest districts. Likewise almost nobody believes that districts 3 or lower (in terms of received investments) belong to the group of districts that are among the two districts that received the highest investments. The correlation between the rank order resulting from the answers of the newspaper readers and actual investment ranks is strong and highly significant. For answers concerning the two high investment districts the respective Spearman’s rho is 0.89 (p <0.001) while for the two low districts it is -0.91 (p<0.001).24 Since we use an elicitation method which is
quite different from the one used in our field experiment, the results from the newspaper study provide strong and independent evidence that districts in Zurich differ significantly and systematically in their perceived trustworthiness.
In our second robustness check we use questionnaire data to respond to the potential concern that the salience of the district variable in the procedure of collecting multiple investment decisions from first movers may have induced an experimenter demand effect which triggered discriminatory behavior that would not have been observed otherwise. We make use of two questionnaire measures of participants’ trust placed into fellow citizens living in the same district. Since both questions were asked only with respect to the participants’ own residential district, they are not subject to the potential demand effect discussed above. The first question was: “If you needed help, do you think that a stranger living in your district would help you?” Participants could answer “Yes” or “No”. We find a significantly positive correlation between the fraction of people who say “Yes” in response to this question in a district and the received investment of the respective district (Spearman’s rho = 0.56, p = 0.059). The second question was: “How safe do you feel regarding violence and crime as a pedestrian in your district in the evening?” Participants’ responses to this question were elicited on a four-point scale ranging from “very safe” to “very unsafe”. Again we find a significantly positive correlation between the fraction of people who answer “very safe” or “rather safe” and the received investment of the district (Spearman’s rho = 0.67, p = 0.017).
Our third robustness check, finally, addresses the concern that the trust framing used in our instructions for the participants of the field experiment might have induced a specific mindset among our participants which influenced the observed discrimination pattern. To investigate the impact of the trust framing we conducted a laboratory experiment in which 178 student participants participated in the role of first movers. Each of these
24Without investments into own districts the corresponding rank correlations are 0.82 (p = 0.001) and
participants knows that his investment decision is matched with the decision of a second mover who has participated in our original field experiment. Our laboratory experiment consists of two treatments. Half of the participants receive the original instructions with the trust related language, the other half of the participants receive neutral instructions. Since many students at the University of Zurich have only recently moved to Zurich or do not live in the city at all, we have also asked the students how well they know the city of Zurich. People could select one of three answers: “not very well”, “relatively well”, and “very well”. 64.5 percent of the participants answered that they know the city either “relatively well” or “very well”. In the following we analyze behavior of these subjects. Columns 2 to 6 of Table 4 report the first mover investments in our laboratory experiment. A comparison of overall investment levels across our field experiment and the two treatments of the laboratory study shows that the first movers in the laboratory invest smaller amounts (see Table 4). A simple OLS regression of first mover investments on two dummy variables identifying observations stemming from our two laboratory conditions reveals that both laboratory treatments exhibit significantly lower investment levels than the field experiment (Neutral: p = 0.019, Framed: p = 0.002, based on standard errors clustered at the individual level). The difference between the two laboratory conditions is, however, not significant (F-Test: p = 0.656). The lower investment level in the labo-ratory experiments may be a consequence of the fact that the investment decision in the laboratory setting only affected the first mover’s own payoff. Since first movers played against a randomly selected second mover of the original field study who was not paid again, altruism could not play a role.
However, since we are not primarily interested in investment levels, but rather how first movers differentiate between second movers from different districts, the most important finding of our laboratory experiment is that both laboratory treatments yield patterns of trust discrimination which are highly correlated with the pattern observed in our field experiment (Spearman correlations: Neutral: rho = 0.830, p < 0.001, Framed: rho = 0.716, p = 0.008). The fact that a laboratory replication with students yields very similar results to the field experiment with the general population of Zurich provides very strong evidence for the robustness of our results. In addition, the laboratory study confirms that the discrimination pattern observed in the field experiment is not an artifact if the trust framing in the instructions.25
25Including the people who indicated that they know the city “not very well” does not change our
results qualitatively: Average investments are: 10.28 (neutral), 10.56 (framed). Spearman correlations
with the discrimination pattern in the field experiment are: rho = 0.890, p <0.001 (neutral), rho =
3.3
Determinants of Trust Discrimination
In this section we explore the determinants of trust discrimination at the district level. The two rows at the bottom of Table 2 show how district characteristics are correlated with mean investments into districts together with the corresponding p-values of Spearman rank tests in brackets. All coefficients have the sign suggested by the relevant literature (see section 2.2). Both measures of economic status exhibit a significantly positive corre-lation with investments, i.e., the richer a district or the better educated its inhabitants, the higher its reputation measured in terms of received investments. Likewise, there is a significant correlation between the heterogeneity of the population and received invest-ments of a district: the higher the fraction of foreigners and the higher the level of religious fragmentation, the lower is the trust reputation of a district. We do not find a correlation between mobility and trust reputation. The small positive correlation between years of residency and received investments is not significant.26,27
Table 6 explores the determinants of trust decisions in more detail. It shows OLS-regressions where first mover investments are regressed on district specific characteristics. The dependent variable contains 12 investment decisions per first mover. However, since we regress individual decisions on aggregate data, we need to account for the possibility that the regression disturbances are correlated within receiving districts (Moulton, 1990). This implies that we have to adjust our standard errors for clustering at the receiving district level. Note that therefore it makes no sense to run multivariate regressions, regressing investments on all district characteristics simultaneously. Not only are most of the district characteristics highly correlated (see Table 3), but there are only 12 districts to identify the effects. We therefore chose the following estimation strategy. We first regress investments on income, i.e, the district characteristic that is most strongly correlated with received investments (see Table 2). In Columns (2) to (5) of Table 6 we include all other district characteristics but only one at a time. It turns out that income remains always highly significant. When controlling for income the only variable which is also significantly correlated with investments is high education, all other variables are insignificant. The results therefore suggest that economic status is the major determinant of a district’s perceived trustworthiness.28 We summarize these findings in our second result:
26As discussed in section 2.2, the positive correlation between home ownership and received investments is probably not related to mobility.
27The same correlations remain significant if we exclude investments into own districts.
28The estimations reported in Table 6 are based on OLS estimations including individual fixed effects
for first movers. We also estimated the same set of regressions without individual fixed effects. This does not change the results. In addition, the results are also robust if we use Tobit estimates to account for censoring.
Result 2 (Determinants of trust discrimination) First movers make higher invest-ments to second movers who live in districts characterized by higher economic status.
3.4
Second Mover Behavior
We now turn to the behavior of second movers. We first study whether second movers reciprocate the trust of first movers. In a second step we explore how well the trust displayed by first movers reflects the actual trustworthiness of second movers.
Result 3 (Back transfers) On average, second movers show reciprocal behavior: the
higher first mover investments, the higher are back transfers. Moreover, the level of back transfers exceeds first movers’ expectations.
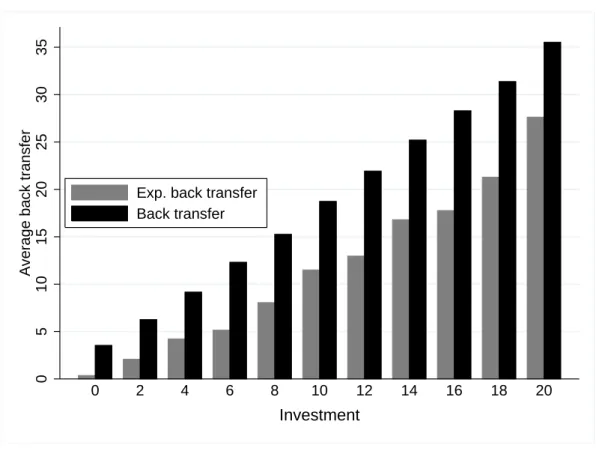
Support for Result 3 comes from Figure 4. It shows averages of expected and actual second mover back transfers for each possible first mover investment. The dark bars show the reciprocal repayment pattern of second movers. It is obvious from Figure 4 that higher investments are reciprocated with higher back transfers. Moreover, the extent of reciprocation is quite high. Compared to student populations where the returns on investment are often close to zero (see, e.g., Camerer (2003), p. 86, and the references therein), second movers from our non-student subjects pool reveal a relatively strong reciprocal inclination. For example, second movers are willing to send back about 35 Swiss Francs if they received 20 Francs. This means that they almost equalize final payments. Over the whole range of investments the slope between investment and pay backs estimated from a simple OLS-regression is about 1.6.
Figure 4 also shows that first movers expect reciprocation on the side of the second movers (gray bars). The more they invest, the more they expect to get back. They also expect to get back more than they invest. For example, those who send 20 Swiss Francs expect a back transfer of 27 Francs, on average. Comparing expectations and actual back transfers reveals that the average level of reciprocation is systematically higher than expected by first movers. In other words first movers generally underestimate the level of reciprocation that is prevalent in the population of Zurich.
Turning to second mover behavior on a district level, we now check whether recipro-cation varies across districts and, in particular, whether there is a correlation between investments and the level of reciprocation:
Result 4 (Correlation of trust and trustworthiness) Different levels of investment
into districts as well as expected returns on investment are both significantly correlated with the respective willingness to repay. This indicates that first movers correctly anticipate the
relative trustworthiness of inhabitants of different districts and discriminate on the basis of this belief.
We know already that investments into districts correspond to different levels of ex-pected returns on investment (see section 3.1). This indicates that investments reflect different levels of expected trustworthiness. In this section we go a step further and ask whether investments and expected returns are correlated with back transfers, i.e., we in-vestigate whether the observed trust discrimination merely represent mistaken stereotypes or whether they are justified in terms of different levels of actual trustworthiness.
To assess a district’s trustworthiness we aggregate people’s back transfers in a given district. To do so, we cannot only use those back transfers that were actually made, because even if reciprocal inclinations across districts were identical, we would find that districts that receive high investments return more than districts that receive low in-vestments. Instead we use data from the contingent response method, which informs us about the willingness to reciprocate for any level of investment. In a first step, we calculate for each subject the relation between investment and back transfer: running simple individual-level OLS regressions of back transfer on investment and forcing the slope through the origin we get an estimate of a subject’s reciprocal inclination.29 The
higher the estimated coefficient the more sensitive is a second mover’s reaction to varying levels of investments. In a next step, we calculate the averages of these slopes for every district. The resulting variation is substantial and ranges from about 1.4 to about 2.
Figure 5 displays how these district averages are associated with average investments into the respective districts. The numbered dots represent the 12 districts, the dashed line is a weighted linear trend. Figure 5 shows that investments and back transfers are positively and significantly correlated on a district level (Spearman’s rho = 0.63, p = 0.028). Moreover, mean trustworthiness of districts is also correlated with expected returns on investment. The respective Spearman rank correlation between expected return on investment and average level of reciprocation on a district level is 0.69 (p = 0.012).30
This brings us full circle: first movers hold particular beliefs about the trustworthiness of different districts, which determine their trusting decisions. These beliefs are significantly correlated with average actual trustworthiness.
29We also estimated reciprocal inclinations using individuals’ average back transfers for all possible
investments. Qualitatively this yields the same result.
30Without investments into own districts the corresponding rank correlations between investments resp.
3.5
In-Group Aspects of Trust Discrimination
A further important aspect of a district’s social capital is the within district perception of trustworthiness. Residential neighborhoods are the place where many people spend a large fraction of their lives and where many of their daily interactions take place. There are two main reasons why inhabitants of a district may differentiate between fellow citizens in the same district and people who live outside the district when they make trust decision. First, insiders may have superior information regarding the behavior of their neighbors. This may help them to form a more accurate belief about their fellow citizens behavior. Second, there may be in-group favoritism, i.e., people may have a tendency to favor trading partners who belong to their own group. In social psychology the prevalence of in-group favoritism is well established (for reviews, see e.g., Tajfel and Turner, 1986; Deaux, 1996; Hogg, 2002). However, most social psychology experiments on in-group effects focus on simple allocation tasks where the decision maker allocates resources among others without affecting his own payoff. In the context of trust decisions, in contrast, the literature is yet quite inconclusive about the importance of in-group favoritism.31
Our main findings are summarized in the following result:
Result 5 (In-group aspects of trust discrimination) We observe a pronounced
in-group effect in trust. First movers invest significantly higher amounts into their own districts compared to other districts. The in-group effect is, at least in part, driven by the fact that people have higher and more accurate beliefs regarding the repayment behavior of their in-group members.
In most studies on in-group effects participants face just two groups: the in-group and the out-group. In our study, in contrast, there are 11 heterogeneous out-groups. Accordingly, in-group versus out-group evaluations can be performed in different ways. We start with a simple comparison at the district level. One fact that supports Result 5 is that 11 out of the 12 districts invest more to their own district than they invest to all other districts on average. The exception is district 4, the district with the lowest 31In trust experiments using the minimal group paradigm there exists evidence for (see Yamagishi et al., 1999) and against (see, e.g., Buchan et al., 2006; G¨uth et al., 2005) the relevance of an in-group bias. In experiments using natural groups the evidence is also mixed. There are several papers investigating trust discrimination across nationalities, races or ethnicities (see, e.g., Fershtman and Gneezy, 2001; Glaeser et al., 2000; Bouckaert and Dhaene, 2004; Haile et al., 2008). All these papers find no or only weak evidence for in-group favoritism. In other experiments participants in trust game experiments are informed about the gender of the other player (see, e.g., Buchan et al., 2003; Bohnet and Greig, 2008). Also these papers do not confirm the relevance of in-group favoritism in trust. Two exceptions that provide evidence in favor of in-group favoritism in trust decision among natural groups are Bernhard et al. (2006) (clans in
level of overall received investments (see Table 4). Finding this outcome by chance (i.e., in the absence of an in-group effect) is very unlikely (binomial test, p < 0.01). Even stronger evidence for the relevance of in-group effects at the district level comes from the observation that the inhabitants of 9 out of the 12 district invest on average more into their own district than into any of the 11 other districts. In two of the remaining three districts (district 10 and district 11) the own district ranks second with regard to the investment level. Again, district 4 is the exception.
We now move to the individual level. If we only consider the 54 percent of first movers who vary their investments across different residential districts of second movers, we observe that 77.9 percent of them invest strictly more into their own district than they invest on average to the other districts. Moreover, for 56.8 percent of them the own district is among the districts who receive the highest investment present in their set of investment decisions.32
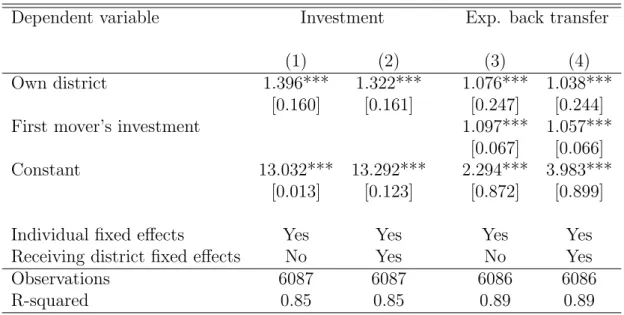
In Table 7 we explore the in-group effect in more detail. In the first column we regress first movers’ investments on a dummy for own district, which takes value 1 if the particular investment is meant for the own district and 0 otherwise (the regression includes individual fixed effects and standard errors are adjusted for clustering at the individual level). The coefficient of the own district dummy is positive and significant. On average they invest 1.40 Swiss Francs more into their own district, which is about 10 percent more than they send on average into the other districts. In column (2) we also include fixed effects for each receiving district. The fact that the coefficient of the own district dummy is only slightly smaller and remains highly significant shows that the observed in-group effect is not a consequence of the unequal distribution of participants across districts.33
It turns out that the observed in-group effect in trust is not simply a result of a desire to be generous to in-group members, but is, at least in part, driven by different expectations about trustworthiness. In column (3) we regress expected back transfers on the own district dummy. In addition we control for investments and include individual fixed effects. The dummy coefficient is positive and significant. This result also holds when we include fixed effects for receiving districts in column (4). The positive coefficient of the own district dummy suggests that the in-group effect is partly explained by different expected levels of trustworthiness: for a given investment, subjects believe that back transfers are 1.08 Francs higher if they interact with strangers from their own district
32Among the first movers for whom the highest investment in their set of decisions only applies to one
single district, 45.7 percent make the highest investment into their own district.
33The estimations reported in Table 7 are based on OLS estimations including individual fixed effects
for first movers. We also estimated the same set of regressions without individual fixed effects. This does not change the results. In addition, the results are robust if we use Tobit estimates to account for censoring.
compared to interactions with strangers from other districts.
Next, we examine whether these higher in-group beliefs are more accurate than the belief of outsiders. From Figure 4 we know that, in general, first movers systematically underestimate second movers’ willingness to repay. If we redo the analysis underlying Figure 4 considering only investments into the own district, we find that in-group beliefs also underestimate the second movers’ true willingness to repay for all investment levels. In fact, regression analysis reveals that in-group beliefs are not significantly less likely to underestimate the true willingness to repay relative to out-group beliefs.34 However,
comparing the size of differences between beliefs and actual average repayments reveals that in-group beliefs are significantly more accurate than out-group beliefs. To show this, we calculate for each first mover investment decision the absolute difference between belief and the average repayment observed for this investment level in the respective target district. We regress this difference on a dummy for own district and control for the investment level. The significantly negative coefficient of the dummy for own district indicates that the absolute difference between beliefs and actual repayments is lower for in-group decisions than for out-group decisions.35 These findings indicate that people are
more optimistic and better informed regarding the trustworthiness of their fellow citizens from their own district (relative to the trustworthiness of average citizens).36
4
Concluding remarks
This paper reports evidence from a city-wide field experiment on trust. We find that peo-ple discriminate and trust strangers from different districts differently. Our data reveal that first movers hold particular beliefs about the trustworthiness of different districts, which are associated with their trusting decisions. These beliefs correspond on average with actual trustworthiness. This result implies that first movers know quite a lot about their city and use this information to determine their decisions. As a consequence, first movers invest more into districts that are actually characterized by higher levels of
trust-34Out-group beliefs are lower than the actual average repayment in 78.4 percent of the cases. The
corresponding fraction in in-group beliefs is 76.6 percent. A probit estimation reveals that this difference is not significantly different (p = 0.165, standard errors are adjusted for clustering at the individual level).
35OLS-estimation with standard errors are adjusted for clustering at the individual level: constant =
4.001 (p<0.001), first mover’s investment = 0.419 (p<0.001), own district = -0.447 (p = 0.039). 36Based on our data we cannot completely rule out the possibility that the difference in beliefs between in- and out-groups reflects a bias in itself. However, a more in-depth analysis of the distribution of differences between beliefs and actual repayments reveals the following: While differences representing underestimations of repayments are significantly smaller for in-group decisions, there is no indication that differences representing overestimations tend to become larger. Thus, the observed shift in beliefs is not just a general upward shift, but rather a shift towards the true value.
worthiness.
We also find a strong in-group effect regarding trust discrimination: First movers in Zurich make significantly higher investments when their second mover lives in the same district. This behavior is, at least in part, driven by the fact that first movers have more optimistic and more accurate expectations regarding the repayment behavior of their fellow citizens in the same district. This finding may reflect that people know more about the behavioral patterns of people belonging to groups with whom they interact on a regular basis. The in-group effect has also important methodological implications. Our data shows that even within the context of a single city the particular reference group that people have in mind when they think about trust and trustworthiness makes a big difference. Thus, future studies relying on survey based measures of trust (e.g., the GSS trust question) should make sure that they tightly specify the group of people the participants should think about. Otherwise, differences in interpretation of who is meant by the imprecisely described reference group “other people” may severely bias the results. The experimental design may also be of interest for policy makers who seek to identify areas suffering from low social capital. Our study indicates that socio-economic status, as proxied with income and level of education, is a key-driver for social capital. If this data is available on a fine level of geographic resolution it may in fact be possible to rely directly on socio-economic statistics. However, often this information is not available, in particular in small geographical units and in developing countries. Moreover, in culturally different countries, socio-economic status may not, or not predominantly, depend on income and education but on other factors such as religious affiliation. Our experimental procedure avoids these problems as it directly measures different levels of trust. The methodology is straightforward so that it can easily be applied to any city or region as a simple tool to identify trust discrimination and its determinants.
References
Alesina, A. and La Ferrara, E. (2000). Participation in heterogeneous communities, Quar-terly Journal of Economics 115(2): 847–904.
Alesina, A. and La Ferrara, E. (2002). Who trusts others?, Journal of Public Economics 85(2): 207–34.
Arrow, K. J. (1972). Gifts and exchanges, Philosophy and Public Affairs 1(4): 343–367. Berg, J., Dickhaut, J. W. and McCabe, K. A. (1995). Trust, reciprocity, and social history,
Games and Economic Behavior10(1): 122–42.
Bernhard, H., Fehr, E. and Fischbacher, U. (2006). Group affiliation, trust and social preferences, Mimeo, University of Zurich .
Bohnet, I. and Greig, F. (2008). Is there reciprocity in a reciprocal-exchange economy? ev-idence of gendered norms from a slum in nairobi, kenya,Economic Inquiry46(1): 77– 83.
Bouckaert, J. and Dhaene, G. (2004). Inter-ethnic trust and reciprocity: Results of an ex-periment with small businessmen,European Journal of Political Economy20(4): 869– 86.
Brandts, J. and Charness, G. (2011). The strategy versus the direct-response method: a first survey of experimental comparisons, Experimental Economics14(3): 375–398. Buchan, N., Johnson, E. and Croson, R. (2006). Let’s get personal: An international
examination of the influence of communication, culture, and social distance on other-regarding preferences, Journal of Economic Behavior and Organization 60(3): 373– 398.
Buchan, N. R., Croson, R. T. and Solnick, S. (2003). Trust and gender: An examination of behavior, biases, and beliefs in the investment game, Working Paper, University of Wisconsin School of Business .
Camerer, C. F. (2003). Behavioral game theory: Experiments in strategic interaction, Princeton University Press, Princeton.
Coleman, J. S. (1990).Foundations of social theory, Harvard University Press, Cambridge, Mass.