Appendix A: Brief Guide to
Microsoft Project 2010
Excerpt from An Introduction to Project
Management, Fourth Edition
Provided at no charge in support of U.S. troops!
Go Air Force!
By
Kathy Schwalbe
Professor, Augsburg College
Department of Business Administration
Minneapolis, Minnesota
An Introduction to
Project Management, Fourth Edition
Cover Photo: Dan Schwalbe ©2012 Kathy Schwalbe, LLC ISBN-10: 0982800339
ISBN-13: 978-098-0-982003-3-1
ALL RIGHTS RESERVED. No part of this work covered by the copyright hereon may be reproduced, transmitted, stored, or used in any form or by any means graphic, electronic, or mechanical, including but not limited to photocopying, recording, scanning, digitizing, taping, Web distribution, information networks, or information storage and retrieval systems, except as permitted under Section 107 or 108 of the 1976 United States Copyright Act, without the prior written permission of the author.
Materials from Kathy Schwalbe’s Information Technology Project Management, Sixth Edition, are used with permission from Cengage Learning.
Microsoft and the Office logo are either registered trademarks or trademarks of Microsoft Corporation in the United States and/or other countries. All screenshots from Microsoft products are used with permission from Microsoft.
Information and screenshots from AtTask are used with permission from AtTask, Inc. Information and screenshots from MindView Business are used with permission from MatchWare.
Some of the product names and company names used in this book have been used for identification purposes only and may be trademarks or registered trademarks of their respective manufacturers and sellers.
The material that is reprinted from the PMBOK® Guide, Fifth Edition (©2013 Project Management Institute, Inc., all rights reserved) is used with permission of the Project Management Institute, Inc., 14 Campus Boulevard, Newtown Square, PA 19073-3299, USA. Phone: (610)356-4600. PMI, PMP, and PMBOK are registered marks of the Project Management Institute, Inc.
Published by Kathy Schwalbe, LLC in Minneapolis, MN, July 2012. Minor corrections made in February 2013.
Book stores should email [email protected] to place orders. Also available from www.amazon.com.
Free companion Web site: www.intropm.com
Visit www.kathyschwalbe.com for more information on this and other books by Kathy Schwalbe.
DETAILED TABLE OF
CONTENTS
Note: Page numbers are based on the full text.
Appendix A: Brief Guide to Microsoft Project 2010 ... 378
Introduction ... 379
Project Management Software Reviews ... 379
Basic Features Of Project Management Software ... 382
What’s New In Project 2010 ... 383
Using Project 2010 ... 384
Before You Begin ... 385
Overview Of Project 2010 ... 385
Starting Project 2010 And Understanding The Main Screen Elements... 386
Using Project Help And The Project Web Site ... 387
Exploring Project 2010 Using An Existing File ... 389
Project 2010 Views ... 391
Project 2010 Reports ... 393
Project 2010 Filters ... 395
Creating A New File And Entering Tasks In A Work Breakdown Structure ... 397
Creating A New Project File ... 397
Creating A Work Breakdown Structure Hierarchy ... 400
Creating Summary Tasks ... 401
Numbering Tasks ... 403
Saving Project Files Without A Baseline ... 404
Developing The Schedule ... 406
Calendars ... 406
Entering Task Durations ... 408
Manual And Automatic Scheduling ... 408
Duration Units And Guidelines For Entering Durations ... 409
Entering Task Durations ... 412
Establishing Task Dependencies ... 414
Gantt Charts, Network Diagrams, And Critical Path Analysis ... 418
Project Cost And Resource Management ... 421
Entering Fixed And Variable Cost Estimates ... 421
Entering Fixed Costs In The Cost Table ... 421
Entering Resource Information And Cost Estimates ... 422
Using The New Team Planner Feature... 426
Entering Baseline Plans, Actual Costs, And Actual Times ... 427
Viewing Earned Value Management Data ... 430
Integrating Project 2010 With Other Applications ... 431
Creating Hyperlinks To Other Files ... 433
Discussion Questions ... 435
Exercises ... 435
A
PPENDIX
A:
Brief Guide to Microsoft
Project 2010
Note: This guide was written using the Beta release of Project 2010 and Windows
XP. Your screens may appear slightly different. You can download a free trial of
Project 2010 from www.microsoft.com/project. You can access updated
information as well as the older version of this guide based on Project 2007 on the
companion Web site at www.intropm.com. You can purchase just this new
Appendix from www.intropm.com as a pdf file or as a separate hard-copy text.
Instructors can access this guide based on Project 2010 on the instructor site.
INTRODUCTION
There are hundreds of project management software products on the market today. Unfortunately, many people who own the software have no idea how to use it. It is important to understand basic concepts of project management, such as creating a work breakdown structure, determining task dependencies, and so on before making effective use of this software. Many project teams still use spreadsheets or other familiar software to help manage projects. However, if you can master a good project management software tool, it can really help in managing projects. This appendix summarizes basic information on project management software in general. It also provides a brief guide to using
Microsoft Office Project 2010 (often referred to as Project 2010), the latest version of the most widely used product. Appendix B provides a brief summary of AtTask, the most popular totally online tool.
PROJECT MANAGEMENT SOFTWARE REVIEWS
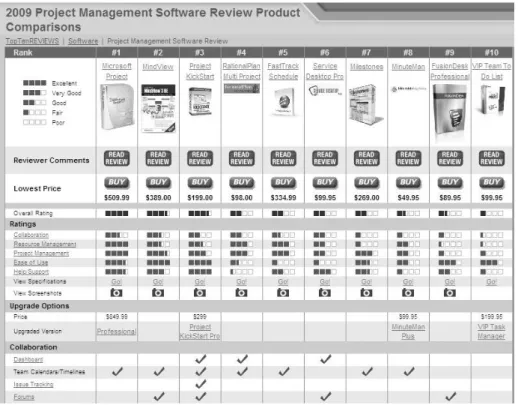
Figure A-1 provides a screen shot showing the top ten project management software products based on a June 2009 review by TopTenReviews™. The products listed in the top ten include:
1. Microsoft Project 2. MindView 3. Project KickStart
4. RationalPlan Multi Project 5. FastTrack Schedule 6. Service Desktop Pro 7. Milestones
8. MinuteMan
9. FusionDesk Professional 10. VIP Team To Do List
Notice that Microsoft Project is number one on the list. Also notice its steep price of over $500 for a single user. Remember that students can purchase Microsoft Project and other software at greatly reduced rates from sites such as www.journeyed.com (only
$139.95 for Project 2010 Standard in July 2012). You can also normally download free trials of Project 2010 and other software products or access them remotely via the Internet with your school’s software license. Check with your school’s IT department for more
Figure A-1. Top ten project management software product comparisons
Below are descriptions of the criteria for comparing the software products:
Collaboration: How information and issues are communicated with project team members, including email, conference calls, meetings, web-based locations and more. Collaboration should be easy to use.
Resource Management: Project management software should
manage and control the resources needed to run a project, such as people, money, time and equipment.
Project Management: The process, practice and activities needed to perform continuous evaluation, prioritization, budgeting and selection of investments are key. Proper project management capabilities provide the greatest value and contribution to the strategic interest of your company.
Ease of Use: All project management software has a learning curve, but the best have functions that are easy to find and simple enough for anyone to use from Day 1, Project 1.
Help/Support: Project management software should offer a
comprehensive user guide and help system. The manufacturer should provide email addresses or telephone numbers for direct answers to technical questions.1
In addition to reviewing project management software in general,
TopTenReviews™ also compared online products in a separate category. These products require an Internet connection for use. Figure A-2 lists the top ten results in June 2009. The top ten products listed include:
1. AtTask (formerly @task) 2. Daptiv PPM 3. Clarizen 4. Project Insight 5. Celoxis 6. Intervals 7. Projecturf 8. Central Desktop 9. Easy Projects NET 10. eStudio
In June 2012, the list changed to the following: 1. Clarizen 2. AtTask 3. Daptiv PPM 4. Tenrox 5. Celoxis 6. EPM Live 7. Easy Projects.net 8. Genius Project for Web 9. Project Insight
10. Liquid Planner
TopTenReviews™ only listed online project management tools in 2012. AtTask held the number one spot in 2009 and the number two spot in 2012. Like most tools in this category, AtTask provides the ability to create Gantt charts, numerous reports and views, project dashboards, and it provides integration with Microsoft Project files. See End Note 2 or visit the Web sites for any of these products and use a free trial version. See Appendix B for more information on using AtTask, particularly using it for portfolio optimization.
Figure A-2. Top ten online project management product comparisons2
BASIC FEATURES OF PROJECT MANAGEMENT
SOFTWARE
What makes project management software different from other software tools? Why not just use a spreadsheet or database to help manage projects?
You can do a lot of project management planning and tracking using non-project management software. You could use a simple word processor to list tasks, resources, dates, and so on. If you put that information into a spreadsheet, you can easily sort it, graph it, and perform other functions. A relational database tool could provide even more
manipulation of data. You can use email and other tools to collaborate with others.
However, project management software is designed specifically for managing projects, so it normally includes several distinct and important features not found in other software products:
Creating work breakdown structures, Gantt charts, and network diagrams: As mentioned in this text, a fundamental concept of project management is breaking down the scope of the project into a work breakdown structure (WBS). The WBS is the basis for creating the project schedule, normally shown as a Gantt chant. The Gantt chart shows start and end dates of tasks as well as dependencies between tasks, which are more clearly shown in a network diagram. Project management software
makes it easy to create a WBS, Gantt chart, and network diagram. These features help the project manager and team visualize the project at various levels of detail.
Integrating scope, time, and cost data: The WBS is a key tool for summarizing the scope of a project, and the Gantt chart summarizes the time or schedule for a project. Project management software allows you to assign cost and other resources to tasks on the WBS, which are tied to the schedule. This allows you to create a cost baseline and use earned value management to track project performance in terms of scope, time, and cost in an integrated fashion.
Setting a baseline and tracking progress: Another important concept of project management is preparing a plan and measuring progress against the plan. Project management software lets you track progress for each task. The tracking Gantt chart is a nice tool for easily seeing the planned and actual schedule, and other views and reports show progress in other areas.
Providing other advanced project management features: Project management software often provides other advanced features, such as setting up different types of scheduling dependencies, determining the critical path and slack for tasks, working with multiple projects, and leveling resources. For example, you can easily set up a task to start when its predecessor is halfway finished. After entering task dependencies, the software should easily show you the critical path and slack for each task. You can also set up multiple projects in a program and perform portfolio management analysis with some products. Many project management software products also allow you to easily adjust resources within their slack allowances to create a smoother resource distribution. These advanced features unique to project management are rarely found in other software tools.
As you can see, there are several important features that are unique to project management software that make them worth using. Next you’ll learn what’s new in Project 2010 and how to use basic features of Project 2010 Standard.
WHAT’S NEW IN PROJECT 2010
Project 2010 is not just a run-of-the-mill update. Microsoft really listened to users
and has revised Project to meet user needs. Learning some of the new features
might seem like a chore, but it is well worth the effort.
If you are familiar with Project 2007, it may be helpful to review some of the new features in Project 2010.
Improved user interface: Project 2010 now includes the “ribbon” interface instead of using the old menus and toolbars similar to Office 2003. Commands are organized in logical groups under tabs, such as File, Task, Resource, Project, View, and Format. The File tab takes you to the new Backstage feature, a one-stop graphical destination for opening, saving, and printing your files. You can
also now right-click on different items, like a table cell or chart, to bring up commonly used commands quickly.
New viewing options: Project 2010 includes several new views. A timeline view is automatically displayed above other views to show you a concise overview of the entire project schedule. You can easily add tasks to the timeline, print it, or paste it into an e-mail. The new team planner view lets you quickly see what your team members are working on, and you can move tasks from one person to another using this view. For example, if a resource is overallocated, you can drag a task to another resource to remove the overallocation. You can also add new columns quickly and use the new zoom slider at the lower right of the screen to zoom your schedule in and out. Also, the tab for viewing and printing reports is easier to navigate with more options for visual reports.
Manual scheduling: Unlike previous versions of Project where tasks were automatically scheduled, Project 2010 uses manual schedule as its default. In past versions of Project, summary tasks were automatically calculated based on their subtasks. Resources were also adjusted automatically. With Project 2010, this is no longer the case. For example, you might want to enter durations for summary tasks and then fill in the detailed information for their subtasks later. When you open a new file, Project reminds you that new tasks are manually scheduled and lets you easily switch to automatic scheduling, if desired. You can also use the new compare versions to see Gantt bars to more clearly see how one version of a project differs from another version.
Improved collaboration: Project 2010 is able to provide an interface with the most popular portals used in industry. Project now uses SharePoint instead of Project Web Access for collaboration. Project Server 2010 also provides integration with Microsoft Exchange 2010 to enable team members to manage and report on tasks directly from Microsoft Outlook. Remember that Project Standard does not include these collaboration features. You must have Project Professional and Project Server to use the enterprise features of Project. Next, you will learn some basic information about Project 2010 and explore the main screen elements and Help facility.
USING PROJECT 2010
Before you can use Project 2010 or any project management software effectively, you must understand the fundamental concepts of project management, such as creating work breakdown structures (WBS), linking tasks, entering duration estimates, assigning resources, and so on. Make sure you read most of this text before using Project 2010 so you understand these concepts. This text provides instructions for using the stand-alone version of Project 2010 known as Project Standard. Project Professional and the Enterprise version of Project require special server software to perform online and collaborative functions. Consult Microsoft’s Web site for detailed information on other products.
Before You Begin
This appendix assumes you are using Project 2010 with Windows XP, Vista, or Windows 7 and are familiar with other Windows-based applications. Check your work by reviewing the many screen shots included in the steps, or by using the solution files that are available for download from the companion Web site for this text or from your instructor.
NOTE: You need to be running Windows XP, Vista, or Windows 7 to use Project 2010. It does not run on Macintosh computers or other operating systems. Most organizations have Project 2010 as part of their license if they have Office 2010. You can download a free trial from www.microsoft.com/project. Students can purchase a full version of Project Standard from sites like www.journeyed.com at a discount.
This appendix uses a fictitious project—Project A+—to illustrate how to use the software. The WBS for Project A+ uses the five project management process groups as level 2 items (initiating, planning, executing, monitoring and controlling, and closing). Standard deliverables under each of those process groups are included, as described in this text. Each section of the appendix includes hands-on activities for you to perform.
NOTE: To complete the hands-on activities in the appendix, you will need to download files from the companion Web site for this text (www.intropm.com) to your computer. When you begin each set of steps, make sure you are using the correct file. Before you begin your work you should have Customer Feedback.mpp file. Save the files you create yourself in a different folder so you do not write over the ones you download.
In addition, you will create the following files from scratch as you work through the steps:
wbs.mpp
schedule.mpp
You will also use the following file to create a hyperlink:
stakeholder_register.doc
Next you will learn how to start Project 2010, review the Help facility and a template file, and begin to plan Project A+.
Overview of Project 2010
The first step to mastering Project 2010 is to become familiar with the major screen elements and the Help facility. This section describes each of these features.
Starting Project 2010 and Understanding the Main Screen Elements
To start Project 2010:
1. Open Project 2010. Click the Start button on the taskbar, point to All Programs
in Windows XP or Programs in Vista or Windows 7, point to Microsoft Office, and then click Microsoft Office Project 2010. Alternatively, a shortcut or icon might be available on the desktop; in this case, double-click the icon to start the software.
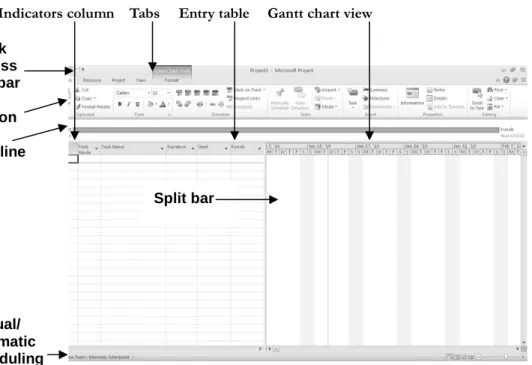
2. Maximize Project 2010. If the Project 2010 window does not fill the entire screen as shown in Figure A-3, click the Maximize button in the upper-right corner of the window.
Indicators column Tabs Entry table Gantt chart view
Figure A-3. Project 2010 main screen
Project 2010 is now running and ready to use. Look at some of the elements of the screen.
The Ribbon, tabs, and Quick Access toolbar are similar to other Office 2007 or 2010 applications.
The timeline view is displayed below the ribbon.
The default manual scheduling for new tasks is on the lower left of the screen. You can click that option to switch to automatic scheduling.
Quick Access Toolbar Ribbon Timeline Manual/ automatic scheduling Split bar
The default view is the Gantt chart view, which shows tasks and other information as well as a calendar display. You can access other views by clicking the View command button on the far left side of the ribbon.
The areas where you enter information in a spreadsheet-like table are part of the Entry table. For example, you can see entry areas for Task Name, Duration, Start, and Finish.
You can make the Entry table more or less wide by using the Split bar. When you move the mouse over the split bar, your cursor changes to the resize pointer. Clicking and dragging the split bar to the right reveals other task information in the Entry table, including Predecessors, Resource Names, and Add New columns.
The column to the left of the Task Name column in the Entry table is the Indicators column. The Indicators column displays indicators or symbols related to items associated with each task, such as task notes or hyperlinks to other files.
Notice that when Project 2010 starts, it opens a new file named Project1, as shown in the title bar. If you open a second file, the name will be Project2, and so on, until you save and rename the file.
Using Project Help and the Project Web Site
You can access information to help you learn how to use Project 2010. Figure A-4 shows the detailed list of topics available from Project Help. You can access help by Pressing F1 or clicking on the question mark/help icon on upper right side of the ribbon. Remember this feature requires an Internet connection.
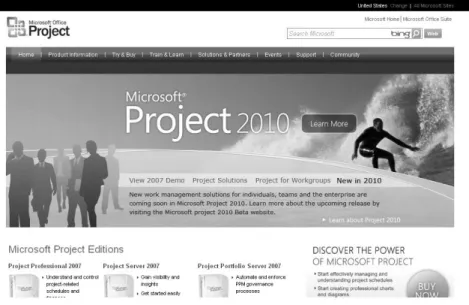
Microsoft provides a number of resources on its Web site to help you learn how to use Project 2010. They provide product information, help and how-to guides on various versions of Project, training information, and templates. Microsoft’s Web site for Project 2010 (www.microsoft.com/project) provides files for users to download, case studies, articles, and other useful materials. Figure A-5 shows a screen shot of this Web site from March 2010. See the companion Web site for this text for updated information on Project and other resources.
Figure A-5. Microsoft Office Project web site (www.microsoft.com/project)
Many features in Project 2010 are similar to ones in other Windows programs. For example, to collapse or expand tasks, click the appropriate symbols to the left of the task name. To access shortcut items, right-click in either the Entry table area or the Gantt chart. Many of the Entry table operations in Project 2010 are very similar to operations in Excel. For example, to adjust a column width, click and drag or double-click between the column heading titles.
Next, you will get some hands-on experience by opening an existing file to explore various screen elements. Project 2010 comes with several template files, and you can also access templates from Microsoft Office Online or other Web sites.
EXPLORING PROJECT 2010 USING AN EXISTING
FILE
To open a file and adjust Project 2010 screen elements:
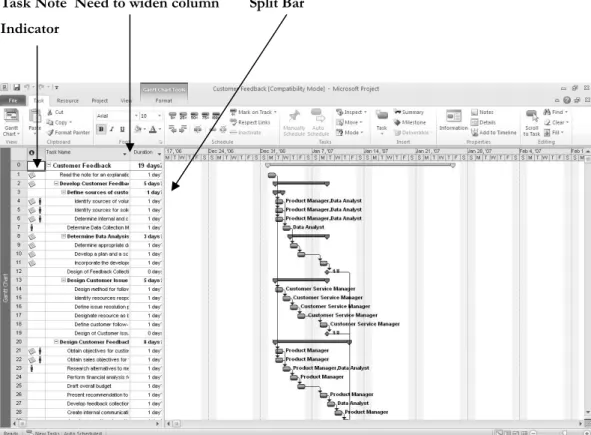
1. Open an existing file. Click the File tab, then select Open, andbrowse to find the file named Customer Feedback.mpp that you copied from the companion Web site for this text (www.intropm.com), and then double-click the filename to open the file. (This file is a template file that comes with Project 2007 where it is called Customer Feedback Monitoring.) Your screen should resemble Figure A-6.
Task Note Need to widen column Split Bar Indicator
Figure A-6. Customer Feedback.mpp file
2. Widen the Task Name column. Move the cursor between the Task Name and Duration column, then double-click to widen the Task Name column so all of the text shows.
3. Move the Split Bar. Move the Split Bar to the right so only the entire Task Name column is visible.
4. View the first Note. Move your mouse over the yellow Notessymbol in the Indicators column for Task 2and read its contents. It is a good idea to provide a short note describing the purpose of project files.
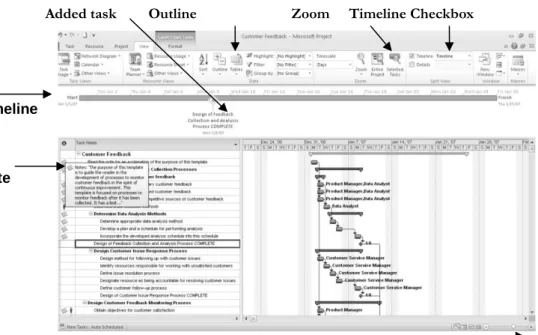
5. Add the Timeline and a task to it. Check the Timeline box under the View tab, Split View group. If you cannot see the entire project schedule, as shown in Figure A-7, click the Zoom button or Zoom slider to make adjustments. Click on the Task Name for Task 12, click the Task tab, and then click the Add to Timeline
button under the Properties group.
Added task Outline Zoom Timeline Checkbox
Figure A-7. Adjusted Customer Feedback.mpp file
To show different WBS levels:
1. Select Outline Level 1 to display WBS level 2 tasks. Click the Outline button’s list arrow, and then click Outline Level 1. Notice that only the level 2 WBS items display in the Entry table. The black bars on the Gantt chart represent the
summary tasks. Recall that the entire project is normally referred to as WBS level 1, and the next highest level is called level 2. This view of the file also shows one milestone task in row 45 indicating when the project was completed. Recall that the black diamond symbol on a Gantt chart shows milestones.
Timeline
Note
Zoom Slider
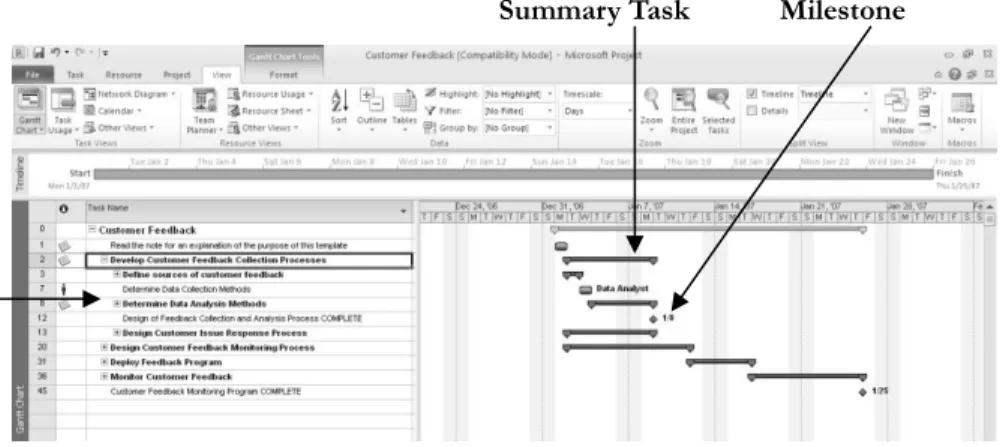
2. Expand a task. Click the expand symbol (the plus sign) to the left of Task 2, Develop Customer Feedback Collection Processes, to see its subtasks. Your screen should resemble Figure A-8. Click the collapse symbol (the minus sign) to hide its subtasks. Experiment with expanding and collapsing other tasks and resizing other columns.
Summary Task Milestone
Figure A-8. Showing part of the WBS on the Gantt chart
3. Close the file without saving. Click the Close icon in the upper right of the window and select No when prompted to save the file.
Project 2010 Views
Project 2010 provides many ways to display or view project information. In addition to the default Gantt chart, you can view the network diagram, calendar, and task usage views, to name a few. These views allow you to analyze project information in different ways. The View tab also provides access to different tables that display information in various ways. In addition to the default Entry table view, you can access tables that focus on data related to areas such as the Schedule, Cost, Tracking, and Earned Value.
To access and explore different views:
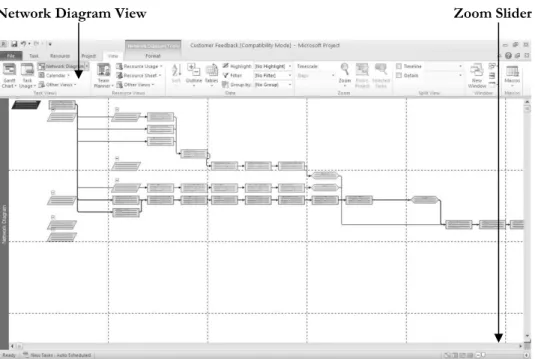
1. Explore the Network Diagram view in the Customer Feedback file. Open the Customer Feedback file again. Click the Network Diagram button under the View tab, and then move the Zoom slider on the lower right of the screen all the way to the left. Your screen should resemble Figure A-9.
Expand/ Collapse Symbols (+/-)
Network Diagram View Zoom Slider
Figure A-9. Network diagram view of customer feedback file
2. Explore the Calendar view. Click the Calendar button (under the Network Diagram button). Notice that the screen lists tasks each day in a calendar format.
3. Examine columns in the Entry table. Click the Gantt Chart button, move the split bar to the right to see all of the available columns, and review the information provided in each column of the Entry table.
4. Change the table view. Click the Tables button under the View tab, and then click
Schedule. Figure A-10 shows the table view options.
5
.
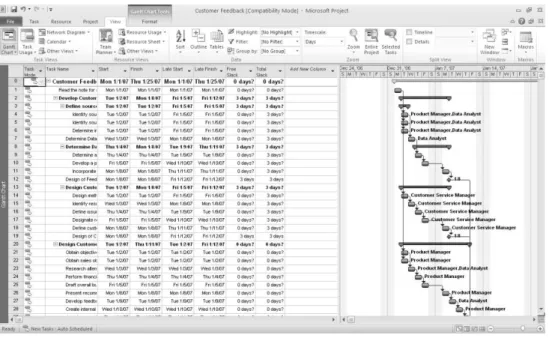
Examine the Table: Schedule and other views. Notice that the columns in the table to the left of the Gantt chart, as shown in Figure A-11, now display more detailed schedule information, such as Task Mode, Task Name, Start, Finish, Late Start, Late Finish, Free Slack, and Total Slack. Also notice that all of the text in the Task Name column is not visible. Remember that you can widen the column by double-clicking the resize pointer to the right of that column. You can also move the split bar to reveal more or fewer columns. Experiment with other table views, thenreturn to the Table: Entry view.
Figure A-11. Schedule table view
Project 2010 Reports
Project 2010 provides many ways to report project information as well. In addition to traditional reports, you can also prepare visual reports, with both available under the Project tab. Note that the visual reports often require that you have other Microsoft application software, such as Excel and Visio. Project 2010 automatically formats reports for ease of printing.
To access and explore different reports:
1. Explore the Reports feature. Click the Project tab,and then click the Reports
Figure A-12. Reports dialog box
2. View the Project Summary report. Double-click Overview from the Reports dialog box, and then double-click Project Summary in the Overview Reports dialog box. Notice that Project 2010 switches to the Backstage (File tab) to make it easy for you to print or share your report, as shown in Figure A-13.
Figure A-13. Previewing the Project Summary report in the Backstage
3. Examine the report and experiment with others. Move the mouse to the right side of the screen to exam the report more closely. Notice that the insertion point now
resembles a magnifying glass. Click inside the report to zoom in or zoom out. Click the Project tab again, and then experiment with viewing other reports. You will use several reports and other views later in this appendix.
4. Close the Reports feature. Click Project tabto return to the Gantt chart view. You can close the file without saving it if you wish to take a break.
Project 2010 Filters
Project 2010 uses a relational database to filter, sort, store, and display information. Filtering project information is very useful. For example, if a project includes thousands of tasks, you might want to view only summary or milestone tasks to get a high-level view of the project by using the Milestones or Summary Tasks filter from the Filter list. You can select a filter that shows only tasks on the critical path if that is what you want to see. Other filters include Completed Tasks, Late/Overbudget Tasks, and Date Range, which displays tasks based on dates you provide. As shown earlier, you can also click the Show button on the toolbar to display different levels in the WBS quickly.
To explore Project 2010 filters:
1. Access filters. Click the View tab, if necessary, and make sure the Customer Feedback file is in the Gantt Chart: Table Entry view. Click the Filterlist arrow (under the Data group), as shown in Figure A-14. The default filter is No Filter, which shows all tasks.
Figure A-14. Using a filter
2. Filter to show critical tasks.Click Critical in the list of filters. Widen the Task Names column, if needed, and move the split bar to see only that column. Notice that the Gantt chart only shows the critical tasks for the project. Your screen should resemble Figure A-15. Recall that the critical tasks are what drive the schedule completion date.
Figure A-15. Critical tasks filter applied
3. Show summary tasks. Select No Filter from the Filter list box to reveal all the tasks in the WBS again. Click the Filter list arrow, and then click Summary Tasks. Now only the summary tasks appear in the WBS. Experiment with other filters.
4. Close the file. When you are finished reviewing the Customer Feedback file, click
Close from the File menu or click the Close button. Click No when asked if you want to save changes.
5. Exit Project 2010. Select Exit from the File tab or click the Close button for Project 2010.
Now that you are familiar with the main screen elements, views, reports, and filters, you will learn how to use Project 2010 to create a new file.
CREATING A NEW FILE AND ENTERING TASKS
IN A WORK BREAKDOWN STRUCTURE
To create a new Project 2010 file, you must first name the project, enter the start date, and then enter the tasks. The list of tasks and their hierarchy is the work breakdown structure (WBS). The file you create could be used for a class project which lasts approximately three months. It uses the project management process groups to organize tasks and includes several deliverables described in this text. You could also modify this file to meet your specific needs.
NOTE:
In this section, you will go through several steps to create a new Project
2010 file named wbs.mpp. If you want to download the completed file to check
your work or continue to the next section, a copy of wbs.mpp is available on the
companion Web site for this text at www.intropm.com. Try to complete an entire
section of this appendix (entering tasks in a work breakdown structure, developing
the schedule, and so on) in one sitting to create the complete file.
Creating a New Project File
To create a new project file:
1. Create a blank project. Open Project 2010. A blank project file automatically opens. The default filenames are Project1, Project2, and so on. (If Project 2010 is already open and you want to open a new file, click the File tab and select a Blank Project.)
2. Open the Project Information dialog box. Click the Project tab, and then click
Project Information to display the Project Information dialog box, as shown in Figure A-16. This dialog box enables you to set dates for the project, select the calendar to use, and view project statistics. The project start date will default to the current date. Note that in Figure A-16 the file was created on 2/24/10 and a Start date of 2/1/10 was entered.
NOTE
:
All dates are entered in month/day/year or American format. You can change the date format by selecting Options from the File tab. Click the date format you want to use in the Date Format box under the General settings. You can also customize the Ribbon, change default currencies in the display, and so on under Project Options.Figure A-16. Project information dialog box
3. Enter the project start date. In the Start date text box, enter 2/01/10. Setting your project start date to 2/01/10 will ensure that your work matches the results that appear in this appendix. Leave the Finish date, Current date, and other information at the default settings. Click OK or press Enter.
4. Access advanced project properties. Click the File tab, and then click Info. Click Project Information on the right side of the screen to access Advanced Properties, as shown in Figure A-17.
date text box
Current date
Advanced Properties
Figure A-17. Accessing advanced project properties
5. Enter advanced project properties Type Project A+ in the Title text box, type Your Name in the Author text box, as shown in Figure A-18, and then click OK. You may have some default information entered in the Project Properties dialog box, such as your company’s name. Click the Task tab so you can see the Entry table and Gantt chart view. Keep this file open for the next set of steps.
Creating a Work Breakdown Structure Hierarchy
As mentioned in Chapter 4 of this text, a work breakdown structure (WBS) is a
fundamental part of project management. Developing a good WBS takes time, and it will make entering tasks into the Entry table easier if you develop the WBS first. For this example, you will use the project management process groups and some key processes and deliverables to create the WBS. You will use the information in Figure A-19 to enter tasks.
1. Initiating 16. Work on deliverable 2 2. Identify stakeholders 17. Work on deliverable 3 3. Stakeholder register completed 18. Deliverable 1 completed 4. Stakeholder management strategy
completed 19. Deliverable 2 completed 5. Prepare project charter 20. Deliverable 3 completed 6. Project charter completed 21. Monitoring and Controlling 7. Prepare for kickoff meeting 22. Track actual hours
8. Kickoff meeting completed 23. Update project documents 9. Planning 24. Progress report 1
10. Prepare draft schedule 25. Progress report 2 11. Gantt chart completed 26. Hold meetings 12. Prepare scope statement 27. Closing
13. Initial scope statement completed 28. Prepare final project report 14. Executing 29. Prepare final presentation 15. Work on deliverable 1 30. Project completed
Figure A-19. Task list for Project A+
To develop a WBS for the project:
1. Enter task names. Enter the 30 tasks in Figure A-19 into the Task Name column in the order shown. Do not worry about durations or any other information at this time. Type the name of each task into the Task Name column of the Entry table, beginning with the first row. Press Enter or the downarrow keyon your keyboard to move to the next row.
HELP:If you accidentally skip a task, highlight the task row, right-click, and select Insert Task. To edit a task entry, click the text for that task, and either type over the old text or edit the existing text.
TIP: Entering tasks into Project 2010 and editing the information is similar to entering and editing data in an Excel spreadsheet. You can also easily copy and paste text from Excel or Word into Project, such as the list of tasks.
2. Adjust the Task Name column width as needed. To make all the text display in the Task Name column, move the mouse over the right-column gridline in the Task Name column heading until you see the resize pointer , and then click the left mouse buttonand drag the line to the right to make the column wider, or double-click to adjust the column width automatically.
This WBS separates tasks according to the project management process groups of initiating, planning, executing, controlling, and closing. These tasks will be the level 2 items in the WBS for this project. (Remember the whole project is level 1.) It is a good idea to include all of these process groups because there are important tasks that must be done under each of them. Recall that the WBS should include all of the work required for the project. In the Project A+ WBS, the tasks will be purposefully left at a high WBS level (level 3). You will create these levels, or the WBS hierarchy, next when you create summary tasks. For a real project, you would usually break the WBS into even more levels to provide more details to describe all the work involved in the project. For example, each deliverable would probably have several levels and tasks under it.
Creating Summary Tasks
After entering the WBS tasks listed in Figure A-19 into the Entry table, the next step is to show the WBS levels by creating summary tasks. The summary tasks in this example are Tasks 1 (initiating), 9 (planning), 14 (executing), 21 (monitoring and controlling), and 27 (closing). You create summary tasks by highlighting and indenting their respective subtasks.
To create the summary tasks:
1. Select lower level or subtasks. Highlight Tasks 2 through 8 by clicking the cell for Task 2 and dragging the mouse through the cells to Task 8.
2. Indent subtasks. Click the Indent Tasks buttonon the Ribbon under the Schedule group of the Task tab (or press Alt + Shift + right arrow) so your screen resembles Figure A-19. After the subtasks (Tasks 2 through 8) are indented, notice that Task 1 automatically becomes boldface, which indicates that it is a summary task. A collapse symbol appears to the left of the new summary task name. Clicking the collapse symbol (minus sign) will collapse the summary task and hide the subtasks beneath it. When subtasks are hidden, an expand symbol (plus sign) appears to the left of the summary task name. Clicking the expand symbol will expand the summary task. Also, notice that the symbol for the summary task on the Gantt chart has changed from a blue to a black line with arrows indicating the start and end dates. The Task Mode has also changed to make this task
Automatically scheduled. You’ll learn more about this feature later. For now, focus on entering and indenting the tasks to create the WBS.
Expand or collapse symbols by
Summary tasks Indent Task Summary task symbol
Figure A-19. Indenting tasks to create the WBS hierarchy
3. Create other summary tasks and subtasks. Create subtasks and summary tasks for the other process groups by following the same steps. Indent Tasks 10 through 13 to make Task 9 a summary task. Indent Tasks 15 through 20 to make Task 14 a summary task. Indent Tasks 22 through 26 to make Task 21 a summary task. Indent Tasks 28 through
30 to make Task 27 a summary task. Widen the Task Name column to see all of your text, as needed.
TIP: To change a task from a subtask to a summary task or to change its level in the WBS, you can “outdent” the task. To outdent the task, click the cell of the task or tasks you want to change, and then click the Outdent Task button (the button just to the left of the Indent Task button). You can also press Alt + Shift + Right Arrow to indent tasks and Alt + Shift + Left Arrow to outdent tasks.
Numbering Tasks
To display automatic numbering of tasks using the standard tabular numbering system for a WBS:
1. Show outline numbers. Click the Format tab, and then click the Outline Number checkbox under the Show/Hide group. Project 2010 adds the appropriate WBS numbering to the task names.
2. Show project summary task. Click the Project Summary checkbox just below the Outline Number checkbox. Scroll to the top of the file to see that a new task has been added under row 0.
3. Adjust the file. Widen the Task Name column and move the split bar so only that column displays. Your file should resemble Figure A-20.
Outline Number and Project Summary Task Check Boxes Outline Numbers Project Summary Task
Saving Project Files Without a Baseline
An important part of project management is tracking performance against a baseline, or approved plan. It is important to wait until you are ready to save your file with a baseline because Project 2010 will show changes against a baseline. Since you are still developing your project file for the Project A+ project, you want to save the file without a baseline, which is the default way to save a file. Later in this appendix, you will save the file with a baseline. You will then enter actual information to compare planned and actual
performance data.
To save a file without a baseline:
1. Save your file. Click the File tab and then click Save, or click the Save button on the Quick Access toolbar.
2. Enter a filename. In the Save dialog box, type wbs in the File name text box. Browse to the location in which you want to save the file, and then click Save. Your Project 2010 file should look like Figure A-21. Remember that you can move the Split bar to show more or fewer columns.
3
.
Close Project 2010. Click the Close icon to exit Project 2010.HELP: If you want to download the Project 2010 file wbs.mpp to check your work or continue to the next section, a copy is available on the companion Web site for this text, the author’s Web site, or from your instructor.
DEVELOPING THE SCHEDULE
Many people use Project 2010 for its scheduling features. The first step in using these features, after inputting the WBS for the project, is to change calendars, if needed, and then enter durations for tasks or specific dates when tasks will occur. You must also enter task dependencies in order for schedules to adjust automatically and to do critical path analysis. After entering durations and task dependencies, you can view the network diagram, critical path, and slack information.
Calendars
The standard Project 2010 calendar assumes that working hours are Monday through Friday, from 8:00 a.m. to 5:00 p.m., with an hour for lunch from noon until 1:00 p.m. In addition to the standard calendar, Project 2010 also includes a 24 Hours calendar and Night Shift calendar. The 24 Hours calendar assumes resources can work any hour and any day of the week. The Night Shift calendar assumes working hours are Monday through Saturday, from 12:00 a.m. to 3:00 a.m., 4:00 a.m. 8 a.m., and 11 p.m. to 12 a.m. You can create a different base calendar to meet your unique project requirements.
To create a new base calendar:
1. Open a new file and access the Change Working Time dialog box. With Project 2010 open, click the Project tab, and then click the Change Working Time button under the Properties group. The Change Working Time dialog box opens, as shown in Figure A-22.
Figure A-22. Change Working Time dialog box
2. Name the new base calendar. In the Change Working Time dialog box, click
Create New Calendar. The Create New Base Calendar dialog box opens. Click the Create new base calendar radio button, type Project A+ as the name of the new calendar in the Name text box, and then click OK.
3. Change the fiscal year start. In the Change Working Time dialog box, click
Options at the bottom of the screen. Change the fiscal year to start in October
instead of January. Review other options in this screen, and then click OK twice. You can use this new calendar for the whole project, or you can assign it to specific resources on the project.
To assign the new calendar to the whole project:
1. Open the Project Information dialog box.Click the Project tab, and then click the
2. Select a new calendar.Click the For calendar list arrow to display a list of available calendars. Select your new calendar named Project A+ from this list, and then click OK.
To assign a specific calendar to a specific resource:
1. Assign a new calendar. Click the View tab, and then click the Resource Sheet
button under the Resource Views group. Type Adam in the Resource Name column, press Enter, and then select the word Adam.
2. Select the calendar. Click the Base Calendar cell on the right part of the screen for Adam. If the Base Calendar column is not visible, click the horizontal scroll bar to view more columns. Click the Base Calendar list arrow to display the options, and then select Project A+,as shown in Figure A-23.
Figure A-23. Changing calendars for specific resources
3.
Block off vacation time. Double-click the resource name Adam to display the Resource Information dialog box, and then click the Change Working Timebutton, located on the General tab in the Resource Information dialog box. You can block off vacation time for people by selecting the appropriate days on the calendar and marking them as nonworking days. Click OK to accept your changes, and then click OK to close the Resource Information dialog box.
4. Close the file without saving it. Click the Close box, and then click No when you are prompted to save the file.
Entering Task Durations
Recall that duration includes the actual amount of time spent working on a task plus elapsed time. Duration does not equal effort. For example, you might have a task that you estimate will take one person 40 hours of effort to complete, but you allow two weeks on a calendar for its duration. You can simply enter 2w (for two weeks) in the Duration column for that task.
Manual and Automatic Scheduling
If you have used earlier versions of Project, you probably noticed that when you entered a task, it was automatically assigned a duration of one day, and Start and Finish dates were also automatically entered. This is still the case in Project 2010 if you use automatic
scheduling for a task. If you use manual scheduling, no durations or dates are automatically entered. The other big change with manual scheduling is that summary task durations are
not automatically calculated based on their subtasks when they are set up as manually scheduled tasks. Figure A-24 illustrates these differences. Notice that the Manual subtask 1 had no information entered for its duration, start, or finish dates. Also note that the duration for Manual summary task 1’s duration is not dependent on the durations of its subtasks. For the automatic summary task, its duration is dependent on its summary tasks, and information is entered for all of the durations, start, and end dates. You can switch between automatic and manual scheduling for tasks in the same file, as desired, by changing the Task Mode.
Figure A-24. Manual versus automatic scheduling
When you move your mouse over the Task Mode column (shown in the far left in Figure A-24) Project 2010 displays the following information:
A task can be with Manually Scheduled or Automatically Scheduled.
Manually Scheduled tasks have user-defined Start, Finish and Duration values. Project will never change their dates, but may warn you if there are potential issues with the entered values.
Automatically Scheduled tasks have Start, Finish and Duration values calculated by Project based on dependencies, constraints, calendars, and other factors.
Project Help provides the following example of using both manual and automatic scheduling. You set up a preliminary project plan that’s still in the proposal stage. You have a vague idea of major milestone dates but not much detail on other dates in various phases of the project. You build tasks and milestones using the Manually Scheduled task mode. The proposal is accepted and the tasks and deliverable dates become more defined. You continue to manually schedule those tasks and dates for a while, but as certain phases become well-defined, you decide to switch the tasks in those phases to the Automatically Scheduled task mode. By letting Project 2010 handle the complexities of scheduling, you can focus your attention on those phases that are still under development.
Duration Units and Guidelines for Entering Durations
To indicate the length of a task’s duration, you normally type both a number and an appropriate duration symbol. If you type only a number, Project 2010 automatically enters days as the duration unit. Duration unit symbols include:
d = days (default) w = weeks m = minutes h = hours mo or mon = months ed = elapsed days ew = elapsed weeks
For example, to enter two weeks for a task’s duration, type 2w in the Duration column. (You can also type wk, wks, week, or weeks, instead of just w.) To enter four days for a task’s duration, type 4 or 4d in the Duration column. You can also enter elapsed times in the Duration column. For example, 3ed means three elapsed days, and 2ew means two elapsed weeks.
You would use an elapsed duration for a task like “Allow cement to dry.” The cement will dry in exactly the same amount of time regardless of whether it is a workday, a weekend, or a holiday. Project’s default calendar does not assume that work is done on weekends. You will learn to change the calendar later in this appendix.
It is important to follow a few important rules when entering durations:
To mark a task as a milestone, enter 0 for the duration. You can also mark tasks that have a non-zero duration as milestones by checking the “Mark task as milestone” option in the Task Information dialog box on the Advanced tab. You simply double-click a task to access this dialog box. The milestone symbol for those tasks will appear at their start date.
You can enter the exact start and finish dates for activities instead of entering durations in the automatic scheduling mode. To enter start and finish dates, move the split bar to the right to reveal the Start and Finish columns. You normally only enter start and finish dates in this mode when those dates are certain.
If you want task dates to adjust according to any other task dates, do not enter exact start and finish dates. Instead, enter durations and then establish
dependencies to related tasks.
To enter recurring tasks, such as weekly meetings, select Recurring Task from the Task button under the Task tab, Insert group. Enter the task name, the duration, and when the task occurs. Project 2010 will automatically insert appropriate subtasks based on the length of the project and the number of tasks required for the recurring task.
Project 2010 uses a default calendar with standard workdays and hours. Remember to change the default calendar if needed, as shown earlier.
Next, you will set task durations in the Project A+ file that you created and saved in the previous section. If you did not create the file named wbs.mpp, you can download it from the companion Web site for this text.
Use the information in Figure A-25 to enter durations. The Project 2010 row number is shown to the left of each task name in the table.
Task Row Task Name Duration
2 Identify stakeholders 1w
3 Stakeholder register completed 0 4 Stakeholder management strategy completed 0
5 Prepare project charter 1w
6 Project charter completed 0 7 Prepare for kickoff meeting 3d 8 Kickoff meeting completed 0
10 Prepare draft schedule 5d
11 Gantt chart completed 0
12 Prepare scope statement 8d 13 Initial scope statement completed 0
15 Work on deliverable 1 3w 16 Work on deliverable 2 5w 17 Work on deliverable 3 6w 18 Deliverable 1 completed 0 19 Deliverable 2 completed 0 20 Deliverable 3 completed 0 24 Progress report 1 0 25 Progress report 2 0
28 Prepare final project report 4d 29 Prepare final presentation 4d
30 Project completed 0
Entering Task Durations
To enter task durations:
1. Enter the duration for Task 2. Open the wbs file, and move the split bar to the right, if needed, to reveal the Duration, Start, and Finish columns. Click the
Duration column for row 2, Identify stakeholders, type 1w, and then press Enter. Notice that the duration for the first task, Initiating, also changed since it is a summary task and is an Automatically scheduled task, as shown in the Task Mode column. When you created summary tasks earlier, Project changed their scheduling mode to Automatic. Also notice that the Start and Finish date for Task 2 remain blank, since that task is a Manually scheduled task.
2. Enter the duration for Task 3 In the Duration column for row 3, Stakeholder register completed, type 0, then press Enter. Remember that a task with zero duration is a milestone. Notice the milestone or black diamond symbol that appears on the Gantt chart, as shown in Figure A-26
.Figure A-26. Entering task durations
3. Make all tasks Automatically scheduled tasks. To save time since you do want most of the tasks to be automatically scheduled, select all of the tasks by clicking the
Task Name column heading, and then click the Auto Schedule button under the
Task tab, Tasks group.
4. Enter remaining task durations. Continue to enter the durations using the information in Figure A-25. Do not enter durations for tasks not listed in the figure. Notice that the Planning Wizard dialog box displays when you make the same entry several times in a row, such as after task 20. Click OK to close the dialog box.
5
.
Insert a recurring task above Task 26, Hold meetings. Click Hold meetings (Task 26) in the Task Name column to select that task. Click the Task tab, and click theTask button drop-down box under the Insert group, and then click Recurring Task. The Recurring Task Information dialog box opens.
6. Enter task and duration information for the recurring task. Type Hold meetings as the task title in the Task Name text box. Type 30min in the Duration text box. Select the Weekly radio button under Recurrence pattern. Make sure that 1 is entered in the Recur every list box. Select the Thursday check box. In the Range of recurrence section, type 2/1/10 in the Start text box, click the End by radio button, and then type 4/29/10 in the End by text box, as shown in Figure A-27. The new recurring task will appear above Task 26, Hold meetings, when you are finished. Delete task 40, Hold meetings, by right clicking anywhere in row 40 and selecting Delete Task.
Figure A-27. Recurring task information dialog box
TIP: You can also enter a number of occurrences instead of an End by date for a recurring task. You might need to adjust the End by date after you enter all of your task durations and dependencies. Remember, the date on your computer determines the date listed as Today in the calendar.
7. View the new summary task and its subtasks. Click OK. Project 2010 inserts a new Hold meetings subtask in the Task Name column. Expand the new subtask by
clicking the expand symbol to the left of Hold meetings. To collapse the recurring task, click the collapse symbol. Move your mouse over the Recurring Task symbol in the Indicator column for row 26. Notice that the recurring task appears on the appropriate dates on the Gantt chart.
8
.
Adjust the columns displayed and the timescale. Move the split bar so that only the Task Name and Duration columns are visible. If needed, increase the Duration column’s width so all of the text is visible. Click the Zoom Out button on the Zoom slider in the lower left of the screen to display all of the symbols in the Gantt chart. Your screen should resemble Figure A-28.Figure A-28. All task durations and recurring task entered
9. Save your file and name it. Click File on the Menu bar, and then click Save As. Enter schedule as the filename, and then save the file to the desired location on your computer or network. Notice that all of the tasks still begin on February 1. This will change when you add task dependencies. Keep this file open for the next set of steps.
Establishing Task Dependencies
To use Project 2010 to adjust schedules automatically and perform critical path analysis, you must determine the dependencies or relationships among tasks. There are several different methods for creating task dependencies: using the Link Tasks button, using the Predecessors column of the Entry table or the Predecessors tab in the Task Information dialog box, or clicking and dragging the Gantt chart symbols for tasks with dependencies. You will use the first two methods in the following steps.
To create dependencies using the Link Tasks button, highlight tasks that are related and then click the Link Tasks button under the Task tab, Schedule group. For example, to create a finish-to-start (FS) dependency between Task 1 and Task 2, click any cell in row 1, drag down to row 2, and then click the Link Tasks button. The default type of link is finish-to-start. In the Project A+ file, you will also set up some other types of dependencies and use the lag option to set up overlaps between dependent tasks.
TIP: To select adjacent tasks, click and drag the mouse to highlight them. You can also click the first task, hold down the Shift key, and then click the last task. To select nonadjacent tasks, hold down the Control (Ctrl) key as you click tasks in order of their dependencies.
When you use the Predecessors column of the Entry table to create dependencies, you must manually enter the information. To create dependencies manually, type the task row number of the preceding task in the Predecessors column of the Entry table. For example, Task 3 has Task 2 as a predecessor, which can be entered in the Predecessors column, meaning that Task 3 cannot start until Task 2 is finished. To see the Predecessors column of the Entry table, move the split bar to the right. You can also double-click on the task, click the Predecessors tab in the Task Information dialog box, and enter the
predecessors there.
Next, you will use information from Figure A-29 to enter the predecessors for tasks as indicated. You will create some dependencies by manually typing the predecessors in the Predecessors column, some by using the Link Tasks button, and the remaining dependencies by using whichever method you prefer.
To link tasks or establish dependencies for Project A+:
1. Display the Predecessors column in the Entry table. Move the split bar to the right to reveal the full Predecessors column in the schedule.mpp file you saved in the previous section. Widen the Task Name or other columns, if needed.
2. Highlight the cell where you want to enter a predecessor, and then type the task number for its predecessor task.Click the Predecessors cell for Task 3, Stakeholder register completed, type 2, and press Enter. Notice that as you enter task dependencies, the Gantt chart changes to reflect the new schedule. Also notice that several cells become highlighted, showing the Visual Change Highlights feature of Project 2010.
3. Enter predecessors for Task 4. Click the Predecessors cell for Task 4, type 2, and press Enter.
4. Establish dependencies using the Link Tasks button. To link Tasks 5 and 6, click the task name for Task 5 in the Task Name column and drag down through Task 6. Then, click the Task Tab, and click the Link Tasks button(looks like a chain link) under the Schedule group. Notice that the result is the same as typing 5 in the Predecessors column for Task 6.
5. Enter dependencies and lag time using the Task Information dialog box. Double-click on the Task Name for task 5, Prepare project charter, and then click on the
Predecessors tab in the Task Information dialog box. Click in the cell under Task Name, and then click the Task Name down arrowand select Identify
stakeholders. Click the Type drop down arrow to see the various types of dependencies. For this task, you will keep the default type of finish-to-start. Click the Lag drop down arrow, then type -50% and press Enter. (Lag means there is a gap between tasks, and lead or negative lag means there is an overlap). Your screen should resemble Figure A-29. Click OK to close the dialog box. Notice that the Predecessor column for task 5 displays 2FS-50%, meaning there is a finish-to-start relationship with task 2 and a lag of -50%, meaning the task can finish-to-start when task 2 is 50% completed.
Figure A-29. Entering predecessor information using the task information dialog box
6. Enter remaining dependencies. Link the other tasks by either manually entering the predecessors into the Predecessors column, by using the Link Tasks button, or using the Task Information dialog box. Use the information in Figure A-30 to make your entries. If you have entered all data correctly, the project should end on 4/30, or April 30, 2010. (Note that you could manually enter a Start date for tasks 22 and 23 to make those dates more realistic. The current dependency shows them both ending one day before the project ends.)
Task Row Task Name Predecessors
3 Stakeholder register completed 2 4 Stakeholder management strategy
completed 2
5 Prepare project charter 2FS-50% 6 Project charter completed 5
7 Prepare for kickoff meeting 2,6 8 Kickoff meeting completed 6,7
10 Prepare draft schedule 5,12FS-50% 11 Gantt chart completed 10
12 Prepare scope statement 5 13 Initial scope statement completed 12 15 Work on deliverable 1 12 16 Work on deliverable 2 18 17 Work on deliverable 3 18 18 Deliverable 1 completed 15 19 Deliverable 2 completed 16 20 Deliverable 3 completed 17
22 Track actual hours 43FF-1 day,2 23 Update project documents 43FF-1 day,3 41 Prepare final project report 18,19,20 42 Prepare final presentation 18,19,20 43 Project completed 41,42
7
.
Review the file. If needed, click the Zoom Out button on the Zoom slider to adjust the timescale so all of the information shows on your screen. When you finish, your screen should resemble Figure A-31. Double-check your screen to make sure you entered the dependencies correctly.Figure A-31. Project A+ file with durations and dependencies entered
8. Preview and save your file. Click the File tab, and then select Print to preview and print your file, if desired. Make adjustments as needed back in the Task tab, and preview the file until it looks correct. When you are finished, save your schedule file again. Keep the file open for the next set of steps.
Gantt Charts, Network Diagrams, and Critical Path Analysis
Project 2010 shows a Gantt chart as the default view to the right of the Entry table. As described earlier in this text, network diagrams are often used to show task dependencies. This section explains important information about Gantt charts and network diagrams and describes how to make critical path information more visible in the Gantt Chart view.
Because you have already created task dependencies, you can now find the critical path for Project A+. You can view the critical tasks by changing the color of those items in the Gantt Chart view. Tasks on the critical path will automatically be red in the Network Diagram view. You can also view critical path information in the Schedule table or by using the Critical Tasks report.
1. Change the critical tasks format. Using the schedule.mpp file you previously saved, click the Format tab, and then click the Critical Tasks check box in the Bar Styles group, as shown in Figure A-32. Notice that the critical tasks display in red in the Gantt chart.
Critical Tasks check box
Figure A-32. Formatting critical tasks
2. View the network diagram. Click the View tab, and then click the Network Diagram button under the Task Views group Click the Zoom Out button on the Zoom slider several times and watch the view change. Figure A-30 shows all of the tasks in the Project A+ network diagram. Note that milestone tasks, such as Stakeholder management strategy completed, the fourth box on the top, appear as pointed rectangular boxes, while other tasks appear as rectangles. Move your mouse over that box to see it in a larger view. Notice that tasks on the critical path automatically appear in red. A dashed line on a network diagram represents a page break. You often need to change some of the default settings for the Network Diagram view before printing it. As you can see, network diagrams can be messy, so you might prefer to highlight critical tasks on the Gantt chart as you did earlier for easier viewing.
3. View the schedule table. Click the Gantt Chart button under the View tab to return to Gantt Chart view. Right-click the Select All button to the left of the Task Mode column heading and select Schedule. Alternatively, you can click the
View tab and click the Tables button under the Data group and then select
Schedule. The Schedule table replaces the Entry table to the left of the Gantt Chart. Your screen should resemble Figure A-35. This view shows the start and finish (meaning the early start and early finish) and late start and late finish dates for each task, as well as free and total slack. Right-click the Select All button and select Entry to return to the Entry table view.
Select All button Schedule table
Figure A-35. Schedule table view
4. Open the Reports dialog box. Click the Project tab, and then click the Reports
button under the Reports group. Double-click Overview to open the Overview Reports dialog box, and then double-click CriticalTasks. A Critical Tasks report as of today’s date is displayed.
5. Close the report and save your file. When you are finished examining the Critical Tasks report, click the Tasks. Click the Save button on the Quick Access toolbar to save your final schedule.mpp file, showing the Entry table and Gantt chart view. Close Project 2010 if you are not continuing to the next section.
HELP: If you want to download the Project 2010 file schedule.mpp to check your work or continue to the next section, a copy is available on the companion Web site for this text at www.intropm.com.
Next you will explore some of the cost and resource management features of Project 2010.
PROJECT COST AND RESOURCE MANAGEMENT
Many people do not use Project 2010 for cost or resource management. Most organizations have more established cost management software products and procedures in place, and many people simply do not know how to use the cost or resource management features of Project 2010. However, these features make it possible to integrate total project
information more easily. This section offers brief instructions for entering fixed and variable cost estimates, assigning resources to tasks, viewing resource histograms, and entering actual cost and schedule information after establishing a baseline plan. It also explains how to use Project 2010 for earned value management. More details on these features are available in Project Help, online tutorials, or other texts. See other chapters of this text for information on some of these concepts.
Entering Fixed and Variable Cost Estimates
You can enter costs as fixed or variable. Fixed costs include costs like a specific quantity of materials or consultants hired at a fixed cost. Variable costs vary based on the amount of materials or hours people work. On many projects, human resource costs are the largest percentage of total project costs.
Entering Fixed Costs in the Cost Table
The Cost table allows you to easily enter fixed costs related to each task. You will enter a fixed cost of $200 related to Task 15, Work on deliverable 1.
To enter a fixed cost:
1. Display the Cost Table view. Open your Project 2010 file schedule.mpp, if necessary. Right-click the Select All button to the left of the Task Mode column heading and select Cost. The Cost table replaces the Entry table to the left of the Gantt chart. Widen the Task Name column and move the split bar to the right, as needed, until you see the entire Cost table. Widen the Task Name column to reveal all of the text in that column.
2