E N V I R O N M E N TA L E C O N O M I C S S E R I E S
Policy Applications
of Environmental
Accounting
PAPER NO. 88Glenn-Marie Lange
January 2003
Papers in this series are not formal publications of the World Bank. They are circulated to encourage thought and discussion. The use and citation of this paper should take this into account. The views expressed are those of the authors and should not be attributed to
Policy Applications
of Environmental
Accounting
Glenn-Marie Lange
January 2003
The financial assistance of the Government of Norway is gratefully acknowledged.
The International Bank for Reconstruction and Development/THE WORLD BANK 1818 H Street, N.W.
Washington, D.C. 20433, U.S.A.
Manufactured in the United States of America First printing January 2003
Glenn-Marie Lange is Research Associate Professor at the Institute for Economic Analysis, New York University.
Contents
Chapter 1
Introduction 1 Chapter 2
Methodological Approaches to Environmental Accounting 3 2.1 Concepts of sustainability 3
2.2 Asset accounts 4
Depletion and depreciation 5
2.3 Pollution and material flow accounts 6 Physical accounts 6
Monetary accounts for environmental degradation 6
2.4 Environmental protection and resource management accounts 7 2.5 Macroeconomic indicators 8
Physical indicators 8 Monetary indicators 10 Chapter 3
Asset Accounts 13
3.1 Monitoring total wealth and changes in natural capital 13
3.2 Managing resources—economic efficiency, sustainability, and other socio-economic objectives 20
3.2.A Economic efficiency 21 3.2.B Sustainability 24
3.2.C Other socio-economic objectives 25 Chapter 4
Physical Flow Accounts for Pollution and Material Use 27 4.1 Physical flow accounts 27
4.1.A Indicators and descriptive statistics 27 4.1.B Policy analysis and strategic planning 32
4.2 Monetary flow accounts for environmental degradation and resource use 36 4.2.A Indicators and descriptive statistics 36
4.2.B Policy analysis with monetary accounts 40 Chapter 5
Environmental Protection and Resource Management Accounts 43 5.1 Indicators and descriptive statistics 43
iv Environment Department Papers Biological Resource Management — Integrating Biodiversity Concerns in Rural Development Projects and Programs
Environmental protection expenditure accounts 43 Resource management expenditures 45
Environmental protection industry 45 Environmental and resource taxes 45 5.2 Policy analysis 47
Chapter 6
Economy-Wide Indicators of Sustainable Development 49 6.1 Physical indicators of macro-level performance 49 6.2 Environmentally-adjusted NDP and related indicators 50
Genuine savings 52
6.3 Modeling approaches to macro-economic indicators 52 Chapter 7
Concluding Comments 57
Underutilization of accounts 57
Comprehensive environmental accounts 57 International comparability 58
Full assessment of environmental impact 58 Progress toward international comparability 58
N
OTES59
R
EFERENCES59
F
IGURESFigure 1. Biomass of hake, pilchard, horse mackerel in Namibia, 1963 to 1999 14 Figure 2. Value of produced and non-produced assets in Australia, Botswana and Namibia
in current prices 16
Figure 3. Index of per capita national wealth in Australia, Botswana, and Namibia, 1990 to 1998 19
Figure 5. Resource rent and taxes from forestry in Norway, 1985 to 1995 22
Figure 4. Resource rent and taxes from oil and gas mining in Norway, 1985 to 1996 22 Figure 6. Resource rent and subsidies to fisheries in Norway, 1985 to 1995 23
Figure 7. Direct and total emissions of sulfur dioxide per unit of industrial output delivered to final users in Sweden, 1991 31
Figure 8. Economic contribution and environmental burden from domestic pollution by selected industries in Sweden, 1991 37
Figure 9. Domestic emissions, exports and imports of NOX in Sweden, 1991 39 Figure 10. Total environmental taxes and total direct subsidies, by industries and
final demand, 1995 46
Figure 11. Index of macro-indicators for economic and environmental performance, Netherlands, 1987 to 1998 50
Contents
T
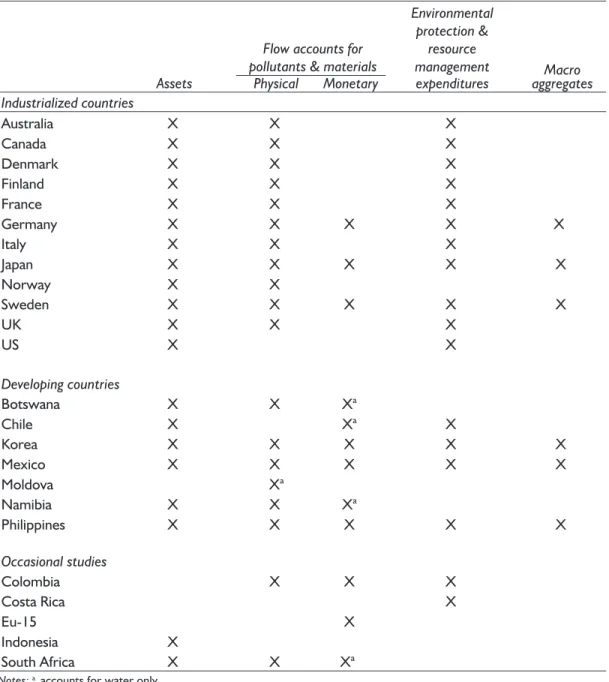
ABLESTable 1. Countries with environmental accounting programs 2
Table 2. Environmental macroeconomic indicators, physical and monetary 9 Table 3. Natural capital as percent of total non-financial assets in Namibia, Botswana,
and Australia, 1990 to 1998 17
Table 4. Financial, non-financial assets, and net worth in Botswana and Australia, 1990 to 1999 18
Table 5. Cost of depletion of natural capital in the Philippines, 1988 to 1993 20
Table 6. Index of water use, GDP growth and population growth in Botswana, 1993 to 1998 28 Table 7. Net contribution of consumption and production to GDP and to six environmental
themes in the Netherlands, 1993 29
Table 8. National income per cubic meter of water by sector in Botswana, Namibia, and South Africa, 1996 30
Table 9. Decomposition of the percent change in CO2 between 1987 and 1998, the Netherlands 32
Table 10. Emissions embodied in Swedish imports under alternative assumptions about emission intensities of imports, 1995 36
Table 11. Emissions of BOD and environmental damage by selected industries in the Philippines, 1993 38
Table 12. Cost of NOxemissions using different valuation methods in Sweden, 1991 39
Table 13. Pollution damage by source country and receptor country in the European Union 40 Table 14. Summary indicators of environmental protection expenditures in 1992 44
Table 15. Environmental taxes in Sweden, 1993–98 46
Table 16. eaNDP as percentage of NDP in selected countries 52 Table 17. Genuine saving as percent of GDP, 1997 53
1
Introduction
The first environmental accounts (EA) were constructed by Norway in the 1970s and were only slowly adopted by other countries. In the early 1990’s, the World Bank conducted a review of (EA), providing a compendium of which countries had compiled environmental accounts, the methods that had been used to construct EA, and the extent of coverage (Peskin and Lutz, 1990). Since that time, EA have increasingly been recognized as a useful economic tool, resulting in a great deal of activity in both developed and developing countries. Over the last decade, conceptual and technical aspects of construction EA have received a great deal of attention; however, much less is known about how EA are being used for policy.
The motivation for EA has been the adoption by governments, at least in principle, of the notion of sustainable development, coupled with the understanding that economic activities and appropriate economic incentives play a central role in determining whether development is sustainable or not. EA provide policy-makers a) with indicators and descriptive statistics to monitor of the interaction between the environment and the economy, and progress toward meeting environment goals; and b) with a database for strategic planning and policy analysis to identify more sustainable
development paths, and the appropriate policy instruments for achieving these paths.
This report reviews the policy applications of EA in industrialized and developing countries,
and also indicates potential applications, which may not be fully exploited at this time. The report is intended to serve as a guide for
countries implementing EA by showing how EA can support policy decision-making. It may also assist EA practitioners and scholars by providing them with a better understanding of the needs of end-users of the accounts.
Table 1 identifies the major countries that are constructing EA on an on-going basis in their statistical offices or other government ministries. These countries have the most extensive experience with policy use of the EA and provide the core of this report. Most of the work is being done in Europe, Australia, and Canada and a relatively few developing countries. Of the developing countries, the Philippines, Botswana, and Namibia are particularly important because policy analysis was built into the EA project design. There are countless other one-time or academic studies; a few which are referred to in this report and are also listed in Table 1.
The second section of the report provides a brief review of the different approaches to EA, beginning with a discussion of the concepts of sustainability that underlie different EA methodologies. The methodologies are
reviewed mainly as they relate to the System of Environmental and Economic Accounts (SEEA), the handbook for EA developed by the United Nations, Eurostat, OECD, World Bank, and other agencies (UN, 1993, currently under revision). The applications themselves are
Environment Department Papers 2
Policy Applications of Environmental Accounting
described in four subsequent chapters
organized around the structure of the EA: asset accounts (section 3), flow accounts for materials and pollutants (section 4), environmental protection and resource management
expenditures (section 5), and macroeconomic indicators (section 6). The final section provides concluding remarks about the use of EA for policy.
Table 1. Countries with environmental accounting programs
Notes:a accounts for water only.
Other European countries have also constructed environmental accounts but are not included here because of the limited policy analysis of the accounts.
Flow accounts for pollutants & materials
Environmental protection &
resource
management Macro Assets Physical Monetary expenditures aggregates Industrialized countries Australia X X X Canada X X X Denmark X X X Finland X X X France X X X Germany X X X X X Italy X X X Japan X X X X X Norway X X Sweden X X X X X UK X X X US X X Developing countries Botswana X X Xa Chile X Xa X Korea X X X X X Mexico X X X X X Moldova Xa Namibia X X Xa Philippines X X X X X Occasional studies Colombia X X X Costa Rica X Eu-15 X Indonesia X South Africa X X Xa
2
Environmental and resource accounting evolved since the 1970s through the efforts of individual countries or practitioners, each developing their own frameworks and methodologies to
represent their environmental priorities. Since the early 1990s, concerted efforts have been underway through the United Nations Statistics Division, the European Union, the OECD, the World Bank, country statistical offices, and other organizations to standardize the framework and methodologies. The United Nations published an interim handbook on environmental accounting in 1993 (UN 1993), which is currently under revision. The discussion below describes the different methodologies and how they are related to the revised SEEA.
Environmental accounts have four components:
•
Natural resource asset accounts, which deal mainly with stocks of natural resources and focus on revising the Balance Sheets of the System of National Accounts (SNA)•
Pollutant and material (energy and resources) flow accounts, which provide information at the industry level about the use of energy and materials as inputs to production and final demand, and the generation of pollutants and solid waste. These accounts are linked to the Supply and Use Tables of the SNA, which are used to construct input-output (IO) tables.•
Environmental protection and resource management expenditures, which identifies expenditures in the conventional SNA incurred by industry, government andhouseholds to protect the environment or manage resources
•
Environmentally-adjusted macroeconomic aggregates, which include indicators of sustainability such as environmentally-adjusted Net Domestic Product (eaNDP). This section begins with a discussion of concepts of sustainability and the implications for approaches to measuring sustainability, then discusses each component of the environmental accounts.2.1 Concepts of sustainability
While this report cannot review all the literature about sustainability (see Pezzey (1989, 1994) for such a review), a brief discussion of the topic is necessary in order to understand some of the issues underlying the different approaches to environmental accounting. The Brundtland Commission Report, Our Common Future, popularized the notion of sustainable
development as “…development that meets the needs of the present without compromising the ability of future generations to meet their own needs (WCED 1987). This rather vague concept resonates with the economist’s basic notion of sustainability, whose starting point has been the idea of income expressed by John Hicks
“…income is the maximum amount an individual can consume during a period and remain as well off at the end of the period as at the beginning.” (Hicks 1946). Hicks’ statement has generally been interpreted as the amount of income that can be spent without depleting the wealth which generates the income.
Methodological Approaches
to Environmental Accounting
Environment Department Papers 4
Policy Applications of Environmental Accounting
Hence, sustainability requires non-decreasing levels of capital stock over time, or, at the level of the individual, non-decreasing per capita capital stock. Indicators of sustainability could be based on either the value of total assets every period, or by the change in wealth, consumption of capital (depreciation) in the conventional national accounts. For a proper measure of sustainability, all assets should be included in such an indicator: manufactured capital, natural capital and human capital. In the past, only manufactured capital was recorded in the SNA, but the recognition of the importance of natural capital has led to the expansion of the asset boundary to include this asset. (Human capital has not yet been included because there is no agreement about how to measure it and is not discussed further.)
Economic sustainability can be defined as strong or weak, reflecting controversy over the degree to which one form of capital can substitute for another. Weak sustainability requires only that the combined value of all assets remain constant, that is, it is possible to substitute one form of capital for another, so natural capital can be depleted or the environment degraded as long as there are compensating investments in other types of capital: manufactured, human, or other type of natural capital.
Strong sustainability is based on the concept that natural capital is a complement to
manufactured capital, rather than a substitute. Renewable resources such as fish or forests, can be exploited only at the natural rate of net growth; the use of non-renewable resources should be minimized and, ideally, used only at the rate for which renewable substitutes are available; emissions of wastes should not exceed the assimilative capacity of the environment. The indicator of sustainability requires that all natural capital is measured in physical units. A less extreme version of strong sustainability accepts some degree of
substitutability among assets, but recognizes that there are some “critical” assets which are irreplaceable. The corresponding measure of sustainability would be partly monetary (for those assets, manufactured and natural, which are not critical and for which substitution is allowed) and partly physical, for critical natural assets.
Das Gupta and Maler (2000) have argued that prices can fully reflect sustainability and the limits to substitution. Hamilton (2000) points out the highly restrictive and unlikely conditions that must be fulfilled in order for prices to provide a true measure of
sustainability.
2.2 Asset accounts
Natural resource asset accounts follow the structure of the asset accounts of the SNA, with data for opening stocks, closing stocks, and changes during the year. The changes that occur during the period are divided into those that are due to economic activity (e.g., extraction of minerals or harvesting of forests), and those that are due to natural processes (e.g., growth, births, and deaths) or other factors. There is some controversy over how to treat new discoveries of minerals: as an economic change (the result of exploration activities), or as part of other volume changes. The monetary accounts for resources have an addition component, like manufactured capital, for revaluation.
Measurement of the physical stocks can present problems both in terms of what to measure as well as how to measure. In some earlier versions of subsoil (mineral) asset accounts, only
economically proven stocks were included in the asset accounts. Some countries have modified this to include a portion of probable and possible stocks, based on the probability of these stocks becoming economically feasible to mine. Certain resources, like marine capture fisheries are not observed directly and require
Methodological Approaches to Environmental Accounting
biological models to estimate stocks and changes in stocks.
Two methods have been used to value assets: net present value (NPV) and net price. The NPV method, that is, the discounted sum of its future income stream, is the theoretically correct method for asset valuation, and it has been recommended by the revised SEEA. The income stream is calculated as the net price, which is the price of an asset minus the marginal costs of extraction. In practice, net price is often
calculated as price minus the average costs of extraction because information about marginal costs are unavailable, often leading to an upward bias in NPV.
It is best to calculate net rent from establishment data, but when the information is not available, aggregate data from the national accounts are used. Whatever the source of data, it is necessary to estimate two components of cost included in the operating surplus, or mixed income part of value-added. The first is the cost of capital, or so-called “normal profit,” which is usually viewed as either the cost of borrowing capital or the opportunity cost of capital. The second component is the earnings of the self-employed. This is essentially a payment for labor which is not included in compensation of employees because, as the owners of business, the self-employed do not pay themselves an explicit wage.
The NPV method of valuation requires assumptions about future prices and costs of extraction, about the rate of extraction, and about the discount rate. It is often assumed that net price and level of extraction remain
constant, although when information is known about planned extraction paths, or expected future prices, this information can be
incorporated. A wide range of discount rates have been used by different countries. In much of the early work on environmental accounting (e.g., Repetto and others 1987,
Bartelmus and others 1992, Van Tongeren and others 1993, UN 1993), the net price method was used to value assets rather than NPV. The net price method simply applies the net price in a given year to the entire remaining stock. Based on an interpretation of Hoteling’s Rule, it is equivalent to the NPV method under the restrictive assumption that the net price increases at the same rate as the discount rate. Although this assumption is unrealistic, the net price method was widely used because it appeared to avoid the need to project future net price or extraction paths. However, the method did not really avoid the need to make these projections, it simply made it unnecessary to make them explicit.
The revised SEEA recommends NPV, and this method has come to be more widely used than the net price method in more recent work. The only significant exception has been the work on forest assets by Eurostat (2000b), which used several methods, including variation of NPV and net price. NPC is used by Eurostat for valuation of subsoil assets (2000a).
Regardless of the method, most asset valuation has focused on the dominant commercial use of a resource. Some assets may have multiple uses. For example, forests, in addition to providing timber, may have a direct commercial use for the recreation industry, as well as other important but less direct uses, e.g., carbon sequestration, or watershed protection. In principle, all these values should also be included in the value of the forest; in practice, they may not be included.
Depletion and depreciation
One of the major motivations for the preparation of asset accounts has been to account for the depletion of natural capital. This is particularly important for resource-rich countries which may appear to perform well according to conventional economic indicators,
Environment Department Papers 6
Policy Applications of Environmental Accounting
but in fact are living off their (natural) capital in a manner that cannot be sustained indefinitely. The cost of depletion was initially measured as the value (net price) of extraction of non-renewable resources, and, for non-renewable resources, the value of the volume of harvest above sustainable yield.
It has since been recognized that this concept, derived from ecological concepts of
sustainability, is not consistent with the economic concept of depreciation used for manufactured assets in the SNA. (For further discussion, see Davis and Moore (2000) or Vincent (1999)). El Serafy (1989) proposed one method of estimating depreciation, but it is not consistent with the economic definition of depreciation and has not been widely used. The revised SEEA proposes a measure of depletion cost more consistent with economic
depreciation: the change in the asset value from one period to the next. However, several alternative ways to measure this cost have been proposed and no consensus has yet been reached (Ryan 2000). As a result of the
uncertainty over measurement of depreciation of natural capital, most countries do not measure it.
2.3 Pollution and material flow accounts
Pollution and material (including energy and resource) flow accounts track the use of materials and energy and the generation of pollution by each industry and final demand sector. The flows are linked through the use of a common industrial and commodity
classification to IO tables and Social Accounting Matrices (SAMs), as exemplified by the Dutch NAMEA framework, which has been adopted by Eurostat and the revised SEEA manual. Much of the work on environmental accounts has been pioneered by industrialized countries and reflects their major policy concerns.
Physical accounts
The most widely available accounts are for energy and air emissions, especially emissions
linked to the use of fossil fuels. Energy accounts have been constructed by many countries since the dramatic oil price increases of the 1970s, and, since many air pollutants are linked to energy use, it is relatively simple to extend the accounts to include these pollutants.
Transboundary flows of atmospheric pollutants that cause acid rain has been a major policy concern throughout Europe for more than two decades. More recently, the concern with climate change has made tracking greenhouse gas emissions a priority. Accounts are also constructed for other air pollutants, water pollutants, solid waste, and other forms of environmental degradation such as soil erosion. In a growing number of countries, especially water-scarce countries, water accounts are a high priority (Australia, France, Spain, Chile, Moldova, Namibia, and Botswana).
Some studies have attempted to fully account for all environmental services including such items as watershed protection provided by forests and open space, pollination of
agricultural crops by wild bees, recreation, and aesthetic enjoyment of the environment
(Nordhaus and Kokkelenberg 1999). This is very difficult and not commonly undertaken.
Monetary accounts for environmental degradation
In many countries, assigning an economic value to environmental benefits and damage may be considered the most effective way to influence policy, if not the most efficient way to design policy. However, there remains controversy over whether these monetary estimates are properly part of the environmental accounts or a separate analysis of the (physical) accounts. Most
countries attempt some valuation, even if outside what they define as the environmental accounts, using one (or sometimes both, for comparison) of two different approaches to valuation:
Methodological Approaches to Environmental Accounting
•
Maintenance, or avoidance, cost approach, which measures the cost of measures to reduce pollution to a given standard•
Damage cost approach, which measures the actual damage caused by pollution, in terms of, for example, reduced agriculturalproductivity due to soil erosion, increased corrosion of structures from acid rain, or damage to human health from water pollution.
In addition, the willingness-to-pay methodology can be applied to environmental degradation, although it is not widely used at this time. Measuring maintenance cost requires setting a level of acceptable emissions (which may be zero) and calculating the cost of introducing technology to reduce current emissions to that level. It is often, though not always, assumed that the end-of-pipe, pollution abatement technology would be used, rather than a redesign of industrial processes to prevent pollution. For example, the avoidance cost of pollution from motor vehicles often assumes the use of catalytic converters added on to vehicles, rather than policies to reduce use of motor vehicles, such as subsidies for mass transit. The pollution abatement approach is attractive for several reasons: it is clearly consistent with the polluter pays principle; in the past, abatement technology dominated technological solutions; and in many instances, abatement cost is relatively easy to measure than other
approaches. In the above example, it is much easier to estimate the cost of widespread use of catalytic converters than to estimate the necessary mass transit subsidies and the development of the corresponding mass transit infrastructure.
Industrialized countries have a relatively long experience with pollution abatement, so that they can estimate the costs of reducing pollution. Developing countries do not have such extensive experience and often “borrow”
expenditure data from other countries (a method called benefits transfer) to calculate coefficients for expenditure on pollution control per unit of output. These are then used as a crude estimate of the expenditures that would be required in order to reduce pollution in the country in question.
Calculating damages caused by pollution is much more difficult. Damages include loss of agricultural productivity or productivity of other resources, accelerated corrosion to structures, and damages to human health. Although it is theoretically the best method, it has not been used as often as the maintenance cost approach.
Monetary accounts for non-marketed resources Valuation issues discussed in the SEEA have largely focused on environmental degradation, but other non-market goods and services also need to be valued. The use of near-market goods like non-market firewood or wild food products are, in principle, included in the SNA, and many countries have included some estimate of these resources in the conventional national accounts. Water, on the other hand, is an example of an economically important resource that is often either unpriced, or priced in a way that is not related to its true economic value. Water valuation can be quite difficult and even in the revised SEEA little guidance has been offered.
2.4 Environmental protection and resource management accounts
This third component of the SEEA differs from the others in that it doesn’t add any new information to the national accounts but reorganizes expenditures in the conventional SNA that are closely related to environmental protection and resource management. The purpose is to make these expenditures more explicit, and thus, more useful for policy analysis. In this sense, they are similar to other
Environment Department Papers 8
Policy Applications of Environmental Accounting
satellite accounts, such as transportation or tourism accounts, which do not necessarily add new information, but reorganize existing information. This set of accounts has three quite distinct components:
•
Expenditures for environmental protection and resource management, by public and private sectors•
The activities of industries that provide environmental protection services•
Eenvironmental and resource taxes/ subsidies.The United States pioneered the collection of environmental protection expenditure (EPE) data in 1972, but has curtailed this data collection effort in the mid-1990’s. The European Union (European System for Environmental Expenditure Information, or SERIEE) and the OECD (Pollution Abatement and Control Expenditure system, or PACE) have compiled environmental protection expenditure accounts throughout the 1990s. These data are generally obtained from industry surveys. Expenditure for environmental protection represent part of society’s effort to prevent or to reduce pressures on the environment. However, the interpretation of indicators from the EPE accounts can be ambiguous. The EPE concept works best for end-of-pipe, pollution abatement technologies in which an additional production cost is incurred to reduce pollution. However, the growing trend in pollution management stresses pollution prevention through redesign of industrial processes rather than end-of-pipe technology. New technology may be introduced, perhaps during the normal course of
replacement and expansion of capacity or for some other reason, that reduces pollution. There is currently no way to estimate how much of the cost of this new technology, if any, should be attributed to environmental protection expenditures. In some instances, process-integrated measures that reduce pollution may
reduce costs and pollution simultaneously. The EU is responding to this problem by beginning to collect data about the use of integrated-process technologies. Surveys of recycling are also included.
These problems make spending on EPE extremely hard to interpret and, therefore, of more limited policy use. An increasing or decreasing EPE cannot be interpreted
unambiguously as either a positive or negative trend. If EPE accounts are constructed at the
firm level and tied to physical flow accounts at the firm level, then one can one interpret the data, and even then, only with the help of additional information to determine whether additional measures not included in EPE accounts were also undertaken.
2.5 Macroeconomic indicators
The three sets of account described above each provide a range of indicators, but, with the exception of the asset accounts, these indicators do not directly affect the conventional
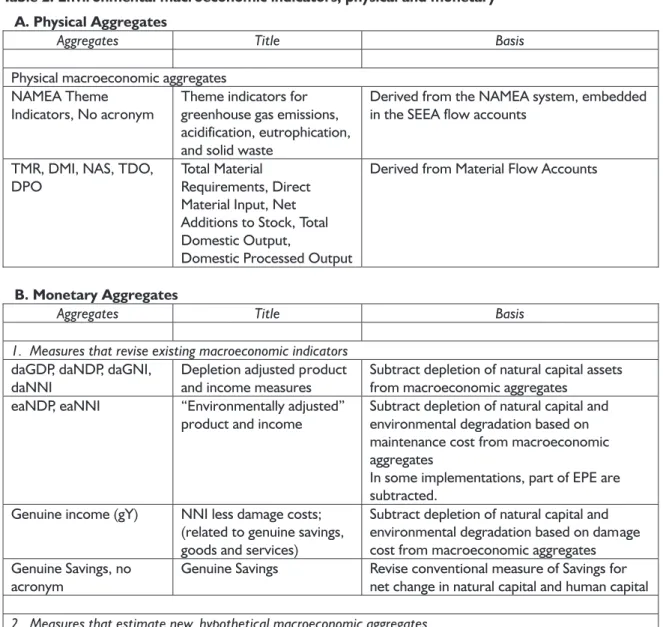
macroeconomic indicators such as GDP and NDP. Many practitioners have searched for a way to measure sustainability by revising conventional macroeconomic indicators or by producing alternative macro indicators in physical units. Table 2 lists the major environmental macroeconomic indicators.
Physical indicators
Macroeconomic indicators measured in physical units have been proposed either as an
alternative to monetary indicators, or to be used in conjunction with monetary aggregates in assessing economic performance. Physical indicators reflect a strong sustainability approach. The two major sources of physical macroeconomic indicators are the NAMEA component of the SEEA flow accounts and Material Flow Accounts, which are closely related to environmental accounts (see section
Methodological Approaches to Environmental Accounting
Table 2. Environmental macroeconomic indicators, physical and monetary
Source:Part B adapted from Table 1, Chapter VIII of the revised SEEA (UN and others 2000).
A. Physical Aggregates
Aggregates Title Basis
Physical macroeconomic aggregates NAMEA Theme
Indicators, No acronym
Theme indicators for greenhouse gas emissions, acidification, eutrophication, and solid waste
Derived from the NAMEA system, embedded in the SEEA flow accounts
TMR, DMI, NAS, TDO, DPO
Total Material Requirements, Direct Material Input, Net Additions to Stock, Total Domestic Output,
Domestic Processed Output
Derived from Material Flow Accounts
B. Monetary Aggregates
Aggregates Title Basis
1. Measures that revise existing macroeconomic indicators daGDP, daNDP, daGNI,
daNNI
Depletion adjusted product and income measures
Subtract depletion of natural capital assets from macroeconomic aggregates
eaNDP, eaNNI “Environmentally adjusted” product and income
Subtract depletion of natural capital and environmental degradation based on maintenance cost from macroeconomic aggregates
In some implementations, part of EPE are subtracted.
Genuine income (gY) NNI less damage costs; (related to genuine savings, goods and services)
Subtract depletion of natural capital and environmental degradation based on damage cost from macroeconomic aggregates Genuine Savings, no
acronym
Genuine Savings Revise conventional measure of Savings for net change in natural capital and human capital 2. Measures that estimate new, hypothetical macroeconomic aggregates
Hueting's Sustainable national income (SNI)
Sustainable income measure preserving environmental services
Modeling of hypothetical GDP, GNI if economy was forced to meet environmental standards using currently available technology geGDP, geNDP, geGNI,
geNNI
“Greened economy” product and income measures,
Modeling of hypothetical GDP if hypothetical environmental protection costs were required Other forms of
sustainable GDP, NDP, GNI, NNI
No technical term Modeling of hypothetical GDP from a range of either short- and medium-term options (e.g., carbon tax) to long term strategic analysis of alternatives for sustainable development
Environment Department Papers 10
Policy Applications of Environmental Accounting
4.1.B for further discussion of MFA and the SEEA).
The NAMEA provides physical macroeconomic indicators for major environmental policy themes: climate change, acidification of the atmosphere, eutrophication of water bodies, and solid waste. These indicators are compiled by aggregating related emissions using some common measurement unit, such as carbon dioxide equivalents for greenhouse gases. The indicators are then compared to a national standard—such as the target level of greenhouse gas emissions—to assess
sustainability. The NAMEA does not, however, provide a single-valued indicator which aggregates across all themes.
The Material Flow accounts (MFA) provide several macro indicators; the most widely known is total material requirements (TMR) (see Bartelmus and Vesper (2000), World Resources Institute (2000)). TMR sums all the material use in an economy by weight, including so-called “hidden flows,” which consist of materials excavated or disturbed along with the desired material, but which do not themselves enter the economy. In contrast to NAMEA theme
indicators, TMR provides a single-valued indicator for all material use. Sustainability is assessed in terms of “dematerialization” such as Factor 4 (halving resource use while doubling wealth (von Weisäcker and others 1997). However, TMR does not differentiate materials by their environmental impact—highly toxic materials are simply added to materials like timber or gravel that may be much less environmentally damaging. Consequently, the sustainability goals set under this framework appear rather vague to be used as guides to policy, and require more disaggregation, by material and by industry, to be interpreted correctly. See Cleveland and Ruth (1999) for a criticism of these physical indicators of dematerialization.
Monetary indicators
The purpose of most monetary environmental macroeconomic aggregates has been to provide a more accurate measure of sustainable income. The first approach revised conventional
macroeconomic indicators by adding and subtracting the relevant environmental components from the SEEA, the depletion of natural capital (daNDP) and environmental degradation (eaNDP) (O’Connor 2000). The adjustment of NDP for asset depletion (daNDP) is accepted in principle by most economists and statisticians, even though there is not yet a consensus over the correct way to measure it. Environmentally-adjusted NDP has been criticized for combining actual transactions (conventional NDP) with hypothetical values (monetary value of environmental degradation). If the costs of environmental mitigation had actually been paid, relative prices throughout the economy would have changed, thereby affecting economic behavior and, ultimately, the level and structure of GDP and NDP.
A macro indicator related to eaNDP is Genuine Savings, reported in the World Bank’s World Development Indicators (Kunte and others 1
98, Hamilton 2000, World Bank 1999). It attempt to measure changes in asset values rather than income. According to economic theory, (weak) sustainability requires that wealth is non-declining over time. Many countries do not have comprehensive balance sheets, so it is not yet feasible for them to monitor wealth.
However, it is possible to measure savings more accurately, which indicates how wealth is changing, and whether the trend is sustainable or not. Genuine savings adjusts gross domestic savings for consumption of fixed capital, investment in human capital, changes in natural capital, and environmental damage.
The criticism of eaNDP led to the construction of a second approach to constructing indicators, which asked the question, what would GDP or
Methodological Approaches to Environmental Accounting
NDP have been is the economy were required to meet sustainability standards. These indicators of a hypothetical economy are derived through economic modeling. Two modeling approaches were developed:
•
Hueting’s Sustainable National Income (SNI) which estimates what the level of national income would be if the economy met all environmental standards using currently-available technology (Verbruggen and others 2000)•
geNDP which estimates how the economy would respond if the estimatedmaintenance costs were internalized in the economy.
Hueting’s SNI is the maximum income that can be sustained without technological
development (excluding the use of non-renewable resources). It is not meant to represent what the economy should look like, but rather, to show to policy-makers the distance between the current economy and a sustainable economy. The geNDP approach is a
bit less restrictive, technological change is possible, depending on the time period for the transition. The purpose of this approach is to provide policy-makers with guidance about the environmental impacts of alternative
development paths and the most efficient policy instruments for meeting environmental
objectives.
Identifying a sustainable national income is a highly complex undertaking. It requires economic modeling that includes assumptions about the environmental standards to achieve, the technological means to achieve them, the response to policy instruments, and the usual range of assumptions for an economic model: income and price elasticities, impacts on trade, etc. Different combinations of these options and assumptions about the future will result in quite different levels of sustainable national income. Much depends on the period of time over which sustainable income would be achieved. Because of this complexity, no studies have produced indicators that are comparable across countries.
Asset Accounts
3
One of the fundamental indicators of a country’s well being is the value of its wealth over time. The discussion of sustainability indicated that there are different views about how wealth should be measured, i.e., if all forms of wealth can be measured in monetary terms (weak sustainability) or if wealth must be measured in some combination of monetary and physical units (strong sustainability). Whether one chooses to aggregate different forms of wealth, and whether one interprets the
aggregate figure as an indicator of sustainability or not, it is certainly necessary for a country to monitor its wealth over time. While non-declining national wealth does not guarantee sustainable development, declining national wealth almost certainly a cause for concern. Better, more comprehensive accounts for national wealth can only improve the ability of researchers and policy-makers to make
informed decisions.
This section begins with a review of the way asset accounts contribute to more effective monitoring of national wealth, then discusses how the asset accounts can be used to improve management of natural capital. Some of the issues that are addressed include:
Monitoring national wealth
•
Physical stocks of natural capital and the totaleconomic value of produced and
non-produced assets
•
Change in per capita wealth over time•
Depletion of natural capital and the economiccost of depletion.
Analysis of the management of national wealth
•
· Is the resource rent being recoveredsuccessfully by government through economic instruments
•
Is rent used to promote a sustainableeconomy—e.g., rent from non-renewable
resources reinvested in other activities that can take their place
•
Is the maximum rent being generated by natural resource policies•
If not, are there other socio-economic objectivesthat are being met, such as support to rural economies, or employment creation, and what is the economic cost of meeting these other objectives.
3.1 Monitoring total wealth and changes in natural capital
The asset accounts provide fundamental
indicators to monitor sustainability: the value of wealth and how it changes from one period to the next through depreciation or accumulation. Although total wealth and per capita wealth, expanded to include both manufactured and natural assets, are useful indicators, not many countries compile such figures yet. Instead, many countries have focused on compiling accounts for individual resources and sometimes estimating depletion of natural capital, which is used to compile a more comprehensive measure of depreciation than is found in the conventional national accounts. This section begins with a review of the use of the asset accounts to measure wealth, and then turns to measures of depletion and depreciation.
Environment Department Papers 14
Policy Applications of Environmental Accounting
PHYSICAL ASSET ACCOUNTS
The physical asset accounts provide indicators of ecological sustainability and detailed information for the management of resources. The volume of mineral reserves, for example, is needed to plan extraction paths and indicates how long a country can rely on its minerals. The volume of fish or forestry biomass, especially when disaggregated by age class, helps to determine sustainable yields and the harvesting policies appropriate to that yield.
The asset accounts track the changes in stock over time and indicate whether depletion is occurring. They can, thus, show the effects of resource policy on the stock and can be used to motivate a change in policy. For example, the biological depletion of Namibia’s fish stocks since the 1960’s has provided a very clear picture to policy-makers of the devastating impact of uncontrolled, open-access fishing (Figure 1). Similar accounts of depletion (or accumulation) have been constructed for forests in the Philippines, Brazil, Chile, Malaysia, Indonesia, Australia, Canada and much of the EU.
Physical accounts for land accounts track the use of land for different purposes, and its conversion from one use to another over time, which can be linked to the environmental and economic consequences of conversion, such as increased soil erosion or loss of watershed protection. For example, a major concern in developing as well as industrialized countries, concerns the conversion of high potential agricultural land to urban settlements, the loss or fragmentation of fragile ecosystems
supporting unique biodiversity, or the clearing of forests for agriculture. Land accounts and indicators of environmental pressure related to economic activity have been constructed in a number of industrialized countries, such as Canada (1997, 2000), Germany (Rademacher 1998), and the UK (Stott and Haines-Young 1998) but have not been widely used in developing countries. Limited accounts were constructed for Korea. The Philippines constructed a model to assess the economic consequences of different patterns of land use (ENRAP 1998). Where land has been addressed, it is usually in relation to soil and, more
particularly, degradation of soil through erosion or other factors.
Some environmental assets clearly yield economic benefits, which may not always be fully captured in monetary terms such as carbon sequestration, watershed protection, or provision of habitat to maintain biodiversity. For such assets, physical accounts often provide the best alternative for management. For example, physical accounts for stocks and flows of greenhouse gases (GHG) are required to address climate change. An important element in these accounts is the carbon storage capacity of natural assets, especially forests. Carbon binding is calculated as a given percentage of the estimated
Figure 1. Biomass of hake, pilchard, horse mackerel in Namibia, 1963 to 1999 (thousands of tons)
Source: Lange 2001. -2,000 4,000 6,000 8,000 10,000 12,000 14,000 16,000 1963 1965 1967 1969 1971 1973 1975 1977 1979 1981 1983 1985 1987 1989 1991 1993 1995 1997 199 9 Horse Mackerel Hake Pilchard
Asset Accounts
biomass of forests, and changes in carbon stocks are estimated on the basis of changes in forest biomass. Such accounts are constructed for Australia and Canada, and were constructed for South Africa’s forests in a recent academic study (Hassan 2000).
International protocols for climate change which allow tradeoffs between carbon emissions and carbon sinks, such as forests, will make these accounts essential. Limited international trading in carbon sinks is already occurring. If this trend expands, it will be very useful for developing countries with large forest potential to compile forest and carbon accounts.
MONETARY ASSET ACCOUNTS
The physical accounts for individual assets can be used to monitor ecological sustainability. However, a more complete assessment of assets requires that the economic value of a resource also be known. The monetary value of different assets, produced and non-produced, can be combined to provide a figure for total national wealth. This figure can be analyzed to assess the diversity of wealth, its ownership distribution, and its volatility due to price fluctuations, an important feature for economies dependent on primary commodities. Diversity is important because, in general, the more diverse an economy is, the more resilient it will be to economic disturbances. Volatility is also important in planning for the future—lower volatility contributes to more stable economic development. The distribution of the ownership of assets—between public and private sector, the concentration among different groups in society, and between domestic and foreign—can have significant economic implications and can influence the sustainable management of resources.
Most countries with asset accounts for natural capital have typically published the accounts separately for each resource and have not attempted to measure of total natural capital
(the sum of all resources), or a measure of total national wealth (the sum of manufactured and natural capital). Among the developing
countries, Botswana (Lange 2000a) and Namibia (Lange 2001) are doing so. Among the
industrialized countries, Australia (ABS 1999) and Canada (Statistics Canada 2000) have integrated non-produced natural assets with produced assets in their Balance Sheets.
In some cases, this may simply reflect a relative lack of concern by policy-makers about
wealth—most countries have traditionally been much more concerned with the income and product flow accounts of the SNA than with the asset accounts. Some developing countries, like the Philippines, may not have data about manufactured capital stock. In other cases, there may also be a reluctance to combine
conventional measures of manufactured capital with what may be viewed as experimental calculations for natural capital, especially when there is controversy over the assumptions necessary for valuation (Ryan, 2000), or over the policy implications of the results, e.g., fisheries in Chile.
In the discussion that follows, the total wealth of three countries are compared—Australia, Botswana, and Namibia. Although accounts for natural capital are not comparable across these countries because of differences in methodology and coverage, international comparisons are nonetheless instructive, and provide the basis for improving the accounts.
Australia’s accounts for natural capital include land, subsoil assets, and native forests in non-produced asset accounts, and commercial forests in produced assets (Figure 2.A). Botswana’s accounts currently include only mineral assets (Figure 2.B), and Namibia’s asset accounts include minerals and fisheries (Figure 2.C). Neither Botswana or Namibia have valued land yet because no market price exist for the very large portions of the land that are subject to traditional communal tenure regimes. Other
Environment Department Papers 16
Policy Applications of Environmental Accounting
Figure 2. Value of produced and non-produced assets in Australia, Botswana and Namibia in current prices 2.B Botswana 0 10,000 20,000 30,000 40,000 50,000 60,000 70,000 1990/91 1991/92 1992/93 1993/94 1994/95 1995/96 1996/97 Mineral assets Prod. Assets, private Prod. Assets, govt.
2.C Namibia 10,000 20,000 30,000 40,000 50,000 60,000 Millions of Namibia dollars 70,000 1990 1991 1992 1993 1994 1995 1996 1997 1998 Fisheries Minerals
Produced capital, govt. Produced capital, private
0
Source: Australia—Australian Bureau of Statistics 2000, Botswana—Lange 2000, Namibia—Lange 2002.
2.A Australia, 1989 to 1998 0 500 1000 1500 2000 2500 3000 Billions of Australian dollars 1989 1990 1991 1992 1993 1994 1995 1996 1997 1998 1999 Native forests Subsoil assets Land Produced assets
significant missing assets include wildlife for both Botswana and Namibia, and water for all three countries. Figures are reported in current prices because there is not yet an agreed upon methodology for constant price calculations for natural capital.
The trend of national wealth over time
indicates, at an aggregate level, whether capital is maintained, whether depreciation of natural capital, if it has occurred, has been compensated for by an increase in other forms of capital. In all
three countries the value of total capital has increased over time. The value of Australia’s total (non-financial) capital increased 43 percent, and roughly doubled in Botswana and Namibia during the 1990’s, despite exploitation of non-renewable resources. Whatever depletion has occurred in these countries has been
compensated for by a combination of factors: new discoveries, an increase in economically profitable reserves, and an increase in the economic value of reserves. In the case of Namibia’s fisheries, improvements in fisheries
Asset Accounts
management has also played a role in the increased value of the fish stock.
In addition to the volume of wealth, the composition of wealth is also an important indicator to monitor because, generally, a more diverse economy is a more resilient one. Many resource-rich developing countries have
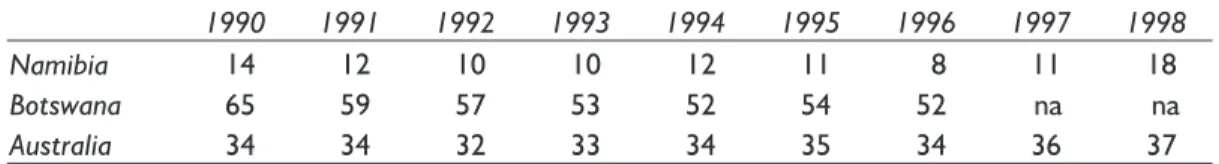
identified economic diversification as one of their development objectives. A comparison of the shares of produced and natural capital over time is one approach to monitoring this aspect of resilience and progress toward diversification. Natural capital is quite important in all three countries (Table 3). Botswana is the only country where the share of natural capital, 52% in 1996, is greater than manufactured capital, 48%. This share is significantly lower than its 65% share in 1990, which indicates substitution of produced capital for mineral capital over time, and diversification of the economy. For an industrialized country, Australia has a relatively high dependence on natural capital—37% of its non-financial assets in 1998, but not much different from 1990. The share of natural capital is much smaller in Namibia, only 18% by 1998, but higher than its share in 1990 (14%). In the Australian accounts, land dominates natural capital, accounting for roughly three-quarters of the total value of non-produced assets. Neither Botswana or Namibia have included land in their asset accounts, probably resulting in serious underestimates of national wealth.
Australia’s national wealth shows relatively low volatility, possibly because land is the largest component and land value is not subject to the large changes in price and demand faced by globally-traded resources like minerals and fish. Although Botswana has seen a dramatic change in the relative shares of produced and non-produced capital, the transition has been smooth, without major changes from year to year. By contrast, the natural assets of Namibia appear to be less stable, accounting for 14% of wealth in 1990, falling to a low of 8% in 1996, followed by a high of 18% in 1998. This trend that is more pronounced when its natural assets are examined individually.
Namibia’s mineral assets consist primarily of diamonds, uranium and gold. The combined value of these assets (confidentiality concerns prevents reporting the value for each mineral) fell from N$2,575 million in 1990 to N$976 million in 1993, then recovered steadily to just over its 1990 value in 1998. Under a new management system since independence in 1990, Namibia’s fisheries are recovering from a long period of over-exploitation, which makes the stock extremely vulnerable to disturbances of the marine environment. The value of the fish stock fell and recovered twice during the 1990’s, rising dramatically by more than 100% between 1997 and 1998, due partly to fluctuations in the tock and partly to fluctuating economic
conditions. Clearly, Namibia’s wealth is much more volatile than the other two countries.
Table 3. Natural capital as percent of total non-financial assets in Namibia, Botswana, and Australia, 1990 to 1998 (percent)
Notes: Na: not available.
Figures for Australia include only non-produced assets, not types of natural capital which are included under produced capital.
Percentage shares calculated in current prices.
Source: Derived from: Australia—Australian Bureau of Statistics 2000, Botswana—Lange 2000. Namibia—Lange 2002.
1990 1991 1992 1993 1994 1995 1996 1997 1998
Namibia 14 12 10 10 12 11 8 11 18
Botswana 65 59 57 53 52 54 52 na na
Environment Department Papers 18
Policy Applications of Environmental Accounting
In using national wealth to monitor economic sustainability, it is crucial to include all assets, or at least as many as possible (human capital is not yet included). Some natural assets are not yet included in the countries accounts, mainly because of valuation difficulties. Another important component of a country’s asset portfolio is its net foreign financial assets. It is not uncommon for resource-rich developing countries, like some of the major oil-producing countries, to invest much of the income from resource exploitation in foreign assets, especially if the economy is small and opportunities for domestic investment are limited. For such countries, net financial assets form a significant share of national wealth. Indeed, for Botswana, foreign financial assets have grown increasingly important, from 13% of total net worth in 1990 to 21% in 1996. In the case of Australia, net foreign financial assets are negative and growing, reaching –16% of net worth in 1998 (Table 4). Figures are not yet available for Namibia.
So far, we have considered only trends in total wealth. However, in most countries, population
is still increasing, so a constant level of wealth and income would result in a declining per capita level of wealth and income for future generations. Inter-generational equity requires that not just total wealth, but per capita national wealth is non-declining over time.
Figure 3 shows the index of per capita wealth in current prices from 1990 to 1998 (1996 for Botswana). For Botswana and Australia, the net worth figure including net foreign financial assets is used; for Namibia, only produced plus natural capital are available. Per capita wealth has grown the fastest for Botswana, by 80% from 1990 to 1996, and the slowest for Australia, only by 22%, which is not surprising for a mature industrialized economy. Per capita wealth also grew fast in Namibia, though not as fast as Botswana, though without information about foreign financial assets, it is not certain whether the figure reported understates or overstates asset growth. The trends for the three countries are not readily comparable because they are not in constant price terms.
Table 4. Financial, non-financial assets, and net worth in Botswana and Australia, 1990 to 1999
Na: not available
Notes:Figures are in current prices. Figures for Namibia are not currently available.
Source:derived from: Australia: Australian Bureau of Statistics, 2000. Botswana: Lange, 2000.
1990 1991 1992 1993 1994 1995 1996 1997 1998 Botswana,millions of pula
Produced +
Non-produced assets 35,657 37,947 40,147 43,764 50,734 58,351 66,613 Na Na Net foreign financial
assets 5,482 6,919 7,595 9,413 10,693 11,871 17,636 19,378 24,517 Net worth 41,139 44,866 47,742 53,177 61,427 70,222 84,249 Na na Australia, billions of A$
Produced +
Non-produced assets 1,742 1,796 1,797 1,885 1,984 2,095 2,154 2,285 2,428 Net foreign financial
assets -171 -192 -201 -217 -238 -263 -279 -303 -321 Net worth 1,572 1,604 1,596 1,668 1,746 1,832 1,875 1,982 2,107
Asset Accounts
The public and private sectors may have
different resource management objectives which affect the way resources are exploited.
Consequently, monitoring the distribution of asset ownership between public and private sectors may be useful, not as a direct indicator of sustainability, but as an aid to resource management. The private sector is motivated largely by commercial concerns, which can favor economic efficiency, but also depletion of renewable resources under certain conditions. Government may or may not utilize resources in a sustainable, and it may use resources to achieve other socio-economic objectives, even if this lowers the economic return from a resource. The response to the depletion of natural capital may also differ between the private and public sector. Where depletion occurs, sustainability requires reinvestment in other forms of capital. Private ownership may result in reinvestment in private sector activities, but foreign ownership may result in reinvestment elsewhere which
does not benefit the country providing the wealth. In countries where the government owns the resource and recovers most of the resource rent, the government bears responsibility for reinvestment, often investing in public sector capital. There is disagreement over the extent to which growth in government assets is an effective substitute for other forms of capital. There is a tendency to assume that government is economically inefficient compared to the private sector, but it is also well documented that the private sector will under-invest in assets where social benefits exceed private benefits, like public infrastructure and human capital. In any case, it is useful to monitor the distribution of capital, as well as its level and composition. In Botswana and Namibia, minerals and fisheries are owned by the state. Private sector manufactured capital has been growing faster than public sector manufactured capital in Namibia, while the opposite is true in Botswana (Figure 2). In Australia, non-produced assets, dominated by land, are mainly (70%) owned by the private sector.
DEPLETION AND DEPRECIATION OR ACCUMULATION OF NATURAL CAPITAL
In addition to a measure of overall wealth, asset accounts may provide a measure of annual depreciation of produced assets and natural capital. The depletion of natural capital reduces the wealth available to future generations, and reduces the income-generating capacity of the economy. If this loss is not reflected in the national accounts, policymakers may
overestimate the level of sustainable national income.
Depletion accounts, mostly using the net price method rather than economic depreciation,
Notes:Index calculated in current prices.
National wealth is net worth for Australia and Botswana. For Namibia, only produced + natural capital are included.
Source:derived from: Australia—Australian Bureau of Statistics 2000, Botswana— Lange 2000, Namibia—Lange 2001.
Figure 3. Index of per capita national wealth in Australia, Botswana, and Namibia, 1990 to 1998 (1990=1.00)
1.00 1.10 1.20 1.30 1.40 1.50 1.60 1.70 1.80 1.90 1990 1991 1992 1993 1994 1995 1996 1997 1998 Namibia Botswana Australia
Environment Department Papers 20
Policy Applications of Environmental Accounting
were calculated in the early studies for
Indonesia and Costa Rica by Repetto (1989), for Mexico (van Tongeren and Schweinfest 1991) and Papua-New Guinea (Bartelmus and others 1992) by the UN and World Bank, and in more recent work undertaken by the Philippines (forests, minerals, land, fish), Chile (forests), Indonesia (forests, minerals) and Brazil (forests). Indonesia reported that depletion accounted for 11% of GDP over the period 1993 to 1996 (Saleh 2000). Estimates of depletion or depreciation have been estimated in a number of one-time, or academic studies such as Malaysia (Vincent 1997).
Depletion estimates for the Philippines are dominated (90% or more) by the costs of deforestation, which was halted by a logging ban in 1992 (Table 5). Depletion for minerals is quite low, reflecting the slow-down in mining due to falling world mineral prices from 1991 to 1993. Depletion of land and fisheries have both been increasing, fisheries at a rather alarming rate.
Controversy over measurement has made it more difficult to provide policy-makers with a definite figure for depletion (See discussion in section 2) and many of the industrialized countries have not calculated it, or are
conducting experimental calculations, not fully integrated into the national accounts. The recent publication by Eurostat of pilot accounts for
subsoil assets (Eurostat 2000a) and for forests (Eurostat 2000b) did not attempt to measure the cost of depletion. Australia used several
alternative methods for valuing the cost of depletion for sub-soil assets during the 1990’s. Including this depletion with conventional measure of depreciation would reduce Net Domestic Product by less than 1%, which is not very significant (Ryan 2000, Tables 2, 8). Of course, not all change in the stock of resources is negative. There has been a net increase in the volume of cultivated timber in South Africa. Using the change in asset value approach of Vincent (1999), Hassan (2000) found this would increase Net National Product by roughly 0.5% over the past decade. For countries like Botswana, if the cost of depletion is calculated using the old method—net price times the quantity extracted—then this cost will be quite high. However, if the economic method of depreciation, the change in asset value, is used, there is a net appreciation because of holding gains.
3.2 Managing resources—economic efficiency, sustainability, and other socio-economic objectives
In the early days of environmental accounting, resource rent was calculated in order to calculate the value of assets, but its usefulness as a resource management tool was not always recognized. More recent work by Norway
Table 5. Cost of depletion of natural capital in the Philippines, 1988 to 1993
(millions of pesos)
Note: depletion cost estimated using the net price method.
Source: NSCB. 1988 1989 1990 1991 1992 1993 Forests 24,529 14,852 10,404 11,766 542 300 Land 918 979 1,212 1,618 1,401 1,241 Fisheries 188 366 573 936 1,106 1,073 Minerals 381 296 81 1 0 0 Total 28,004 18,482 14,260 16,312 5,041 4,607
Asset Accounts
(Sorenson and Hass 1998), Eurostat (2000a) for subsoil assets, in the Philippines (ENRAP 2000, Lange 2000b), Botswana (Lange 2000a),
Namibia (Lange and Motinga 1997, Lange 2001b), and South Africa (Blignaut and others 2000) has included detailed analysis of resource rent. Rent has been used to assess resource management in terms of economic efficiency, sustainability, and achieving other socio-economic objectives, such as inter-generational equity.
In terms of economic efficiency, some of the issues addressed include:
•
How much resource rent is being generated and is it being recovered by government or accruing to the private sector?•
Do payments to government by the private sector at least cover the cost to government of managing the industry?•
Do current management policies maximize the amount of rent that can be generated from the resource, or could rent be higher under an alternative management regime? In terms of sustainability, issues include:•
Is rent from nonrenewable resources being reinvested?•
Do pricing policies for renewable resources promote sustainable management?In terms of other socio-economic objectives, issues include:
•
Do policies contribute to inter-generational equity?•
How are the benefits from resourceexploitation shared among different groups in society?
3.2.A Economic efficiency
The value of an asset depends, in part, on how efficiently it is exploited. Norway provides a good example of how analysis of rent can be used to compare very different approaches to resource management that affect the value of
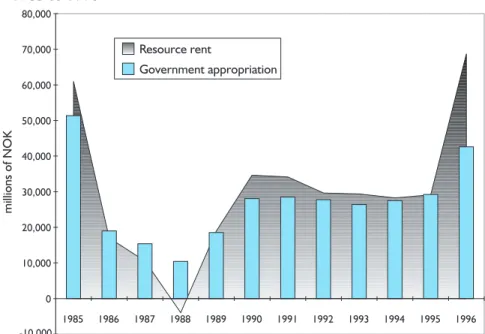
three major natural assets—petroleum, uncultivated forests, and fisheries. Figures 4, 5,and 6 show the rent generated by each of these resources and the distribution of that rent between government and private sector. In many countries, resources belong, by law, to the state. As the owner of the resource, the
government has a right to charge for the exploitation of the resource by private companies, and the responsibility to ensure proper use of the rent. Often, resource pricing does not recover the full rent, or even the full cost of managing the resource.
Significant amounts of rent have been generated by the oil and natural gas industry of Norway, but the rent has fluctuated a great deal, even becoming negative in 1988, meaning that, in that year, the industry did not even earn a normal return to the capital it had invested in the industry. To understand the high volatility better, one must distinguish between total rent and per unit rent (not shown) to determine how much of the rent fluctuation results from changes in the volume of extraction, and how much results form changes in market price or the cost of production. The figures for
petroleum indicate that government
appropriates most of this rent through taxes. In 1986 to 1988, the taxes collected by government actually exceeded rent.
Uncultivated forests are also managed in a way that generates substantial rents, but, rather than contributing this rent to government, the rent accrues to the private sector which receives, in addition, large subsidies (Figure 9). Fisheries (Figure 10) provide an example of yet a third management strategy. Fisheries (these figures include both capture fisheries and aquaculture) are managed in a way that generates no positive rent—rent from fisheries has been negative except in 1995, and, rather than collecting revenue, government has been providing the industry with considerable subsidies. The management regime promotes exploitation of
Environment Department Papers 22
Policy Applications of Environmental Accounting
-10,000 0 10,000 20,000 30,000 40,000 50,000 60,000 70,000 80,000 1985 1986 1987 1988 1989 1990 1991 1992 1993 1994 1995 1996 Resource rent Government appropriation millions of NOK
Figure 4. Resource rent and taxes from oil and gas mining in Norway, 1985 to 1996
Figure 5. Resource rent and taxes from forestry in Norway, 1985 to 1995
-400 -200 0 200 400 600 800 1,000 1,200 1,400 1985 1986 1987 1988 1989 1990 1991 1992 1993 1994 1995 Rent Goverment appropriation millions of NOK
Asset Accounts
fish stocks by relatively small inefficient vessels in order to support Norway’s regional
economies. The economic value of fish under this management regime is zero.
A pilot study by Eurostat for oil and natural gas found that in the Netherlands, government appropriated between 82% and 97% of the rent between 1990 and 1998. The figures were generally lower for the UK; after the industry began to earn a positive rent in 1993,
government’s share ranged from 45% to 99% (Eurostat 2000a). Rent recovery in the Philippines was generally quite low for all resources except minerals. The studies of Namibia, Botswana, and South Africa (sub-soil assets and, in Namibia, fisheries) showed mixed results: rent recovery from sub-soil assets was quite high for Botswana and Namibia, but low for Namibian fisheries. Rent recovery in South Africa was mixed: high from gold mining but low from coal.
These figures can provide a basis for setting resource pricing policy. The figures for Namibia were one of several factors prompting a review
of quota fees for fisheries. In the Philippines, the rent for grasslands was used in negotiations between government and ranchers to revise grazing fees (Batcagan 2000).
In assessing the contribution of the resource to the economy, it is also useful to calculate the contribution of rent taxes to total government revenues, and the share of resource
management costs incurred by government that are recovered through taxes on rent. These uses of SEEA for resource management are fairly recent recommendations in the SEEA and have not been carried out routinely by all countries compiling asset accounts.
Government’s reliance on tax revenues from its resources may be quite significant in some small, resource-dependent economies. For example, the government of Botswana receives about 50% of its revenue from taxes on mining. Even in Norway, the petroleum industry makes a significant contribution to government revenue, 7–8% in recent years (Central Bureau of Statistics, unpublished data 2000). A comparison of rent and resource management costs has been carried
Figure 6. Resource rent and subsidies to fisheries in Norway, 1985 to 1995
Source: Norwegian Central Bureau of Statistics 2000.
-4,500 -4,000 -3,500 -3,000 -2,500 -2,000 -1,500 -1,000 -500 0 500 1985 1986 1987 1988 1989 1990 1991 1992 1993 1994 1995 Rent Govt. appropriation millions of NOK
Environment Department Papers 24
Policy Applications of Environmental Accounting
out by some European countries, as well as Chile, Costa Rica, and Namibia.
ECONOMIC EFFICIENCY — POTENTIAL VS. ACTUAL VALUE OF ASSETS
Resource management can be evaluated from the point of view of economic efficiency to determine if alternative policies might increase the income generated and, hence, the economic value of a resource. While it is unlikely that any industry is perfectly efficient, the fisheries industry in Norway represents an extreme case of economic inefficiency where the economic value of its fish stocks is zero.
Analysis of micro-survey data of Norway’s herring fishery found significant differences in rent-earning capacity between large and small fishing vessels. Generally, the large-scale operations were more efficient and generated rent. Assuming that most of the fishery could potentially be managed in a such an efficient manner, one study of Norway’s herring fishery estimated the potential resource rent of 1,000 million Norwegian kroner (Flam 19