Dollarization of the Banking System
Good or Bad?
Gianni De Nicol6 Patrick Honohan
AlainIze
The World Bank
Development Research Group Finance
and
International Monetary Fund
Monetary and Financial Systems Department August 2003
Public Disclosure Authorized
Public Disclosure Authorized
Public Disclosure Authorized
I
POLICY RESEARCH WORKING PAPER 3116Abstract
De Nicol6, Honohan, and Ize assess the benefits and * Dollarization is likely to promote financial risks associated with dollarization of the banking system. deepening only in a high inflation environment. The authors provide novel empirical evidence on the * Financial instability is likely higher in dollarized determinants of dollarization, its role in promoting economies.
financial development, and on whether dollarization is The authors discuss the implications of these findings associated with financial instability. They find that: for financial sector and monetary policies.
* The credibility of macroeconomic policy and the quality of institutions are both key determinants of cross-country variations in dollarization.
This paper-a joint product of Finance, Development Research Group, and the Monetary and Financial Systems Department, International Monetary Fund-is part of a larger effort to examine institutional determinants of financial development and stability. Copies of the paper are available free from the World Bank, 1818 H Street NW, Washington, DC 20433. Please contact Agnes Yaptenco, room MC3-439, telephone 202-473-8526, fax 202-522-1155, email address [email protected]. Policy ResearchWorkingPapersare also posted on the Web at http://econ.worldbank.org. The authors may be contacted at [email protected], [email protected], or [email protected]. August 2003. (43 pages)
The Policy Research Working Paper Senes disseminates the findings of work in progress to encourage the exchange of ideas about development issues. An objective of the series is to get the findings out quickly, even if the presentations are less than fully polished. The papers carry the names of the authors and should be cited accordingly. The findings, interpretations, and conclusions expressed in this paper are entirely those of the authors. They do not necessarily represent the view of the World Bank, its Executive Directors, or the
countries they represent.
by
Gianni De Nicol6, Patrick Honohan, and Alain Ize
JEL Classification Numbers: E52, F36, G21
Keywords: Dollarization, Financial Deepening, Financial Instability
'Patrick Honohan is with the Financial Sector Operations and Policy Department of the World Bank; Gianni De Nicol6 and Alain Ize are with the Monetary and Financial Systems Department, Intemational Monetary Fund. The paper has benefited from the comments of Thorsten Beck, Augusto de la Torre, Asli DemirguS-Kunt,
Olivier Jeanne, Aart Kraay, Eduardo Levy Yeyati, and Giovanni Majnoni and other colleagues, including participants at a joint Bank-Fund research seminar. Excellent research assistance by Colin Andrews and Kalin
Tintchev is acknowledged. Authors' email addresses: [email protected]; phonohan(worldbank.org; and aize(nimf.org.
Contents Page
I. Introduction ...3
II. How Broad and Uniform Is the March to Dollarization? ... 5
III. What Causes Domestic Dollarization? ... 11... A. Theory ... 11
B. Empirical Estimates ... 14
IV. Has Dollarization Promoted Financial Development? ... 20
V. Are Dollarized Financial Systems Inherently Fragile? ... 23
VI. The Case for Prudential Activism ... 26
VII. The Case for Monetary Reform ... 28
VIII. Conclusions ... 31
References ... 40
Text Tables 1. Evolution of Average Foreign Currency Deposits to Total Deposits ... 6
2-A. Cross-sectional Determinants of Dollarization ... 16
2-B. Cross-sectional Determinants of Dollarization ... 17
2-C. Cross-sectional Determinants of Dollarization ... 18
3. Changes in Dollarization ... 19
4. Determinants of Monetary Depth ... 22
5. Dollarization and Solvency Indicators ... 25
6. Dollarization and Deposit Volatility ... 25
7. Indicators of Domestic Dollar Financial Intermediation: 2001 ... 26
Figures 1. Dollarization and Inflation ... 9
2. Deposit and Loan Dollarization ... 10
3. Financial and Real Dollarization ... 11
Boxes 1. Estimating Trend Dollarization ... 7
2. Varied Dynamics ... 8
Appendix Tables 1. Foreign Currency Deposits to Total Deposits ... 33
2. Maximal and Estimated Trend Shares of Foreign-Currency-Denominated Deposits ... 36
3. Restrictiveness of Rules on Resident Holdings of Foreign Currency Deposits Onshore, 2000 ... 38
I. INTRODUCTION
One of the most noteworthy features of globalization during the last two decades has been the rapid increase in de facto dollarization, i.e.,the domestic use of a foreign currency (typically the U.S. dollar) in most emerging market, developing, or transition economies. Foreign currency has increasingly been used, alongside the local currency, in all three of the classic functions of money (means of payment, store of value, unit of account).
In view of the increasingly easy access to offshore deposits (even when prohibited by law), partly as a result of growing globalization and progress in communications and information technology, the authorities have been confronted with an uneasy choice between allowing deeper financial intermediation at home though denominated in dollars, or pushing it offshore and stifling domestic financial innovation. While some countries have actively discouraged dollarization through administrative means, most have chosen to accommodate market forces by allowing financial intermediaries to offer dollar-denominated deposits (and
loans) to their domestic customers. In many such countries the process has taken hold to the point where it is now appropriate to speak of a de facto "dual currency regime."
While highly dollarized countries could abandon their national currency altogether and opt instead for the exclusive use of foreign currency as legal tender, only a few have so far made that choice. But neither have such countries generally taken the steps needed to rehabilitate the local currency as the medium of choice in intermediation. In most cases, surges in dollarization have come in response to clearly identified episodes of monetary chaos that undermined the credibility of the local currency. The difficulties faced by national authorities in restoring their reputation and credibly committing to sound monetary policies seem to have raised the bar too high for most of those contemplating to follow this route, and many
seem to regard dollarization as irreversible and not subject to policy influence.
Instead, by allowing a dual currency regime to take hold, the monetary authorities have hoped to have their cake and eat it. They have sought to expand intermediation by allowing the use of foreign currencies. Recognizing the heightened microeconomic risks of currency fluctuation under these circumstances, some have hoped to buy stability cheaply by closely tying their exchange rate to the dollar. But by retaining the possibility of employing
exchange rate flexibility, the dual currency system seems to offer an insurance policy against large shocks that is not available with a currency board.
This paper explores the extent to which the fears and hopes which have led to this policy reaction are justified. Using a large sample of about a hundred countries, we provide clear empirical evidence on the three main points at issue. First, it is true that permitting
dollarization can support a deeper financial system, but only in inflationary economies. Second, absolute pessimism with regard to the degree to which dollarization can be
influenced by policy is not warranted: we show that policy does matter. Finally, we present evidence that intermediaries in dollarized financial systems seem prone to higher risk.
The empirical analysis begins with the determinants of deposit dollarization, building on the work of Ize and Levy Yeyati (2003), and controlling for the impact of relevant regulations. We find that macroeconomic policy-partly captured by the minimum variance portfolio
calculated from observed covariances-and the institutional structure are both key determinants of cross-country variations in dollarization.
Turning to the consequences of deposit dollarization, we extend the work of Honohan and Shi (2003) to find that allowing de facto dollarization has in practice promoted a deeper domestic financial system, but only in inflationary economies, i.e., dollarization has the effect of moderating the adverse effect of inflation on financial depth.
The third empirical component addresses the contribution of dollarization to risk in the banking system. Whether we measure this risk by the mean ratio of nonperforming loans, the volatility of deposits, or a proxy aggregate measure for a bank's "distance-to-default," we find that risk is heightened in dollarized economies.
The results point to a first-best policy of reducing dollarization's attractions through improved macroeconomic and institutional policies. Central banks wishing to reverse or contain the growth of dollarization face the same challenge any producer of goods and services faces: only products whose quality is reliable will sell. The experience of the few countries that have succeeded in reversing (or at least containing) financial dollarization by means of credible monetary policies and sound institutional frameworks supports this view. Pending achievement of this first-best policy, the authorities need to address the risk
environment, and to make sure that their own actions do not worsen it. Indeed, in a
misguided attempt to avoid undermining the balance sheets of dollar borrowers and banks, monetary authorities faced with growing dollarization have in several cases moved to a brittle regime, becoming averse to sharp exchange rate movements and displaying acute "fear of floating" (Calvo and Reinhart, 2002). In tum, the perception of assured exchange rate stability by the private sector promotes the moral hazard of further dollarization. Even if agents are not unaware of the risk of devaluation, it seems safe to transact in dollars when everybody else does so not least because a bailout of depositors and debtors becomes more likely in the event of an abrupt policy regime change. This vicious circle can end in crisis. Instead of falling into the trap of a brittle crisis-prone exchange rate regime, the authorities need to deal with the extemalities associated with currency mismatches through a more effective prudential policy that seeks to ensure that financial intermediaries and their customers intemalize the risks of dollarization.
Although there is a large and growing body of literature on related issues such as the contributory role of currency mismatches in balance sheets to banking crises (cf. Goldstein and Turner, 2002), currency boards and full (de jure) dollarization,2 home bias effects in portfolio selection (cf. for example Tesar and Wemer, 1994), and foreign borrowing, the focus on dollarization has been largely from the perspective of foreign investors; the
empirical literature on domestic dollarization (i.e., from the viewpoint of domestic investors) is comparatively sparse (see Honohan and Shi, 2003 and references therein). Instead, our
2
Especially arising out of the problems associated with the Argentine currency board. See, for example Mussa (2002), and De la Torre, Levy Yeyati, and Schmukler (2003).
Section II documents the rising trends in financial dollarization across the world and contrasts such trends with the general decline of inflation and the asymmetric evolution of other forms of dollarization, particularly real dollarization. Section III briefly reviews the
literature on the determinants of domestic dollarization and presents new empirical results that extend previous findings in this area. Sections IV and V provide empirical evidence on the potential benefits of dollarization for financial development, as well as its-risks. The following two sections address the policy response, covering both the need for heightened prudential action to ensure maximum internalization of dollarization risks (Section VI), and the implications of dollarization for monetary and exchange rate policy (Section VII). Section VII concludes.
H.
How BROAD AND UNIFORM IS THE MARCH TO DOLLARIZATION?In this paper domestic financial dollarization is measured as the ratio of onshore foreign currency deposits to total onshore bank deposits.4 This measure has obvious shortcomings. It assigns equal weight to demand deposits, reflecting payments dollarization, and time
deposits, reflecting financial dollarization. On the other hand, it fails to include dollar cash and offshore deposits, which constitute a substantial fraction of investors' portfolios in some countries.5 It also ignores nonbank holdings of financial instruments, such as government securities, shares in mutual funds, pension and insurance claims, and all derivative
instruments, which probably constitute a dominant part of private portfolios in countries with more sophisticated financial systems.6 Yet, it has the benefit of being the most readily
available. Thus, our sample comprises 100 countries, including a large number of developing and emerging market countries, as well as countries that have transitioned from a centrally planned to a market economy and some industrial economies.7
3The policy conclusions of our paper thus mostly coincide with those of Goldstein (2002).
4It is useful to distinguish among three generic types of dollarization that broadly match the three functions of
money: payments dollarization (also known in the literature as currency substitution), is residents' use, for transaction purposes, of foreign currency in cash, demand deposits, or central bank reserves;financial dollarization (also referred to as asset substitution) consists of residents' holdings of financial assets or liabilities in foreign currency; real dollarization is the indexing, formally or de facto, of local prices and wages to the dollar. In turn, financial dollarization may be domestic (i.e., associated to claims of residents, including against the government), or external (i.e., associated with the claims of nonresidents against residents).
S On dollar cash holdings in transition economies, see Porter and Judson (1999). Offshore holdings of foreign
exchange deposits are very sizable for many countries, especially in Africa (Hanson, 2002, 2003).
6
In Mexico, for example, there are indications that claims on institutional investors, which are largely invested in dollars, have grown much faster than claims on banks during recent years. Moreover, the scope for dollar lending is enhanced through the use of derivatives, as banks lend a substantial fraction of their peso deposits in dollars and cover their exposure through forward foreign exchange transactions.
7Our sample encompasses the 1990-2001 time span but data for the full period are not available for all countries (see Appendix Table 1).
Very high rates of dollarization have been recorded in some countries in all regions of the world, with the overall maximum of almost 95 percent in Cambodia approached closely by the 93 percent recorded in Bolivia, and upwards of 80 percent in Bosnia-Herzegovina, Angola, and Georgia, for example and almost 70 percent in Lebanon. Clearly, however, the dollarization phenomenon has not affected all countries equally, with some countries remaining nearly untouched. In some cases, such as in Brazil, Colombia,8 Thailand, Venezuela and some of the Caribbean islands, official prohibition of, or restrictions on, dollarization has limited dollarization.
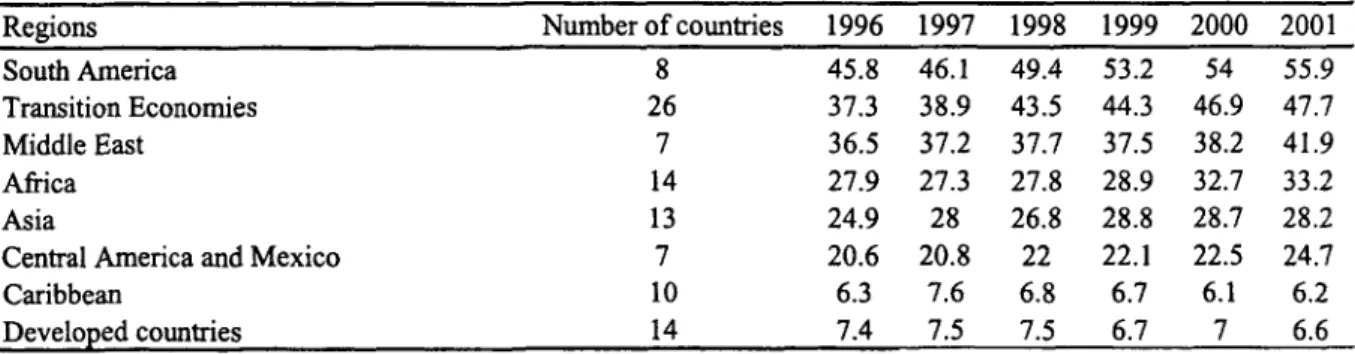
With some exceptions, de facto dollarization has gained ground across the board in recent years. Annual trend growth in dollarization across the world during the past decade is estimated at about 1 percentage point per year (Box 1). All in all, 64 countries displayed a clear upward trend throughout the sample period. Yet, there have also been important variations in dollarization trends, both across regions and across countries. Dollarization increased most sharply in Latin America and the transition countries (Table 1; Figure 1); it also increased, albeit somewhat more moderately, in Africa, Asia, and the Middle East; it remained constant on average (and low) in the Caribbean region and the industrial countries. The evolution of dollarization over time has also varied substantially across countries (Box 2). A handful of countries, including Egypt among the developing countries, Israel and Mexico among the emerging market countries, and Poland, Hungary, Slovenia and Latvia among the transition economies, have experienced important reductions in dollarization in recent years.
Table 1. Evolution of Average Foreign Currency Deposits to Total Deposits (in percent, unless otherwise indicated)
Regions Number of countries 1996 1997 1998 1999 2000 2001
South America 8 45.8 46.1 49.4 53.2 54 55.9
Transition Economies 26 37.3 38.9 43.5 44.3 46.9 47.7
Middle East 7 36.5 37.2 37.7 37.5 38.2 41.9
Africa 14 27.9 27.3 27.8 28.9 32.7 33.2
Asia 13 24.9 28 26.8 28.8 28.7 28.2
Central America and Mexico 7 20.6 20.8 22 22.1 22.5 24.7
Caribbean 10 6.3 7.6 6.8 6.7 6.1 6.2
Developed countries 14 7.4 7.5 7.5 6.7 7 6.6
Sources: IFS, EDSS, and central banks' statistical publications.
8 Like Chile, Brazil and Colombia have also developed alternative indexation mechanisms, such as
Box 1. Estimating Trend Dollarization
Trend dollarization can be estimated from a pooled cross-section time series regression
yj, = ao + fiyi,, + t, where y is dollarization and t the year. The estimated coefficient
,B is 0.63 with a t-statistic of almost 24; the estimated time trend coefficient y is 0.32 with a t-statistic of almost 4. These estimates imply that the trend share of dollarization for each country, calculated as (a, + )/(1- ,), increases by about 0.9 percentage points per annum, while deviations from the trend line are closed at the rate of 63 percent of the deviation per annum.
Surprisingly, the data set as a whole reveals no indication of a ratchet effect. A simple test for this is to include the "maximum share to date" as an additional regressor (see Appendix Table 2). If there were a loose ratchet effect, then economies with a high previous dollarization should, all other things being equal, tend to have a high current dollarization. Thus, the historic high should have a positive effect, but in fact the estimated coefficient is both very small and altogether insignificant (t=0.3).
An additional point is worth mentioning: namely, there is an important mechanical valuation effect linking exchange rate changes with measured dollarization shares. If D is total value of domestic currency deposits, measured in local currency, F the total value of foreign currency deposits, measured in foreign exchange, and if E is the exchange rate, then the dollarization ratio y can be written FEI(FE + D). Rearranging, we obtain: lly = 1 + DIFE. Thus, even without any change in the values of D or F, a change in the exchange rate E will pass through to affect dollarization. A panel log-regression of the (log) change in y on both its lagged value and the change in exchange rate suggests that almost two-fifths of any exchange rate change over the previous year is passed through to next period's dollarization rate. Alternatively, fitting
yj, = a, + flM,y, + )t + 5(e,, - e,_ ), where e is the log exchange rate, we obtain fitted values as follows. The estimated coefficient ,B is 0.68 with a t-statistic of almost 26; the estimated time trend coefficient y is 0.34 with a t-statistic of over 4. These estimates imply that the trend share of dollarization for each country, calculated as
(a, + yt) /(1 - ,8), and as such assuming long-run exchange rate stability, increases by
about 1.1 percentage points per annum, while deviations from the trend line are closed at the rate of 68 percent of the deviation per annum.
Box 2. Varied Dynamics
Running against the general experience, a handful of countries and areas had a systematic downward trend' during the sample period. The biggest reductions in our sample were in Bosnia and in Egypt; both are countries that recovered from very high inflation episodes; two other post-inflationary transition economies-Slovenia and Poland- also saw sizable reductions. More surprising is the presence in this group of Hong Kong SAR and Saudi Arabia. Despite the falls, all of the six countries and areas mentioned still have moderate-to high deposit dollarization-about 18 per cent and up. It should also be noted that two emerging market countries, Israel and Mexico, reported significant declines in dollarization during the first part of the 1990s (these declines do not show up in our sample for these countries, which starts in 1997).
A further handful of countries experienced a hump-shaped pattern, with dollarization first rising, then falling in the sample period. Two transition economies-Latvia and Hungary-are most conspicuous in this category.2
About a dozen display U-shaped curves: dollarization first falling and then rising. Six of these countries are transition economies in Central and Eastern Europe (Albania,
Armenia, Czech Republic, Estonia, Georgia, Lithuania), and three are transition-type economies outside Europe (Mongolia, Mozambique, Republic of Yemen). Here we may suppose that initial attempts at stabilization succeeded in lowering initial high dollarization levels, but subsequently the general worldwide upward trend resumed.
One (United Arab Emirates) is an offshore center. The last two (Chile and the Democratic Republic of the Congo) are different. The Democratic Republic of the Congo remains a most unstable macroeconomy as witness its always high dollarization ratio. Chile's ratio has fluctuated around an increasing, though still moderate trend.
Eight countries (Bahrain, Belarus, Ghana, Malawi, Nigeria, Russia, Tanzania, Ukraine) exhibit somewhat erratic movements. The remaining 63 countries have either fairly
steady upward trends or only small movements.
1/ This analysis of contrasting trends is based on the following classification. A steady downward (upward) slope means that the latest figure is less (greater) than the maximum by more than 3 percentage points and there were no years in which the figure increased (decreased) by as much as 3 percentage points. U-shaped and hump-shaped patterns mean that the time series can be divided into upward and downward sloping subperiods, using the above definition. Countries with less than 3 percentage points bracketing max and min figures are said to have small movements, and the remainder are said have erratic movements.
2/ The two other largest countries in this category reflect special events: Greece's decline in 2001 reflects its adoption of the euro in that year; Indonesia's peak in 1997 surely owes much to the valuation effect of the sharp devaluation in that year.
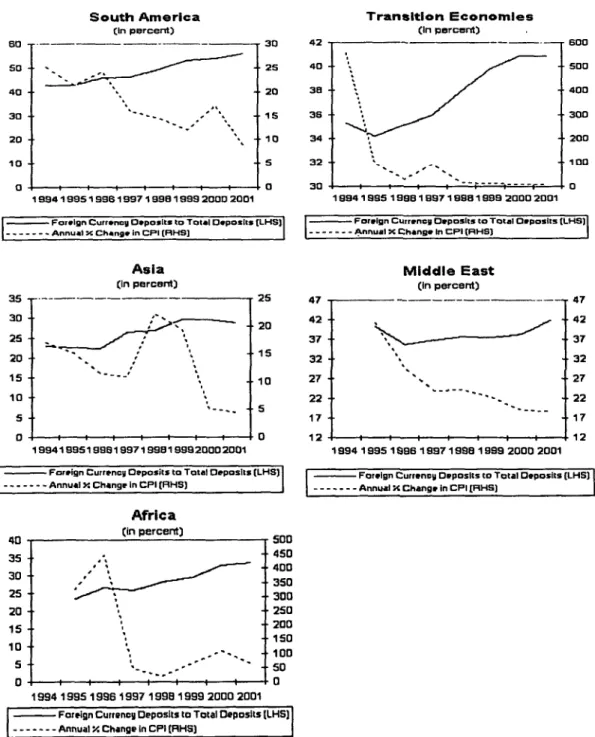
The patterns in Table 1 and Figure 1 raise two basic questions: (i) why has financial dollarization continued to gain ground, on the whole? and (ii) what factors have influenced the contrasting experience of different countries? The first question is apparently all the more puzzling in view of the stark contrast between the rising dollarization and the declining worldwide inflation.
Figure 1. Dollarization and Inflation
South America Transition Economies
(in percent) (In percert)
80 __30 42 B oo- 600 50So - 25 40 500 40 20 38 400 30 - . -- 1 5 35 300 20 10 34 200 10 1 32 I 1-00 O 0 30 0 199419951993199719981999 2000 2001 19941 995 1 996 19971 9S9 1999 2000 2001 Foreign Currenog Deposits to Total Deposits tLHS3 Foreign Currenrlg Deposits to Total Deposits LHSI|
-Annual x Change in CPI (RHSi] _-3--- _ Annual X Change In CPI (RiHS
Asia Middle East
(in percert) (in percent)
35 -______ _ 25 47 - 47 30 . ._.___ '' 20 2 _______ 42 25 373 20 32 *32 1 5 10 27 27 I10 22 - . ---- 22 5 1 7 1 7 a 0 12 12 19941995199819971998199920002001 1994 1995 189B 19971998 1999 2000 2001 Foreign Currencg Deposits to Total Deposits (LMS| Foreign Currencg Deposits to Total Deposits (LHS| --- Annual X Change In CPI (RHS) --- Annual X Change in CPI [RHSl
Africa
40 -t(in percernt Soo
35 --450 30 , " ''5400 25 . 300 20 - 250 15 200 0 ~ ~ ~ ~ ~ ~ ~ ~~~5 10 , - -'- --- 10 1994 1995 1 996 i 997 1998 1999 2000 2001
Foreign CurrenoV Deposits to Total Deposits ILHS)
---
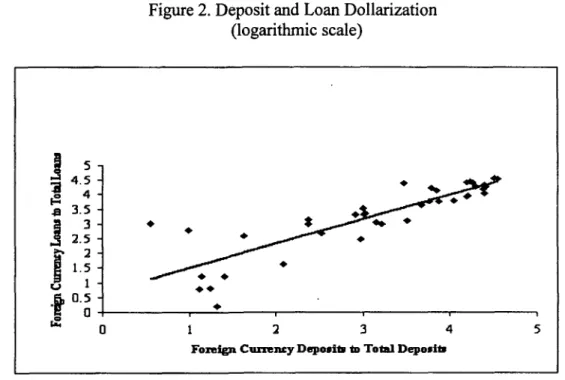
Before proceeding to explore these questions, some useful observations need to be made on the extent to which different forms of dollarization are correlated. Financial dollarization patterns, as measured by the dollarization of domestic loans (instead of deposits), are broadly similar. However, loan dollarization is generally lower than deposit dollarization as banks often maintain a sizable fraction of their foreign currency deposits in liquid correspondent accounts or sovereign assets abroad. The cross-country relationship between loan
dollarization and deposit dollarization is less than proportional, with a 10 percent increase in foreign currency deposits resulting, on average, in a 7.3 percent increase in foreign currency
loans (Figure 2).9 This asymmetry appears largely to reflect the inherent risks attached to dollar intermediation, that induce banks to limit their dollar loans and maintain large dollar liquidity buffers.
Figure 2. Deposit and Loan Dollarization (logarithmic scale) 15 4 .5
11.1-
4 - 0.5-X 0 1 2 3 4 5Fon:ign Cumnty Depouitu to Total Deposit
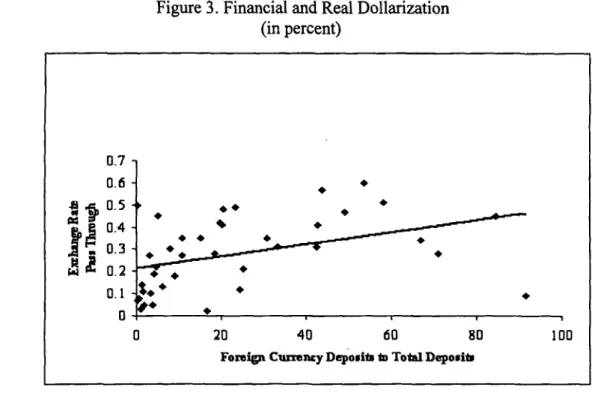
On the other hand, real dollarization (the use of the dollar for price and wage contracts) appears to remain generally limited, even in financially highly dollarized countries. While data limitations prevent a direct measurement, the pass-through of exchange rate changes into prices provides useful indirect evidence. A clear positive correlation exists between financial and real dollarization (Figure 3). However, the relationship is subjected to substantial variability and is much less than proportional (the elasticity between financial dollarization and real dollarization is only about 0.25), suggesting that other factors are at play than those causing financial dollarization.'0 This broad-brush econometric evidence is
9 hi asymmetry was first detected by Honohan and Shi (2003).
'° Here we use the estimates of the one-year pass-through reported in Choudhri and Hakura (2001). Similar evidence is reported in Honohan and Shi (2003).
supported by casual evidence in highly dollarized countries, such as Bolivia and Peru, which indicates that the vast majority of wages continues to be paid in local currency, with only few exceptions (such as for some top executives). '1
Figure 3. Financial and Real Dollarization (in percent)
0.7 0.6
-0.1
0 20 40 60 80 100
Foreign Cumncy Depositb tD Total Deposits
III. WHAT CAUSES DOMESTIC DOLLARIZATION?
A. Theory
Explanations for payments dollarization have been amply discussed in the currency
substitution literature, based on inflation differentials that penalize the holdings of domestic currency. 12While some holdings of foreign currency deposits may also simply reflect the convenience of having transactions balances in the currency of payments, especially by corporates involved in foreign trade, this cannot explain dollar holdings in the financial
" Nonetheless, dollar indexation in the real sector appears to have made inroads over the years. In Bolivia, for example, it now affects most utility prices, pensions, parts of the tax system, accounting standards, and some
supplier contracts. In Peru, a number of services, including residential and commercial leases, real estate, professional services, and insurance premia, are priced in dollars.
12 While the persistent use of the dollar once inflation has abated (hysteresis) has been amply documented in the
currency substitution literature, based on transaction costs and "network" externalities, the opposite phenomenon, the persistent use of the local currency for payments, even at the height of hyperinflations or when financial dollarization has become practically universal, is equally noteworthy. The wide availability of
local cash, which is supplied at no cost, and the injection of local currency through public sector payments activates Gresham's Law, e.g., the public disposes of the "bad" local currency it receives by using it for payments and keeps the "better" currency (the dollar) under the mattress.
system on the observed scale. As term deposits, rather than demand deposits, constitute the bulk of total dollar deposits, explanations for financial dollarization clearly need to be based on different premises. Under the reasonable premise that interest rate parity holds, at least approximately, interest rate differentials should offset any predictable inflation differential, equalizing expected returns in both currencies. Thus, while inflation levels may still matter at the margin (to the extent they distort the intertemporal pattern of debt-servicing costs), explanations for financial dollarization must essentially be based on volatilities rather than levels. Domestic residents should prefer to denominate contracts in foreign currency when its purchasing power in terrns of domestic consumption is stable (e.g., the expected volatility of the real exchange rate is low) relative to that of the local currency (as measured by the expected volatility of inflation).
Based on a static CAPM model with risk averse borrowers and lenders, Ize and Levy Yeyati (1998) find considerable support for this hypothesis. Domestic financial dollarization can be largely explained across a wide spectrum of countries through minimum variance portfolio (MVP) allocations that reflect a closed equilibrium in the market for loanable funds and depend on the relative volatilities of inflation and the real exchange rate. Ize and Levy Yeyati explain the permanence of domestic financial dollarization after inflation has abated by the-fact that the volatility of the real exchange rate may have declined as much as (or more than) that of inflation. They find this to have been the case in several of the highly dollarized Southern American economies and interpret it as a manifestation of "fear of floating."
This simple portfolio approach provides a number of useful additional insights. In particular, it identifies a causal channel from globalization to financial dollarization (due to the higher weight of tradable goods in the consumption basket, more open economies should be financially more dollarized) and between financial dollarization and financial repression (unremunerated reserve requirements or administrative limits on interest rates on local currency deposits should depress local currency intermediation, particularly under an inflationary environment; see Ize and Levy Yeyati, 1998, and Catao and Terrones, 2001). Strikingly, the portfolio approach explains the increased dominance of the dollar over weaker currencies as contract maturities lengthen. The uncertainty attached to future inflation (a nominal variable) rises without bound over the time horizon, unlike that of the real exchange rate, which is anchored by a long-term purchasing power parity condition. 13
Observed variances and covariances need not correspond to their expected values, however, notably where there is a nonegligible probability of a major regime change ("peso effect"). 14
Thus, the persistence of dollarization can also be explained by credibility effects as enduring fears of a collapse of the monetary regime and a return to high and unstable inflation lead to a persistent wedge between expected and observed volatilities. In the extreme case of a fixed
13 The relative stability of U.S. real interest rates (together with the constancy of the real exchange rate over the
long term) provides an additional reason for preferring dollar-denominated long-term instruments to long-term local currency instruments (which are generally more exposed to interest rate risk). This argument is formally developed by Campbell, Viceira, and White (2002) in an intertemporal portfolio model.
14 Persistent high excess returns on local-currency-denominated assets accompanying exchange rate stability,
punctuated by occasional sharp devaluations and negative excess return events, is a stylized feature of numerous emerging market economy experiences (Cochrane, 1999).
peg, such as a currency board, the preference for dollars only depends on expectations of how monetary policy would be managed in the event of a collapse, no matter how remote this eventuality (Ize and Parrado, 2002). The probability and modalities of such a collapse are likely to reflect a host of factors, including fiscal discipline, as well as the institutional, political, legal, and even cultural environment. Proxy variables capturing systematic differences in these dimensions can thus be expected to have some explanatory power for dollarization in addition to observed volatilities.
Lack of monetary credibility can also explain dollarization without resorting to portfolio effects, when combined with the possibility of debt defaults. Calvo and Guidotti (1989) provide an early illustration of this effect in the context of public debt. Lack of monetary credibility (deriving from the monetary authorities' inability to precommit) can raise the cost of domestic currency debt to the point where it becomes optimal for the government to effectively default on the debt (through inflation). In such cases, the local currency ceases to be an effective medium for financial contracts. Instead, indexed debt (including dollar debt) becomes the medium of choice. Jeanne (2002) shows that lack of monetary credibility can similarly undermine the usefulness of the local currency in private contracts. The expectation of a depreciation under a fixed peg (that increases the risk premium on local currency debt) induces a shift to the dollar because it increases the probability of default on local currency loans and, hence, increases the cost of insurance against devaluations. The rationale is much the same as that of a driver who, faced with an increase in his insurance premium, decides to drive without insurance.15
In all of the above papers, it is important to note, however, that dollarization is a rational response to a weak monetary policy. The level of dollarization chosen by private agents conditional on a given underlying macro volatility and monetary regime yields an optimal currency mix in terms of risk-cost trade-offs.
In contrast, the possibility of debt defaults can promote socially excessive dollarization when combined with moral hazard. In McKinnon and Pill (1999), Dooley (2000), Schneider and Tornell (2000), and Burnside, Eichenbaum, and Rebelo (2002), the source of moral hazard is government intervention that provides free insurance against currency risk. When borrowers and lenders expect to be bailed out by governments in the event of a large depreciation, they do not fully internalize the risks they bear when borrowing in foreign currency. Instead, they benefit from low and stable dollar rates as long as the exchange rate holds and expect the government to insure them against potential losses in the event of a large depreciation. Because it is hard for governments to convincingly precommit not to bailout, the maintenance of a stable exchange rate in a dollarized economy can be perceived as an implicit commitment of the monetary authorities. Thus, reneging on this commitment is viewed as a "catastrophic" systemic event calling for government intervention. In this
15 While contracting in local currency provides a way for borrowers to protect themselves against a large potential increase in the cost of debt, this insurance benefit disappears when the high cost of insurance can itself
cause a default. Borrowers prefer then to borrow in dollars because (for a moderate devaluation probability) the odds of defaulting on dollar loans are lower than those of defaulting on local currency loans. Risk in this model is not measured by historic volatility and second moments but by first moments, as reflected in risk premia.
paradigm, large international reserves and exchange rate pegs (or quasi-pegs) can thus encourage financial dollarization by enhancing the value of the government guarantee.
Moral hazard can also arise due to market failures or a deposit insurance. In Aghion, Bacchetta, and Banerjee (2001) and Chamon (2001), because borrowers are more likely to default when the exchange rate depreciates and their debt is in dollars, they do not internalize the actual cost of dollar borrowing. At the same time, because creditors do not observe the currency composition of borrowers' total debt, and local currency claims get diluted relative to dollar claims under a liquidation, they require a high premium on local currency loans, thereby increasing the cost of borrowing in local currency. In equilibrium, incentives for excessive dollar borrowing are thus generated from both the supply side and the demand side of the market for loanable funds. Broda and Levy Yeyati (2003) show that, by limiting the risk of lending in dollars, a deposit insurance that applies uniformly across all deposits exacerbates such incentives for dollarization.16
B. Empirical Estimates
Basing our specifications on the above theoretical discussion, we conducted cross-section estimates of the determinants of dollarization levels. Results are reported for three alternative dependent variables: (i) the 2001 level of deposit dollarization (ratio of onshore foreign
currency deposits to total bank deposits); (ii) the average level for available years during the sample period 1990-2001; and (iii) a calculated country-specific equilibrium level for 2001, based on a simple trend-augmented autoregressive model. The second and third alternatives have the advantage of being available for more countries; the third is intended to take
account of the many countries which experienced substantial variation in dollarization during the sample period and for which the simple average would be unrepresentative of the
equilibrium situation at the end of the period. In the event, results for the three alternative dependent variables are quite similar, as are those (unreported) for a fourth, namely the maximum level of dollarization recorded for each country during 1990-2001.
To account for the impact of administrative restrictions on dollar deposits, we constructed a dummy variable based on several indicators.'7 The main additional explanatory variables
16
Risk factors can also work against dollarization. For instance, the risk of local bank failure could encourage the export (legal or otherwise) of all but local currency transactions balances to offshore banks, thereby
lowering (onshore) dollarization. The same would apply to the risk of expropriation or capital levies, more so if these were expected to be selectively applied to foreign exchange deposits (as with compulsory conversions at off-market rates in the case of Mexico, 1982 and Argentina, 2001 to mention just the most well-known). Fear of imposition of capital controls or the introduction of non-market-clearing exchange rates would fall into the same category.
17 The IMF's Annual Report on Exchange Arrangements and Exchange Restrictions contains information about
the regulatory position in this regard. Our summary of the major features is tabulated in Appendix Table 3 for the countries in our dollarization sample, along with particulars for a handful of other countries included as controls. These additional countries are included because they either have or had in the recent past rather restrictive rules about resident onshore foreign currency deposits. Not surprisingly, most of the countries for which we have data on dollarization have a fairly liberal regime. Indeed, the trend has been generally towards liberalization in this regard. For example, the table provides an instant explanation for the very low rate of dollarization recorded for tiny Dominica: this can easily be attributed to the restrictive rules. On the other hand, although Appendix Table 3 shows our own simple composite index of restrictiveness, it is not possible from the
employed in the estimation are intended to capture the risk environment. They include: (i) risk measures based on observed price movements: the "warranted" dollarization share based on the minimum variance portfolio calculated from historic variances and covariances of prices and exchange rates (as discussed above),'8 and the correlation between the price of foreign exchange and GDP as a measure of the potential of the dollar as a real hedge;'9 (ii) proxies for policy credibility effects, including the rate of inflation;20 the adoption of a formal inflation targeting regime; institutional variables based on the measures of political and institutional development originally assembled by Kauftman, Kraay, and Zoido-Lobaton (KKZ, 1999) and a measure of legal protections of creditors;2' and (iii) a dummy regional variable for countries in transition.22
The results reported in Regression Tables 2 (A, B and C) show that the "market share" of foreign-currency-denominated deposits does respond as anticipated to indicators of the overall risk environment. Regression 1.1 shows the role of the core regulatory and market risk factors. The dummy variable measuring administrative restrictions is highly significant with a coefficient that implies that shifting from completely unrestricted to highly restricted would lower dollarization by about 37 percentage points. The predicted minimum variance portfolio is also highly significant with a coefficient that implies that an increase of
2 percentage points in the minimum variance portfolio would increase actual dollarization by almost 1 percentage point. These two variables remain significant through all of the
specifications explored and their coefficients remain of the same order of magnitude throughout, though with the minimum variance portfolio's impact falling to about one for three instead of one for two.
information provided to be confident of having obtained a fully satisfactory overall index. For example, when the Report states that prior approval is required, it is not clear how much discretion is applied and whether implicit or unreported requirements for such approval are significant.
18 The calculation is A = V(Ir) + Cov(Ir,s) where 7r is inflation and s is real depreciation. The underlying V(yr) + V(s) + 2Cov(r, s)
model assumes uncovered interest parity and thus the minimum variance portfolio depends only on price and exchange rate covariances (cf. Ize and Levy-Yeyati, 2003).
19 Because exchange rate depreciations are often accompanied by output drops when caused by external shocks or confidence crises, the dollar may be viewed as a "safe haven" by depositors if it provides high financial returns at a time when real incomes are falling.
20 The rate of inflation, measured as a multi-year average, is seen as a measure of overall macroeconomic stability and credibility and not as a rate of return: after all it is not the opportunity cost of holding interest-bearing local currency deposits.
21 The legal protections variable employed is based on the historic origin of each country's legal system and
draws on extensive recent econometric analysis of the relevance of legal protection of creditors for different aspects of financial development (cf. La Porta et al., 1998; Levine et al., 1999).
Equation: 1.1 1.2 1.3 1.4 1.5 1.6
Variable Coeff. t-Stat Coeff. t-Stat Coeff. t-Stat Coeff. t-Stat Coeff. t-Stat Coeff. t-Stat
Constant 30.6 ***8.9 50.2 ***10.0 44.47 ***7.6 40.3 ***5.3 28.6 ***3.4 31.6 ***3.7
Restrictions on doll -7.48 ***3.1 -6.90 ***4.2 -8.24 ***4.4 -8.69 ***4.6 -7.59 ***4.2 -8.01 ***4.6 Min. var. portfolio 46.6 ***3.7 34.8 ***3.0 35.2 ***2.7 31.8 ***2.4 33.4 ***2.6 30.2 **2.4
Inflation (log) 8.16 ***4.7 4.74 *1.9 3.73 1.3 2.50 0.9 2.72 1.0 Institutions -9.26 **2.0 -10.3 **2.2 -8.92 **2.0 -6.88 1.5 Transition 8.39 1.4 17.2 ***2.7 16.3 ***2.7 Legal protections 13.9 **2.2 13.7 **2.3 Inflat Targeting -11.6 *1.9 R-squared / NOBS 0.221 78 0.406 72 0.439 70 0.457 70 0.491 70 0.511 70 Adjusted R-squared 0.200 0.380 0.404 0.414 0.442 0.456 S.E. of regression 24.1 21.4 21.1 20.9 20.4 20.2 Log likelihood -357.4 -320.8 -310.1 -309.0 -306.7 -305.3 Equation: 1.7 1.8 1.9 1.10 1.11 1.12
Variable Coeff. t-Stat Coeff. t-Stat Coeff. t-Stat Coeff. t-Stat Coeff. t-Stat Coeff. t-Stat
Constant 33.7 ***4.2 31.8 ***3.7 34.6 ***3.5 36.5 ***3.7 48.7 ***6.3 37.6 ***39
Restrictions on doll -7.50 ***4.0 -8.0 ***4.4 -6.44 ***3.5 -6.61 ***3.6 -7.65 ***3.9 -6.02 ***3.3
Min. var. portfolio 30.8 ***2.7 30.1 **2.5 25.2 **2.1 26.9 **2.2 28.1 **2.2 22.2 *1.9
Inflation (log) 4.40 **2.1 3.13 1.2 3.90 1.3 4.11 1.4 5.36 *1.7 5.25 *1.8 Institutions -4.43 0.9 -2.47 0.5 -2.86 0.6 -7.23 1.5 1.16 0.2 Transition 16.9 ***2.8 17.0 ***2.9 12.3 ***11.7 9.81 1.5 -0.50 0.1 15.7 **2.5 InstitutionsxTransn -13.9 **2.4 -10.8 *1.7 -20.6 ***3.1 Legal protections 15.9 **2.5 14.8 **2.4 17.6 **2.2 16.0 *1.9 18.3 **2.1 Inflat Targeting -13.4 **2.3 -11.7 *1.9 -12.0 1.5 -9.86 1.2 -9.94 1.2 GDP-hedge -5.14 0.9 -8.64 1.2 -13.0 **2.1 -7.52 1.2 GDP-hdg x Transn 12.1 1.1 20.8 **2.1 10.6 1.1 R-squared / NOBS 0.516 70 0.522 70 0.520 56 0.529 56 0.477 56 0.560 56 Adjusted R-squared 0.462 0.460 0.438 0.437 0.413 0.462 S.E. of regression 20.0 20.1 20.0 20.0 20.5 19.6 Log likelihood -304.9 -304.5 -242.4 -241.8 -244.8 -239.9
Equation: 1.1 1.2 1.3 1.4 1.5 1.6
Variable Coeff. t-Stat Coeff. t-Stat Coeff. t-Stat Coeff. t-Stat Coeff. t-Stat Coeff. t-Stat
Constant 26.3 ***8.5 43.5 ***10.0 39.2 ***7.6 34.7 ***5.1 25.8 ***3.6 27.9 ***3.7
Restrictions on doll -5.65 ***3.6 -5.02 ***3.8 -5.87 ***3.9 -6.4 ***4.2 -5.47 ***3.7 -6.33 ***4.4
Min. var. portfolio 38.0 ***3.5 29.9 ***2.7 30.7 **2.4 26.7 **2.1 27.8 **2.3 25.6 **2.1
Inflation (log) 7.04 ***4.9 4.60 **2.3 3.45 1.4 2.44 1.1 2.69 1.2 Institutions -6.39 *1.8 -7.63 **2.0 -6.80 *1.9 4.59 1.2 Transition 9.39 *1.7 15.9 ***2.9 15.9 ***2.9 Legal protections 10.8 **2.1 11.2 **2.2 Inflat Targeting -9.32 1.5 R-squared / NOBS 0.199 84 0.382 77 0.401 75 0.432 75 0.462 75 0.488 75 Adjusted R-squared 0.179 0.357 0.367 0.390 0.414 0.434 S.E. of regression 20.5 18.5 18.4 18.1 17.7 17.5 Log likelihood -371.5 -331.9 -322.3 -320.4 -318.3 -312.7 Equation: 1.7 1.8 1.9 1.10 1.11 1.12
Variable Coeff. t-Stat Coeff. t-Stat Coeff. t-Stat Coeff. t-Stat Coeff. t-Stat Coeff. t-Stat
Constant 29.6 ***4.5 28.0 ***3.8 29.6 ***3.7 30.7 ***3.9 42.5 ***6.1 31.8 ***4.0
Restrictions on doll -6.01 ***4.1 -6.34 ***4.4 -4.97 ***3.4 -4.99 ***3.5 -5.11 ***3.2 -4.72 ***3.4
Min. var. portfolio 26.2 **2.3 25.6 **2.1 20.4 *1.7 21.5 *1.8 21.4 *1.7 18.5 1.5
Inflation (log) 3.86 **2.2 2.93 1.3 3.63 1.6 3.85 *1.7 5.36 **2.1 4.52 *1.9 Institutions -3.19 0.8 -0.11 0.6 -0.15 0.0 -4.17 1.0 2.19 0.5 Transition 16.0 ***3.0 16.3 ***3.0 12.7 0.0 11.3 **2.1 1.83 0.3 14.8 ***2.7 Institutions x Transn -8.91 *1.9 -6.67 1.3 -13.7 *1.9 Legal protections 12.3 **2.4 11.7 **2.3 16.5 **2.2 15.8 **2.5 16.8 ***2.7 Inflat Targeting -10.8 *1.9 -9.42 1.5 -9.54 ***2.7 -8.02 1.0 -8.32 1.0 GDP-hedge -2.61 1.2 -4.58 0.9 -7.09 1.4 -4.46 0.9 GDP-hdg x Transn 7.89 0.8 13.8 1.6 7.44 0.9 R-squared / NOBS 0.490 74 0.494 74 0.504 59 0.510 59 0.426 60 0.529 59 Adjusted R-squared 0.436 0.432 0.425 0.420 0.349 0.431 S.E. of regression 17.5 17.6 17.0 17.0 17.9 16.9 Log likelihood -312.6 -312.3 -245.9 -245.5 -253.9 -261.0
Equation: 1.1 1.2 1.3 1.4 1.5 1.6
Variable Coeff. t-Stat Coeff. t-Stat Coeff. t-Stat Coeff. t-Stat Coeff. t-Stat Coeff. t-Stat
Constant 30.4 ***9.0 49.9 ***9.6 44.8 ***7.7 40.8 ***5.3 31.6 ***3.8 34.0 ***4.1
Restrictions on doll -5.77 ***3.3 -5.26 ***3.8 -6.47 ***4.0 -6.90 ***4.3 -5.98 ***3.8 -6.70 ***4.3
Min. var. portfolio 40.8 ***3.5 29.4 **2.5 29.2 **2.1 25.7 *1.8 26.8 **2.0 24.3 *1.8
Inflation (log) 7.96 ***4.4 4.98 **2.2 3.97 1.5 2.92 1.1 3.17 1.2 Institutions -8.14 **2.1 -9.23 **2.3 -8.38 **2.2 -6.16 1.5 Transition 8.26 1.4 15.0 **2.4 14.7 **2.5 Legal protections 11.2 **2.0 11.3 **2.1 Inflat Targeting -10.1 1.6 R-squared/NOBS 0.184 84 0.381 77 0.409 75 0.429 75 0.457 75 0.477 74 Adjusted R-squared 0.163 0.355 0.375 0.387 0.409 0.422 S.E. of regression 22.7 20.1 19.9 19.7 19.3 19.2 Log likelihood -380.0 -338.2 -328.0 -326.7 -324.8 -319.5 Equation: 1.7 1.8 1.9 1.10 1.11 1.12
Variable Coeff. t-Stat Coeff. t-Stat Coeff. t-Stat Coeff. t-Stat Coeff. t-Stat Coeff. t-Stat
Constant 36.4 ***4.6 34.2 ***4.1 35.7 ***4.0 36.5 ***4.1 48.5 ***6.1 38.0 ***4.3
Restrictions on doll -6.26 ***4.0 -6.72 ***4.3 -5.56 ***3.7 -5.57 ***3.7 -5.83 ***3.4 -5.21 ***3.5
Min. var. portfolio 25.2 **2.0 24.3 *1.9 18.2 1.4 19.0 1.4 19.6 1.4 14.8 1.2
Inflation (log) 4.76 **2.1 3.48 1.4 3.88 1.4 4.03 1.5 5.64 *1.9 4.95 *1.8 Institutions -4.40 1.0 -1.82 0.4 -1.84 0.4 -6.04 1.4 1.37 0.3 Transition 14.8 **2.5 15.2 **2.5 11.9 **2.0 10.9 *1.9 1.16 0.2 15.8 ***3.0 Institutions x Transn -11.5 **2.2 -8.41 1.4 -18.8 ***3.0 Legal protections 12.8 **2.3 12.0 **2.2 16.7 **2.5 16.2 **2.3 17.6 **2.5 Inflat Targeting -12.1 **2.0 -10.2 1.6 -10.7 1.3 -9.73 1.1 10.1 1.2 GDP-hedge -3.33 0.7 -7.64 1.3 -4.49 0.8 GDP-hdg x Transn 12.44 1.3 4.69 0.5 R-squared / NOBS 0.478 74 0.485 74 0.492 59 0.494 59 0.423 60 0.524 59 Adjusted R-squared 0.422 0.422 0.411 0.401 0.345 0.425 S.E. of regression 19.2 19.2 18.8 19.0 19.7 18.6 Log likelihood -319.5 -318.9 -251.9 -251.8 -259.6 -250.0
Inclusion of the inflation rate (in log form) substantially improves the fit of the simplest regressions (regression 1.2). The estimated coefficient implies that a doubling of inflation increases dollarization by about 5 percentage points. Yet, it loses significance as structural and institutional proxies for credibility effects are added in, suggesting both that credibility effects are important and that credibility (and inflation) have important structural and
institutional underlying determinants. In particular, regression 1.3 shows that the unweighted normalized mean of the six institutional quality variables of KKZ has the predicted sign. An improvement of one standard deviation in institutional quality lowers fitted dollarization by almost 10 percentage points. To the extent countries with weaker institutions are more likely to engage in government bail outs, the significance of institutional variables can be viewed as providing indirect support to the moral hazard interpretation of dollarization. All in all, this equation states that almost half of the cross-country variation in dollarization rates is explained by country differences in institutional quality, regulatory frameworks, and the macroeconomic environment. Inclusion of other variables, including the transition and inflation targeting dummies, and the GDP hedge variable, finds correct signs and marginally significant individual coefficients, but without much significant improvement in the overall fit of the equation.23
As noted, the increase in dollarization experienced by many countries appears puzzling when viewed exclusively in light of the dynamics of inflation. While the relatively short time span of our sample limits the scope for a full-fledged intertemporal analysis (further work is clearly needed to fully explore dollarization dynamics) a simple regression of dollarization dynamics, measured as the difference between 2001 dollarization and average dollarization, yields interesting and plausible results (Table 3). In particular, increases in observed
dollarization are partly explained by increases in warranted dollarization. In view of the declining inflation, this seems to be consistent with a "fear of floating" interpretation, i.e., warranted dollarization rose because the volatility of the exchange rate fell even more than that of inflation. Increases in trade are also significant, suggesting that globalization may partly be responsible for the general upward trend in dollarization (albeit not the cross-country differences). Finally, dollarization trends appear to have been affected by the level (not the rate of change) of institutional quality and regulatory restrictions, suggesting the existence of complex dynamic interactions.
Table 3. Changes in Dollarization
Dependent Adj. Countries
Variable Constant RESTR INST DTO DMVP R2 R2
DDOLL **4.28 **-1.78 **-3.95 **0.16 **4.75 0.24 0.19 62
t-stat (3.37) (-2.25) (-3.05) (2.12) (2.51)
Notes: DDOLL is the difference between 2001 dollarization and average dollarization, RESTR is the indicator of restrictions on dollarization, INST is the unweighted index of KKZ institutional quality indicators, DTO is the change in an indicator of trade openness, and DMVP is the change in the minimum variance portfolio measures between 1995 and 2001. ** and * indicate significance at the 5% and 10% levels, respectively.
23 Note that because of varying availability of data, the sample size varies, depending on the additional explanatory variables included, complicating the comparison of fit. Nevertheless, regression 1.6, including the transition and inflation targeting dummies and the legal protections variable is preferred to any of the others
1.3 to 1.8 by a log-likelihood ratio test at the 95 per cent level. At the stricter 99 per cent level, the inclusion of further variables beyond the three in regression 1.3 would not be justified.
IV. HAS DOLLARIZATION PROMOTED FINANCIAL DEVELOPMENT?
No study has so far attempted to assess directly the impact of dollarization on financial deepening.2 4 Intuitively, it seems that allowing dollarization should help keep more of financial intermediation onshore, by offering depositors an inflationary hedge. After all, the empirical evidence that inflation damages financial sector development is quite convincing.25 Generally speaking, it may be taken as a rough rule of thumb that monetary depth increases by about 3 percentage points for every $1,000 increase in GDP per capita and by about a quarter of a percentage point every year, but falls by about half a percentage point for every percentage point rise in the medium-term inflation rate (World Bank, 2001).
In particular, a recent study by Boyd, Levine, and Smith (2001) looks closely at the cross-country long-term determinants of financial depth and other measures of financial sector development focusing on the role of inflation. In addition to inflation, they include as controls the level of GDP per capita, the level of schooling (to measure overall economic development), a count of the number of revolutions and coups (to measure political stability), the black market premium on foreign exchange (an indicator of price distortions), and the ratio of central government expenditure to GDP.26 Despite the inclusion of these control variables (not all of which prove to be significant), the average inflation rate in 1960-95 is found to be strongly negatively correlated with the average level of financial depth over the same period.27
More direct evidence on the impact of dollarization on financial development carr be inferred from the negative experience of countries that have undertaken a forced conversion of dollar deposits into local currency, including Mexico and Bolivia in 1982 and Peru in 1985. As documented in Savastano (1996) and Balifio et al. (1999), the highlight of these experiences was a brutal contraction of onshore domestic intermediation. In Bolivia and Peru,
intermediation only recovered once dollar deposits were reallowed.2 8 Similar evidence can be derived from the experience of some countries that have repressed the use of the dollar and have not actively developed alternative indexation mechanisms (such as Ecuador, Guatemala, and Costa Rica). Faced with the regulatory and supervisory distortions resulting from the very rapid growth of offshore banking intermediation, most of these countries were led eventually to liberalize their regulations on foreign exchange deposits.
24 Honohan and Shi (2003) did examine the effects on interest rate spreads and on the ratio of local loans to
deposits.
25 While inflation volatility should also be included in an analysis of financial deepening, the level and variance
of inflation tend to be highly correlated in practice, whether on a cross-country or time series basis, which makes it quite difficult to disentangle their relative importance.
26 They do not include measures of legal rights and accounting quality, found to be very important determinants
of financial depth in Beck, Loayza and Levine (2000), though that paper does not include inflation among the explanatory variables. See also Bordo and Jonung (1993).
27 Similar evidence for the bond market is reported by Burger and Wamock (2003) who find that the level and volatility of inflation play an important role in explaining the development of local currency bond markets.
28 In Mexico, banking intermediation recovered during 1988-94 as the exchange rate anchor and steady
appreciation increased the attractiveness of peso instruments. However, the recovery proved to be ultimately unsustainable and the tequila crisis was followed by a prolonged period of renewed stagnation.
An econometric assessment of the impact of dollarization on financial development requires attention to endogeneity, as many of the factors influential for monetary depth are also among the determinants of dollarization.2 9 Indeed, coexistence of financial shallowness and dollarization could be reflections of the same macroeconomic events rather than being causally linked. In this context, it is not very surprising that adding dollarization to log inflation in a simple cross-sectional least squares regression of financial depth, measured as share of M2 to GDP, yields a negative coefficient (Regression 2.1 in Table 4)3° (Regression 2.9).
For high inflation countries, however, more dollarization is associated with deeper financial systems. An interaction term between dollarization and inflation has a strongly significant positive coefficient (equation 2.2), implying that dollarization has the effect of moderating the adverse effect of inflation on financial depth, exactly what theory predicts.3 It is
important to note that this effect is robust to estimation by two-stage least squares where the actual level of dollarization is substituted by its predicted value using institutional and other instruments (including the administrative restrictions on dollarization) (equation 2.3).32
GMM estimation also confirms the effect (equations 2.7 and 2.8). Including the level of dollarization as well as the interaction term gives similar results (equations 2.10-2.15).33
Thus even though dollarization may have little impact on monetary depth where risk factors summarized by inflation are low, our regression results show that, where inflation is high, dollarization allows an economy to retain more monetary depth than it otherwise would.
29 While we limit our testing to quantitative rather than "qualitative" measures, dollarization may also contribute to improve the depth and quality of financial intermediation. In particular, the average maturity of dollar loan contracts is generally longer than that of local currency contracts. At the same time, bank spreads on dollar intermediation are generally narrower than those on local currency intermediation (see Barajas and Morales, 2003). Formal testing of such effects is hampered by the limited data availability and the need to sort out endogenous market segmentation effects associated with currency denomination.
30 Somewhat surprisingly, though, the same result is obtained by an instrumental variable method that includes as instruments the main underlying determinants of dollarization (regulatory, macroeconomic or institutional). 3 1The threshold level of yearly inflation beyond which dollarization deepens financial intermediation is in the 20-30 percent range.
32 The level of income per capita-a standard variable in such a context, is also significant (equation 2.5),
though collinear when included along with institutional quality variables which are also significant when included separately (equation 2.4). The outliers Hong Kong SAR and Lebanon are excluded in these regressions; if they are included, the main effect is preserved as long as a dummy for offshore centers is included (equation 2.6). The results shown for the average sample period dollarization are confirmed when this is replaced by the actual or computed period end dollarization (not reported).
33 Although the sign of the dollarization term is positive and significant in the GMM estimate, the overall effect of an increase in dollarization on financial depth continues to be negative for low levels of inflation as the interaction term (which is negative due to a negative log of inflation) dominates the dollarization term.
Equation: 2.1 2.2 2.3 2.4 2.5 2.6 2.7 2.8
Variable Coeff. t-Statistic Coeff. t-Statistic Coeff. t-Statistic Coeff. t-Statistic Coeff. t-Statistic Coeff. t-Statistic Coeff. t-Statistic Coeff. t-Statistic
Constant 0.335 ***4.9 0.234 ***5.6 0.243 ***5.1 0.286 ***5.6 0.141 **2.2 0.137 1.5 0.301 ***9.4 0.133 ***3.8
Doll -0.280 **2.5
Doll x Log (inflat) 0.144 ***3.7 0.174 ***2.9 0.175 ***3.0 0.162 ***3.3 0.212 ***2.7 0.132 ***3.2 0.167 ***6.0
Log (Inflation) -0.075 ***4.1 -0.116 ***7.1 -0.117 ***4.5 -0.101 ***3.8 -0.129 ***4.7 -0.156 ***4.0 -0.054 **2.3 -0.106 ***5.4
Government 0.082 **2.0 0.108 ***3.9
GNP/cap 0.233 ***2.9 0.141 1.1 0.258 ***6.7
Offshore center? 0.786 ***4.7
Instruments A B B A B
Countries and areas HKG,LBN HKG,LBN HKG,LBN HKG,LBN HKG,LBN HKG,LBN HKG,LBN HKG,LBN
omitted
R-squared/NOBS 0.387 69 0.444 69 0.315 47 0.372 47 0.477 42 0.474 43 0.262 47 0.428 42
Adjusted R-squared 0.368 0.427 0.283 0.328 0.436 0.419 0.211 0.383
S.E. of regression 0.194 0.185 0.164 0.159 0.148 0.208 0.173 0.154
Log likelihood/Method 16.8 OLS 20.2 OLS 2SLS 2SLS 2SLS 2SLS GMM GMM
Equation: 2.9 2.10 2.11 2.12 2.13 2.14 2.15
Variable Coeff. t-Statistic Coeff. t-Statistic Coeff. t-Statistic Coeff. t-Statistic Coeff. t-Statistic Coeff. t-Statistic Coeff. t-Statistic
Constant 0.373 ***43 0.166 *1.9 0.088 0.6 0.146 1.0 -0.067 0.5 0.045 0.2 -0.060 1.1
Doll -0.296 *2.0 0.167 0.9 0.345 1.1 0.309 1.1 0.467 *1.7 0.424 1.0 0.516 ***42
Doll x Log (inflat) 0.195 ***2.7 0.301 **2.4 0.288 **2.4 0.346 ***3.0 0.366 **2.1 0.328 ***5.4 tk
Log (nflation) -0.051 **2.1 -0.135 ***4.8 -0.173 ***3.1 -0.152 ***2.8 -0.204 ***3.8 -0.226 ***2.9 -0.179 ***5.3 Government 0.079 *1.9 GNP/cap 0.227 ***2.9 0.126 1.1 0.246 ***6.3 Offshore center? 0.753 ***4.3 Instruments A B B B Countries omitted HKG, LBN HKGLBN HKG, LBN HKG, LBN HKG, LBN HKG, LBN R-squared/NOBS 0.230 47 0.450 69 0.349 47 0.403 47 0.511 42 0.477 43 0.517 42 Adjusted R-squared 0.195 0.425 0.304 0.346 0.458 0.407 0.465 S.E. of regression 0.175 0.185 0.162 0.157 0.145 0.210 0.144
Log likelihood/Method 2SLS 20.6 OLS 2SLS 2SLS 2SLS 2SLS GMM
Notes: Dependent variable: M2/GDP.
Instruments: Set A= Institutions, Polstab, Regqual, Voice, Corrupt, Legorigf, Trans, log(Inflation), Maxerate, Offcenter, Offshoredeps, Restrict(i), Min. Var. Portfolio; Set B=Set A + Gnppcppp. Note that instruments are not available for all countries.
Note: Doll x inflat means: Dollarization average x log (inflation) (coeff is multiplied by 100).
V. ARE DOLLARIZED FINANCIAL SYSTEMS INHERENTLY FRAGILE?
Financially dollarized systems have been conspicuous among recent high-profile financial crises. The Mexican 1982 "mex-dollar" crisis was an early illustration of such events.34 There were a number of similar more recent episodes, particularly in Asia, Southern America, and Eastern Europe. The 2002 Argentina financial crisis and its ripple effects on its highly dollarized neighbors brought home the realization that domestic dollarization can greatly increase the fragility of financial systems.
Dollarized financial systems are exposed to both solvency and liquidity risks. As regards solvency, the main risk results from currency mismatches in the event of large
depreciations. Currency mismatches can affect banks' balance sheet directly, or indirectly by undermining the quality of their dollar loan portfolio. In view of the tight regulatory limits generally applied to banks' open foreign exchange positions, it is mainly through its indirect effect on credit risk that use of dollars generates vulnerability.35 Banks with large domestic dollar liabilities must balance their foreign exchange positions by either extending dollar lending to local currency earners or holding dollar assets abroad. To maintain their profitability and satisfy the pent-up demand for loans, they end up on-lending domestically a large share of their dollar deposits (Honohan and Shi, 2003), effectively transferring the currency risk to their unhedged clients and retaining the resulting credit risk.
The scope for currency mismatch is exacerbated by the wedge between financial and real dollarization. When most prices and wages continue to be set in local currency while financial dollarization is widespread, real and financial transactions are effectively made in different currencies. Thus, large depreciations can have catastrophic effects. Nor is this wedge limited to the private sector. A similar wedge may affect governments whose tax revenue is in local currency but that borrow in foreign currency to limit short-run debt-servicing costs or signal their commitment to a stable exchange rate. When the domestic banking system holds large claims against the government, public sector insolvency can thus immediately lead to banking insolvency. Moreover, as stressed in the balance sheet literature, currency mismatches in the event of large depreciations have broad macro-systemic ripple effects, particularly in terms of output losses, that compound the deterioration of banks' financial situation.
Systemic risk can also lead to the emergence of a risk premium on dollar deposits in local banks, to the extent that depositors fear that the banks may not be able to provide external dollar liquidity on demand in the event of a currency crisis. It is as if "local dollars," in the form of deposits at local banks, are a different currency to U.S. dollar deposits held offshore in the United States or a credible financial center. Yet, in the case of a drop in confidence
34 The Mexican 1982 crisis was triggered by an apparent loss of macroeconomic control, with a rapidly
expanding fiscal deficit and public debt, and weak and confusing monetary and exchange rate management. The large claims of commercial banks on the government introduced a direct channel of transmission from fiscal insolvency to bank insolvency. A very similar sequence of events took place in Argentina during the more recent crisis.
35 However, as documented by Garber (1996) in the case of Mexico, regulatory limits on banks' open positions are not always effective, however, as banks' positions in derivatives may be misreported.