TEXTURE DURING THERMO-MECHANICAL PROCESSING BY WARM-ROLLING IN A DUPLEX STAINLESS STEEL
Mohammed Zaid Ahmed
A Dissertation Submitted to
Indian Institute of Technology Hyderabad
In Partial Fulfillment of the Requirements for the Degree of Doctor of Philosophy
Department of Materials Science and Metallurgical Engineering
under my supervision and that it has not been submitted elsewhere for the award of any degree or diploma.
Dr. Pinaki Prasad Bhattacharjee Department of Materials Science and Metallurgical Engineering Indian Institute of Technology
Hyderabad 502205 INDIA
I declare that this written submission represents my ideas in my own words, and where others’ ideas or words have been included, I have adequately cited and referenced the original sources. I also declare that I have adhered to all principles of academic honesty and integrity and have not misrepresented or fabricated or falsified any idea/data/fact/source in my submission. I understand that any violation of the above will be a cause for disciplinary action by the Institute and can also evoke penal action from the sources that have thus not been properly cited, or from whom proper permission has not been taken when needed.
_________________________ (Mohammed Zaid Ahmed) (MS11P008)
Examiner _______________________ -Name and affiliation- Examiner _______________________ -Name and affiliation- Adviser _______________________ -Name and affiliation- Co-Adviser _______________________ -Name and affiliation- Chairman
It is hard for me to express my feelings in words here, even though I try my best to do that.
I am thankful to Almighty Allah who has shown me the right path, guided and helped me to achieve whatever in my life. It also gives me an immense pleasure to start with my family here. I gratefully acknowledge the great support of every member of my family when I finally decided to pursue research career. Their unconditional support and motivation throughout this journey helped me in completing my PhD work successfully.
I express my deepest gratitude to my supervisor Dr. Pinaki Prasad Bhattacharjee for constantly providing me motivation and suggestions throughout my PhD work. I would like to thank him for helping me developing self-learning ability and for the excellent scientific discussions which helped me in understanding the intricacies of the research topic that I have pursued. Apart from this, I would also like to express my sincere thanks to him in understanding my strength and weakness. His great patience helped me to overcome many of the difficulties that I have encountered during this work.
I would like to thank Dr. Malakondaiah (former director of DMRL, Hyderabad), Dr. T. Raghu (Scientist “G’) and Mr. S.S.Satheesh (Scientist ‘D’) for providing the starting material used in this research work.
I would also like to thank Prof. Peter Hodgson (Director, Institute for Frontier Materials, Deakin University Australia) for kindly hosting me at Deakin University. This greatly helped me in improving my understanding of many aspects of steels research.
Thanks to all the faculty members of Material Science and Metallurgical Engineering (MSME) Department who has helped and supported me by
course of this research work.
I would like to express my thanks to all non-teaching staffs who have helped me in establishing the lab and also in conducting the day to day research work without which I would have succeeded in this research work. Thanks to all.
List of Figures Vl
List of Tables XVll
List of Abbreviations XVll
Synopsis XlX
Chapter 1 Introduction 1
Chapter 2 Literature Review 4
2.1 Duplex Materials 5
2.2 Evolution of Texture During Deformation and Recrystallization of Single phase FCC
materials 12
2.2.1 Representation of Texture 12
2.2.2 Deformation Texture of FCC Materials 20 2.2.3 Annealing Texture of FCC Materials 22 2.3 Deformation and Annealing Texture of Single
Phase BCC Materials 28
2.3.1 Deformation Texture of BCC Materials 28 2.3.2 Annealing Texture of BCC Materials 30 2.4 Evolution of Microstructure and Texture in DSS 34
During Deformation and Annealing of DSS
2.4.1 Evolution of Microstructure and Texture 34 During Deformation
2.4.2 Evolution of Microstructure and Texture
During Annealing 39
2.5 Objectives and Scope of the Present Work 43
Chapter 3 Experimental 46
3.1 Alloy Preparation 46
3.2 Preparation of Starting Material for Deformation
Processing 46
EBSD 56 3.6.2 Experimental Details of EBSD Analysis 64
3.7 Mechanical Characterization 65
Chapter4 Effect of Processing Temperature on Microstructure And Texture During Warm Rolling And Recrystallization 67
4.1 Microstructure and Texture of the Homogenized
Starting Material 68
4.2 Evolution of Microstructure and Texture During
Warm-Rolling at 498K (225°C) 72
4.2.1 Evolution of Microstructure 72
4.2.2 Evolution of Texture 77
4.3 Evolution of Microstructure and Texture During
Warm-Rolling at 698K (425°C) 82
4.3.1 Evolution of Microstructure 82
4.3.2 Evolution of Texture 87
4.4 Evolution of Microstructure and Texture During
Warm-Rolling at 898K (625°C) 91
4.4.1 Evolution of Microstructure 91
4.4.2 Evolution of Texture 94
4.5 Evolution of Microstructure and Texture During
4.6 Evolution of Microstructure and Texture During Annealing of 90% Warm-Rolled DSS at
498K (225°C) 100
4.6.1 Evolution of Microstructure During
Annealing 100
4.6.2 Evolution of Texture During
Annealing 102
4.7 Evolution of Microstructure and Texture During Annealing of 90% Warm-Rolled DSS at
698K (425°C) 109
4.7.1 Evolution of Microstructure During
Annealing 109
4.7.2 Evolution of Texture During
Annealing 114
4.8 Evolution of Microstructure and Texture During Annealing of 90% Warm-Rolled DSS at 898K
(625°C) 114
4.8.1 Evolution of Microstructure During
Annealing 121
4.8.2 Evolution of Texture During
Annealing 125
4.9 Discussion 125
4.9.1 Evolution of Microstructure and Texture
During Warm-Rolling 132
4.9.2 Evolution of Microstructure and Texture
During Isothermal Annealing 142
Chapter 5 Effect of Severe Deformation on the Microstructure And Texture During Warm-Rolling and
5.3.1 Evolution of Microstructure During
Annealing 163
5.3.2 Evolution of Texture During
Annealing 171
5.4 Evolution of Mechanical Properties During Warm-
Rolling and Isothermal Annealing 181
5.5 Discussion 183
5.5.1 Evolution of Microstructure and Texture During Severe Warm-Rolling 183 5.5.2 Evolution of Microstructure and Texture
During Annealing 191
5.6 Evolution of Mechanical Properties during Severe
Warm-Rolling and Annealing 194
Chapter 6 Effect of Change in Strain Path on the Microstructure and Texture During
Warm-Rolling and Recrystallization 196
6.1 Cross Warm-Rolling (CWR) 197
6.2 Evolution of Microstructure and Texture During Cross Warm-Rolling (CWR) of Duplex Stainless
Steel 198
6.2.1 Evolution of Microstructure 198
6.3.1 Evolution of Microstructure During
Annealing 206
6.3.2 Evolution of Texture During
Annealing 210
6.4 Discussion 219
6.4.1 Texture Evolution During Processing
By CWR 219
6.4.2 Texture Evolution During
Annealing 223
Chapter 7 Summary and Conclusions 227
angles α and β [9]. 13 2.4 Representation of the {100} poles of a cubic crystal in the stereographic projection. (a) Crystal in the unit sphere; (b) projection of the {100} poles onto the equator plane; (c) {100} pole figure and definition of the pole figure angles α and β for the
(100) pole [9]. 15
2.5 Schematic illustration of (a) reference system and (b) Euler
angles [10]. 16
2.6 Schematic representation of the three dimensional Euler
space[11]. 17
2.7 Three dimensional view of Euler space with locations of some important ideal orientations and fibres of FCC metals [16]. 19 2.8 Ideal orientations of FCC materials shown in the φ2 sections of
Euler space [16]. 19
2.9 (111) pole figure of 95% cold rolled (a) copper and (b)
Aluminium [7]. 21
2.10: ODF of 90% cold rolled aluminium with positions of
deformation texture components indicated [7]. 21
2.13 Schematic illustration of ((a,b)) continuous and ((c,d))
discontinuous annealing processes [7]. 25
2.14 Three dimensional view of Euler space with locations of some important ideal orientations and fibers of BCC metals [43]. 29 2.15 Typical φ2= 45° section of ODF of BCC materials showing
the locations of individual texture components along the two
fibers [9]. 29
2.16 φ2 = 45° sections of ODFs of ELC IF steel after cold reductions
of (a) 70% and (b) 85% [43]. 31
2.17 (a) φ2 = 45° section of the ODF of 90% cold-rolled Ti+Nb
microalloyed interstitial-free steel, (b) φ2 = 45° section of ODF of
90% cold rolled and annealed (1hr at 700°C) Ti-alloyed
interstitial-free steel [9]. 33
2.18 ODFs of (a) austenite and (b) ferrite in hot-rolled DSS [65].36
2.19 The formation of banded morphology in DSS cold-rolled to (a) 60% and (b) 90% reduction in thickness [69]. 36
2.20 Schematic of the microstructural arrangement in cold-rolled
DSS (rolling direction horizontal) [69]. 38
2.21 (a) φ2 = 45° section of ODF of ferrite phase and (b) ODF of
austenite phase in 90% cold-rolled DSS [69]. 38
2.22 (a) φ2 = 45° section of ODF of ferrite and (b) ODF of austenite
in DSS cold-rolled to 90% reduction in thickness and annealed for
2000s at 1100°C [69]. 42
-: Chapter 3:-
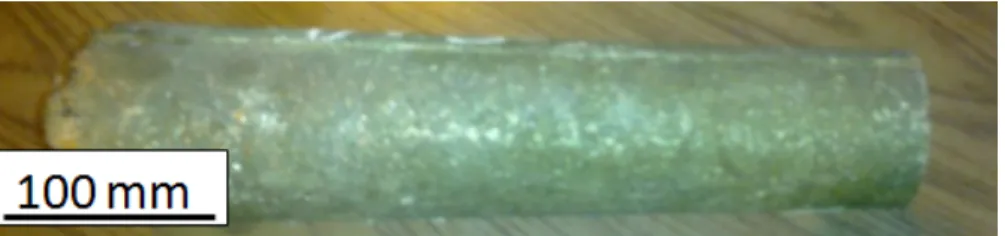
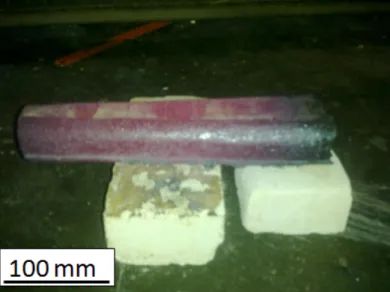
3.1 As cast ingot of DSS used in the present research. 48
bands in the original space, (b) the bands in the transformed Hough
space [1]. 61
3.8 Schematic representation of the geometry of (a) diffraction and
(b) EBSD [2]. 62
3.9 Schematic of the tensile test specimens. All dimensions shown
are in mm. 66
-: Chapter 4:-
4.1 Phase map showing the distribution of ferrite and austenite in the homogenized DSS used as the starting material for subsequent
warm-rolling. 70
4.2 φ2 = 45° section of the ODF of ferrite in starting homogenized
DSS. The ideal locations of the texture components are shown in
the ODF section. 71
4.3 (a) shows the (111) PF of austenite in homogenized DSS, (b) shows the ideal locations of individual texture components in (111) PF. (c) shows the φ2 = 0°, 45° and 65° sections of the ODF of
austenite in homogenized DSS along with the ideal locations of
individual texture components. 73
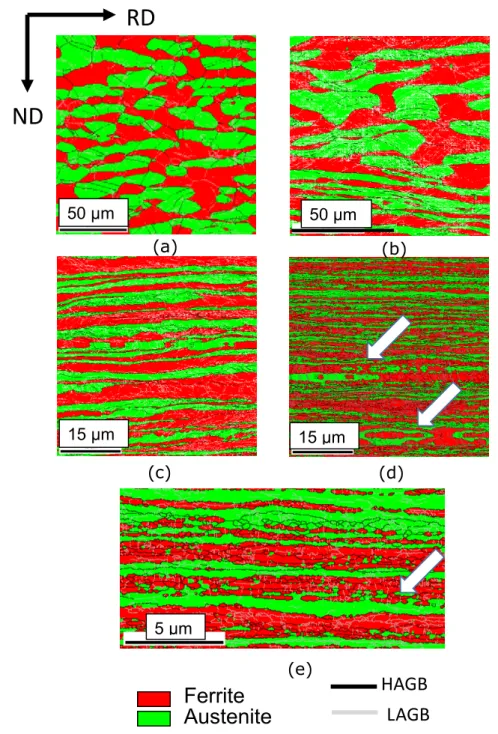
4.4 Phase maps of the DSS warm-rolled at 498K (225°C) to (a) 20%, (b) 40%, (c) 70% and (d) 90% reduction in thickness. (e) shows a region of interest cropped from the phase map of 90%
4.5 Schematic diagram showing (a) misorientation between a grain at the center and all other points at the perimeter of the kernel and (b) misorientation between a grain at the center and all points in
the kernel [1]. 78
4.6 (a) shows the φ2=45° section of the ODF and (b) shows the
orientation map of ferrite (austenite regions are masked) in DSS warm-rolled to 90% reduction in thickness at 498K (225°C). 79 4.7 (a) shows the (111) PF, (b) shows the φ2 = 0°, 45° and 65°
sections of the ODF and (c) shows the orientation map of austenite (ferrite regions are masked) in DSS 90% warm-rolled at 498K
(225°C). 81
4.8 Phase maps of DSS warm-rolled at 698K (425°C) to (a) 20%, (b) 40%, (c) 70% and (d) 90% reduction in thickness. (e) shows a region of interest cropped from the map shown in (d). 83 4.9 (a) shows the phase map obtained from another region of interest in DSS 90% warm-rolled to 90% reduction in thickness at 698K (425°C). (b) shows the φ2 = 45° section of ODF and (c)
shows the orientation map of ferrite (austenite regions are
masked). 85
4.10 (a) shows the φ2=45° section of the ODF and (b) shows the
orientation map of ferrite (austenite regions are masked) in DSS warm-rolled to 90% reduction in thickness at 698K (425°C). 88 4.11 (a) shows the (111) PF, (b) shows the φ2 = 0°, 45° and 65°
sections of the ODF and (c) shows the orientation map of austenite (ferrite regions are masked) in DSS warm-rolled to 90% reduction
in thickness at 698K (425°C). 90
4.12 Phase maps of DSS warm-rolled at 898K (625°C) to (a) 20%, (b) 40%, (c) 70% and (d) 90% reduction in thickness. (e) shows a region of interest cropped from the phase map of 90% warm-rolled
specimens. 101 4.16 Evolution of (a) ferrite fraction, (b) grain thickness (measured along the ND) and (c) aspect ratio of the two phases in isothermally
annealed A series DSS specimens. 103
4.17 φ2=45° section of the ODF of ferrite in isothermally annealed
(a) A2, (b) A20, (c) A30, (d) A120 DSS specimens. 104 4.18 Variation of RD and ND-fiber fractions in ferrite in isothermally
annealed A series DSS specimens. 106
4.19 (111) PF of austenite in isothermally annealed (a) A2, (b)
A20, (c) A30, (d) A120 DSS specimens. 107
4.20 φ2 = 0°, 45°, 65° sections of the ODFs of austenite in
isothermally annealed (a) A2, (b) A20, (c) A30, (d) A120 DSS
specimens. 108
4.21 Evolution of texture components in austenite in isothermally
annealed A series DSS specimens. 110
4.22 Phase maps of the (a) B2, (b) B20, (c) B30,(d) B120 DSS
specimens. 111
4.23 Variation of (a) ferrite fraction, (b) grain thickness (measured along the ND) and (c) aspect ratio of the two phases in isothermally
annealed B series DSS specimens. 113
4.24 φ2=45° section of the ODF of ferrite in (a) B2, (b) B20, (c)
4.26 (111) PFs of austenite in isothermally annealed (a) B0, (b) B2,
(c) B20, (d) B30, (e) B120 specimens. 118
4.27 φ2 = 0°, 45°, 65° sections of the ODFs of austenite in
isothermally annealed (a) B2, (b) B20, (c) B30, (d) B120
specimens. 119
4.28 Evolution of texture components during isothermal annealing in austenite in B series DSS specimens. C(T) and GT are twin
components of C and G, respectively. 120
4.29 Phase maps of isothermally annealed (a) C2, (b) C20, (c) C30
and (d) C120 specimens. 122
4.30 Variation of (a) ferrite fraction, (b) grain thickness (measured along the ND) and (c) aspect ratio of the two phases in isothermally
annealed C series DSS specimens. 124
4.31 φ2=45° section of the ODF of ferrite in (a) C2, (b) C20, (c)
C30, (d) C120 DSS specimens. 126
4.32 Variation of RD and ND-fiber fractions in ferrite in isothermally
annealed C series DSS specimens. 127
4.33 (111) PF of austenite in 90% warm-rolled and isothermally annealed (a) C2, (b) C20, (c) C30, (d) C120 DSS specimens. 129 4.34 φ2 = 0°, 45°, 65° ODF sections of austenite in (a) C2, (b)
C20, (c) C30, (d) C120 DSS specimens. 130
4.35 Evolution of texture components during isothermal annealing
in austenite in C series DSS specimens. 131
4.36 (a) shows austenite fraction, (b) shows thickness of the phase bands, (c) and (d) show HAGB fraction and HAGB spacing of the two phases, respectively after 90% warm-rolling at different temperatures. (e) shows area fraction having KAM≤1 in the two phases in DSS 90% warm- rolled at different temperatures. The abbreviation WR is used for “Warm-Rolling” for convenience. 133 4.37 Volume percentages of different texture components in
4.42 (a) and (b) show the phase maps of DSS warm-rolled to 90% reduction in thickness at 698K (425°C) and 898K (625°C) (i.e. B0 and C0 specimens), respectively. (c) shows the point to origin misorientation along the arrows inside ferrite bands in specimens B0
and C0 shown in (a) and (b), respectively. 145
-: Chapter
5:-5.1 Phase maps of DSS warm-rolled to ((a),(b)) 95% and ((c),(d)) 98% reduction in thickness at ((a),(c)) 498K (225°C) and ((b),(d))
698K (425°C). 152
5.2 Variation of austenite fraction in DSS during warm-rolling at
different temperatures. 153
5.3 Phase maps of DSS warm-rolled at 898K (625°C) to (a) 70%, (b) 90%, (c) 95% and (d) 98% reduction in thickness. 155 5.4 Variation of HAGB spacing along ND in the two phases of DSS warm-rolled to different reduction in thickness at 898K (625°C).156 5.5 φ2 = 45° section of ODF of ferrite in DSS warm-rolled at 898K
(625°C) to (a) 70%, (b) 90%, (c) 95%, (d) 98% reduction in
thickness. 158
5.6 Volume fractions of RD and ND-fibers in ferrite in DSS warm-rolled at 898K (625°C) to different reduction in thickness. SM is
5.7 (111) PFs of austenite in DSS warm-rolled at 898K (625°C) to (a) 70%, (b) 90%, (c) 95%, (d) 98% reduction in thickness. 161 5.8 φ2=0°, 45°, 65° sections of the ODFs of austenite in DSS warm-rolled at 898K (625°C) to (a) 70%, (b) 90%, (c) 95% and (d)
98% reduction in thickness. 162
5.9 Volume fraction of texture components in austenite in DSS warm-rolled to different reduction in thickness at 898K (625°C).164 5.10 Phase maps of 70% warm-rolled DSS after isothermal annealing 1448K (1175°C) for (a) 2, (b) 30 and (c) 120 minutes. 165 5.11 Phase maps of 95% warm-rolled DSS after isothermal annealing at 1448K (1175°C) for (a) 2, (b) 30 and (c) 120 minutes.
167 5.12 Phase maps of 98% warm-rolled DSS after isothermal annealing 1448K (1175°C) for (a) 2, (b) 30 and (c) 120 minutes.
168 5.13 Variation of HAGB spacing in (a) austenite and (b) ferrite in DSS warm-rolled to different reduction in thickness and isothermally annealed at 1448K (1175°C). (c) shows the aspect ratio of the two phases in DSS warm-rolled to different reduction in thickness and annealed at 1448K (1175°C) for 2 minutes DSS. 170 5.14 φ2 = 45° section of ODF of ferrite in DSS warm-rolled to ((a)-(d)) 70%, ((e)-(h)) 90% and ((i)-(l)) 95% and ((m)-(p)) 98% reduction in thickness and isothermally annealed at 1498K (1175°C)
for 2, 30, 60 and120 minutes. 172
5.15 Variation in the volume fraction of RD and ND-fibers in ferrite in (a) 70%, (b) 90%, (c) 95% and (d) 98% warm-rolled DSS during
isothermal annealing at 1448K (1175°C). 173
5.16 (111) PFs of austenite in DSS ((a)-(d)) 70%, ((e)-(h)) 90%, ((i)-(l)) 95% and ((m)-(p)) 98% warm-rolled and isothermally
5.19 φ2 = 0 °, 45° and 65 ° sections of ODFs of austenite in DSS 90% warm-rolled and then isothermally annealed at 1448K (1175°C) for (a) 2, (b) 30, (c) 60, and (d) 120 minutes. 178 5.20 φ2 = 0 °, 45° and 65 ° sections of ODFs of austenite in DSS 98% warm-rolled and then isothermally annealed at 1448K (1175°C) for (a) 2, (b) 30, (c) 60, and (d) 120 minutes. 179 5.21 Variation of individual texture components in austenite (a) 70%, (b) 90%, (c) 95% and (d) 98% warm-rolled DSS during
isothermal annealing at 1448K (1175°C). 180
5.22 Comparison of engineering stress-strain plots of severely
warm-rolled DSS. 182
5.23 Engineering stress-strain plots of 90% warm-rolled and
isothermally annealed DSS. 185
5.24 Engineering stress-strain plots of 95% warm-rolled and
isothermally annealed DSS. 186
5.25 Engineering stress-strain plots of 98% warm-rolled and
isothermally annealed DSS. 187
-: Chapter 6:-
6.1 Phase maps of homogenized DSS processed by CWR at 898K (625°C) to (a) 18%, (b) 33%, (c) 45%, (d) 55%, (e) 63%, (f) 70% (g) 75%, (h) 80%, (i) 84%, (j) 86% and (k) 90% reduction in
6.2 (a) shows the phase map, (b) and (c) show the GB maps of ferrite (austenite regions are masked) and austenite (ferrite regions are masked), respectively in the 90% CWR processed DSS, (d) shows the accumulated misorientation inside the ferrite bands along
the arrow marks shown in (b). 200
6.3 Variation of (a) phase fraction, (b) HAGB fraction and (c) HAGB
spacing in DSS during processing by CWR. 202
6.4 (a) shows the φ2 = 45° section and (b) shows the orientation
map of ferrite (austenite regions are masked) in 90% CWR
processed DSS. 204
6.5 (a) shows the (111) PF of austenite in 90% CWR processed DSS and (b) shows the ideal locations of the components in the (111) PF. (c) shows the φ2 = 0°, 45° and 65° sections and (d)
shows the orientation map of austenite (ferrite regions are masked)
in the 90% CWR processed DSS. 205
6.6 Phase maps of 90% CWR processed DSS isothermally annealed at 1448K (1175°C) for (a) 2 minutes, (b) 30 minutes, (c) 60
minutes and (d) 120 minutes. 207
6.7 Variation of (a) grain thickness along ND and (b) aspect ratio of the two phases in 90% CWR processed DSS during isothermal
annealing at 1448K (1175°C). 209
6.8 φ2 = 45° sections of ODFs of ferrite in 90% CWR processed
DSS isothermally annealed at 1448K (1175°C) for (a) 2 minutes, (b) 30 minutes, (c) 60 minutes and (d) 120 minutes. 211 6.9 Orientation maps of ferrite (austenite regions are masked) in 90% CWR processed DSS isothermally annealed at 1448K (1175°C) for (a) 2 minutes, (b) 30 minutes, (c) 60 minutes and (d) 120
minutes. 212
6.10 Variation of volume fraction of texture components in ferrite in 90% CWR processed DSS during isothermal annealing at 1448K
90% CWR processed DSS isothermally annealed at 1448K (1175°C) for (a) 2 minutes, (b) 30 minutes, (c) 60 minutes and (d) 120
minutes. 217
6.14 Variation of volume fraction of texture components in austenite in 90% CWR processed DSS during isothermal annealing.
Figure No
.
Title
Page No.
-: Chapter 2 :-
Table 2.1: Typical chemistry of DSS grades [3]. 8
Table 2.2: List of commercially available DSS grades with chemical
composition [5]. 9
-: Chapter 3 :-
Table 3.1: Chemical composition of the as-cast DSS used in the
present research. 47
-: Chapter 4 :-
Table 4.1: Distribution of alloying elements in the two constituent
phases in the starting homogenized DSS. 69
Table.4.2: Evolution of key microstructural parameters in ferrite and austenite in DSS during warm-rolling at 498K (225°C). 76 Table.4.3: Evolution of key microstructural parameters in ferrite and austenite in DSS during warm-rolling at 698K (425°C). 86 Table.4.4: Evolution of key microstructural parameters in ferrite and austenite in DSS during warm-rolling at 898K (625°C). 93 Table 4.5: Sample designation scheme used in the present work for different warm-rolled (90% reduction in thickness) and isothermally
annealed DSS specimens. 99
-: Chapter 5 :-
Table 5.1: Summary of the mechanical properties of warm rolled
FCC – Face Centred Cubic
FEG – Field Emission Gun
HAGB – High Angle Grain Boundary
HEA _ High Entropy Alloys
HPT - High Pressure Torsion
LAGB – Low Angle Grain Boundary
ND – Normal Direction
ODF – Orientation Distribution Function
PFs – Pole Figures
RD – Rolling Direction
SCC - Stress Corrosion Cracking
SEM – Scanning Electron Microscope
SFE – Stacking Fault Energy
TBs – Twin Boundaries
TD – Transverse Direction
TWIP – Twin Induced Plasticity
UTS – Ultimate Tensile Strength
UWR - Unidirectional Warm Rolling
XRD - X-Ray Diffraction
Thermo-mechanical processing of materials involving heavy deformation and annealing results in the development of characteristic microstructure and crystallographic texture which greatly affect their properties. As a result, the development of microstructure and texture during thermo-mechanical processing has been intensely investigated in a range of materials including single phase metals and alloys, two phase materials and intermetallic alloys. However, the development of microstructure and texture in duplex alloys where both the phases have polycrystalline grain structure, such as, (α+β) brass and (ferrite+austenite) duplex stainless steels (DSS) has received far less attention. Since these alloys constitute an important class of structural materials adequate understanding of microstructure and texture formation in these alloys will be key to enhance their properties for a wide range of applications.
The present work attempts to clarify the evolution of microstructure and texture in duplex alloys using DSS as a model system. In the present work warm-rolling (processing temperature is above room temperature, but below recrystallization temperature) is employed as the preferred thermo-mechanical processing route. Processing by warm-rolling is considered particularly important in the present research considering the fact that additional complexities due to deformation induced phase transformation can be avoided. It might be noted that previous investigations of microstructure and texture evolution in duplex alloys have pursued processing by either hot or cold-rolling. However, the effect of thermo-mechanical processing by warm-rolling has not been investigated so far. This constitutes a major novelty of the present work. The effect of three major processing
300mm (Length). The hot-forged slab is subsequently hot-rolled at 1398K (1125°C) to ~82.5% reduction in thickness to a thickness of 10.5mm. This is followed by homogenization annealing at 1448K (1175°C) for 7200 seconds (120 minutes) to achieve nearly equal volume fraction of austenite and ferrite in the microstructure. These homogenization annealed materials are used for further thermo-mechanical processing by warm-rolling to study the effect of different processing parameters as already stated before.
In order to study the effect of warm-rolling temperature the homogenization annealed material is warm-rolled to 90% reduction in thickness at three different temperatures, namely, 498K (225°C), 698K (425°C) and 898K (625°C). The 90% warm-rolled materials are subsequently annealed at 1448K (1175°C) for time intervals ranging from 120 seconds (2 minutes) to 7200 seconds (120 minutes).
Development of an ultrafine lamellar deformation structure having an alternate arrangement of the two phase bands is observed during warm-rolling. The individual phase bands are further subdivided by high angle grain boundaries (HAGBs defined by misorientation angle (θ)≥15°). However, in comparison to the two end temperatures of warm-rolling, the microstructure of the material warm-rolled at 698K (425°C) shows distinctly different
phase. The texture of ferrite is characterized by the presence of ND (ND//<111>) and RD (RD//<110>) fibers. However, as compared to ferrite in the DSS warm-rolled at 498K (225°C) and 898K (625°C), ferrite in the DSS warm-rolled at 698K (425°C) shows much stronger RD-fiber than ND-fiber. On the other hand, austenite shows the development of pure metal type (or copper type) deformation texture in different warm-rolled materials in contrast to the strong brass type texture in cold-rolled DSS. These observations indicate that the development of microstructure and texture is greatly influenced by the warm-rolling temperature.
The effect of warm-rolling temperature on the evolution of microstructure and texture could be explained based on the interaction of carbon atoms with dislocations (dynamic strain aging). At the warm-rolling temperature of 498K (225°C) the mobility of the carbon atoms may be insufficient to effectively lock dislocations. On the other hand, at the warm-rolling temperature of 898K (625°C) the mobility of the carbon atoms may be too high. At the intermediate temperature of 698K (425°C) the locking of dislocations by carbon atoms would be most effective. As a result the ferrite would be the harder phase showing evidently more mechanical fragmentation.
The microstructure evolution at different warm-rolling temperatures is amply corroborated by the pattern of texture evolution in ferrite in DSS. Slip on the {110}<111> system is preferentially retarded by the interaction of the carbon atoms with dislocations. The slip retardation is particularly effective on the {110} plane due to the greater number of available interstitial sites. As a result the {110} <111> system is more work-hardened and slip takes place preferentially on the {112} <111> system. The choice of slip systems leads to stronger RD-fiber as compared to the ND-fiber in ferrite in DSS warm-rolled at 498K (225°C) .
out only at the temperature of homogenization so that microstructure and texture evolution is not affected by phase transformation. Development of a lamellar bamboo type morphology with an alternate arrangement of bands of the two phases is observed in different warm-rolled DSS after isothermal annealing at 1448K (1175°C) for short duration. The interconnecting boundaries are mostly low angle grain boundaries (2°≤θ<15°) in case of ferrite. In contrast, the interconnecting boundaries were mostly HAGBs in austenite. The microstructural evolution indicates that the primary softening mechanism in ferrite is recovery whereas in austenite it is discontinuous recrystallization. The breakdown of the bamboo structure with the concurrent evolution of globular morphology is observed with increasing isothermal annealing time and evidenced by an increase in the aspect ratio. The mechanism of this transformation is explained on the basis of mutual interpenetration of the two phases along the triple points. The grain growth process is greatly restricted in the two phases of the annealed DSS, which is attributed to resistance to grain growth exerted by one phase on the other.
Ferrite in different isothermally annealed DSS shows retention of the two characteristic texture fibers consistent with the recovery behavior of ferrite. However, RD-fiber is found to be much stronger than ND-fiber. The development of stronger RD-fiber components is
the recrystallization type behavior of the ND-fiber components. Warm-rolling of DSS results in diminished driving force for recrystallization and results in the formation of much stronger RD-fiber.
Retention of deformation texture components is observed in austenite in different warm-rolled and isothermally annealed DSS. This indicates discontinuous recrystallization but without any preferential orientation selection. The usual brass recrystallization component ({236}<385>) which is often found to be the dominant component in the recrystallization texture of low SFE materials is not found strong in austenite in different warm-rolled and annealed DSS.
The effect of imposed strain is investigated by warm-rolling the homogenized DSS at 898K (625°C) to 98% reduction in thickness. The microstructure and texture evolution of the 70%, 90%, 95% and 98% warm-rolled and annealed materials are compared to study the effect of imposed strain. The warm-rolling temperature is selected based on the fact that the austenite in DSS is found to be stable even up to the highest deformation level at this processing temperature only.
Evolution of ultrafine lamellar deformation structure with an alternate arrangement of the phase bands is observed with increasing strain. However, the microstructure shows significant fragmentation in the ferrite phase beyond 90% warm-rolling. Ferrite shows near saturation behavior in the HAGB spacing beyond 90% reduction in thickness. In contrast, the HAGB spacing in austenite continues to decrease with increasing deformation. Ultrafine microstructure with HAGB spacing of ~250 nm and ~390 nm in austenite and ferrite, respectively is obtained after 98% reduction. The finer HAGB spacing in austenite indicates that the austenite continues to be subdivided in a progressively finer scale with
increasing deformation in austenite indicating a gradual transition from pure metal type texture to brass type texture. The crucial role of deformation twin formation during texture transition is indicated by the consistent increase of the volume fraction of twin of the copper orientation (CuT) ({552}<115>) with increasing deformation
beyond 90% warm-rolling.
The microstructural evolution during annealing is found to be affected by imposed strain and appears to be different for austenite and ferrite. The transformation from lamellar bamboo type morphology to globular morphology is much faster in ferrite of 98% warm-rolled DSS as compared to ferrite in 70% warm-rolled DSS. However, after longer isothermal holding the aspect ratio of ferrite in different warm-rolled DSS are found to be similar. In case of austenite, the effect of imposed strain on the kinetics of transformation from lamellar bamboo type morphology to globular morphology is less pronounced as compared to ferrite. The effect of strain on the kinetics of microstructural transformation is explained on the basis of evolution of finer microstructure with increasing deformation, which provides faster diffusion paths accelerating the kinetics of transformation during recrystallization.
The texture of ferrite in DSS warm-rolled to different strain levels shows the presence of stronger RD-fiber components than ND-fiber
after annealing increases with increasing strain. In case of ferrite in 98% warm-rolled and annealed DSS the RD and ND fibers are not continuous and the intensity maxima along the RD fiber is shifted from {001}<110> to {112}<110> with increasing isothermal holding time. Retention of deformation texture components is observed in austenite in different warm-rolled and annealed DSS. Stronger BS component is observed in austenite in 98% warm-rolled DSS after short isothermal annealing which is attributed to the presence of stronger BS component in the deformation texture of austenite in the 98% warm-rolled DSS prior to annealing. With increasing isothermal annealing time the strength of the brass component is decreased.
The effect of thermo-mechanical processing by warm-rolling on the evolution of mechanical properties is investigated by carrying out tensile test on DSS warm-rolled at 898K (625°C) to more than 90% reduction in thickness and after annealing for different time intervals, namely 120 seconds (2 minutes) and 1800 seconds (30 minutes) where major microstructural transformations are observed. The ultimate tensile strength (UTS) is increased with increasing strain. Ultra high strength (UTS >1.0 GPa) but limited ductility (elongation to fracture: 4-6%) is achieved in the as warm-rolled condition. However, the UTS is greatly diminished (~700 MPa), whereas the ductility is significantly improved (elongation to failure ≥20%) after annealing. The drastic loss in strength at the expense of increased ductility is attributed to faster removal of deformation structure inside the phase bands after annealing.
The effect of change in strain path is investigated using processing by multi-pass cross-rolling route. During cross-rolling the RD and TD are mutually interchanged in every pass by rotation around the ND by 90°. The cross-rolling process was carried out at
austenite in DSS after processing by cross warm-rolling in contrast to strong pure metal type texture in the straight rolled material. On the other hand, The ferrite in the cross warm-rolling processed steel showed remarkably strong RD-fiber (RD//<011>) component {001}<011>. The development of texture in the two phases after processing by cross warm-rolling is explained by the stability of the texture components.
During isothermal annealing of the 90% cross warm-rolling processed material, the development of lamellar bamboo type morphology is observed initially before the collapse of the lamellar structure due to the mutual interpenetration of the phase bands. Ferrite shows strong recovery behavior resulting in formation of annealing texture similar to the deformation texture. In contrast, the austenite shows primary recrystallization without preferential orientation selection leading to the retention of deformation texture. The evolution of deformation and annealing texture in the two phases of the DSS is found to be independent of one another.
The present work systematically illustrates that development of microstructure and texture in the two phases of the experimental DSS alloy during thermo-mechanical processing by warm-rolling is strongly affected by the processing parameters, namely, warm-rolling temperature, strain and change in strain path. However, the
phase materials. In other words, the microstructure and texture evolution in one phase is not significantly affected by the presence of the other phase. This phenomenon is explained on the basis of evolution of a lamellar deformation structure with an alternate arrangement of phase bands during warm-rolling. It is believed that the major strain accommodation should take place at the phase boundaries which separate the two phases along the RD or in other words phase boundaries which are perpendicular to the RD. Since these phase boundaries are much less than the phase boundaries which are parallel to the RD, the evolution of microstructure and texture of the two phases remains independent of one another.
-: CHAPTER 1 :-
INTRODUCTION
Thermo-mechanical processing of materials involving heavy deformation and annealing results in changes in microstructure and crystallographic texture. The microstructure and texture greatly affect the mechanical properties of the processed materials. Notable examples where crystallographic texture can significantly influence the physical or mechanical properties of materials include aluminum alloys for beverage can applications, deep drawing quality of steels for automotive applications, aluminum for use as capacitor foils and nickel base substrate tapes for coated superconductor applications. As a consequence the origin of crystallographic texture during thermo-mechanical processing has been an area of active research interest.
The origin of deformation and recrystallization texture has been intensely investigated in a wide variety of materials, including single phase FCC and BCC metals and alloys, two phase materials with the second phase dispersed in the matrix as precipitates and intermetallic alloys. However, the microstructure and particularly texture evolution during thermo-mechanical processing of duplex alloys where both the phases have grain structure, such as, (α+β) brass or ferritic-austenitic duplex stainless steels (DSS) have received far less attention.
A brief but critical literature review presented in Chapter 2 reveals that the majority of the earlier studies has focused on (α+β) brass as a model material for understanding the deformation and recrystallization behavior of duplex alloys. The published results suggest that deformation and recrystallization behavior of duplex alloys may be significantly complex affected by factors including phase fraction, imposed strain, precipitation of phases due to difference in homogenization and annealing temperatures. Studies on DSS are rather limited and they have been mostly carried out to understand microstructure and texture evolution after processing in
deformation induced martensitic transformation which can occur easily during cold-working can be avoided. This ensures that additional complexities arising out of deformation induced martensitic transformation can be avoided.
The effects of three parameters, namely, warm-rolling temperature (Chapter 4), severe deformation (Chapter 5) and strain path change (Chapter 6) on the evolution of microstructure and texture have been investigated in the present work. Electron Back Scatter Diffraction (EBSD) technique has been used as the main experimental technique (Chapter 3) for analyzing the microstructure and texture of individual phases. Tensile properties of selected DSS specimens have been evaluated in order to understand the evolution of mechanical properties and explore the potential of warm-rolling as a novel thermo-mechanical processing route for DSS alloys.
-: CHAPTER 2 :-
LITERATURE REVIEW
of ferrite [1]. In contrast, duplex alloys are two phase materials where both phases have a grain structure for e.g. (α+β) brass, (α+β) titanium alloys and (ferritic+austenitic) duplex stainless steels (DSS).
The DSS are widely used in marine, oil refineries, and in chemical processing industries. The wide range of applications of DSS stems out from the high corrosion resistance and excellent mechanical properties of DSS. Austenitic stainless steels have good weldability and toughness, whereas weak resistance to stress corrosion cracking (SCC)[2]. On the other hand, ferritic steels have good resistance to SCC but with poor toughness, especially in the welded condition [2]. A combination of both austenite and ferrite may yield optimized properties including strength, toughness and high corrosion resistance. Therefore, it is important to maintain approximately equal volume fractions of the two phases in order to achieve optimized properties.
DSS in general have base composition of Fe-Cr-Ni with different other alloying elements like Mn, N, Mo, W. Microstructural evolution in DSS can be understood by means of diagram developed by Welding Research Council (Fig.2.1) [3]. The effects of different alloying elements on stability of phases is summarized by the Creq/Nieq ((Nieq=Ni%+35.%C+20.%N+0.5.%Mn+0.25.%Cu), (Creq
duplex grade 2507. The designation of alloys is given by the weight percentage of Cr and Ni (for example 2205 designation is for 22 wt.% of Cr and 05 wt.% of Ni). As the addition of Ni, Cr and Mo makes the alloy costlier, new generation of DSS were developed known as lean and hyper-DSS by substituting Ni by Mn and/or N [4]. The newly designed DSS are cost efficient without compromising the desired properties required for the intended applications. Table 2.2 shows a summary of various commercially available DSS grades along with their typical composition.
The main drawback of DSS is the formation of intermetallic phases which degrades mechanical properties. Figure 2.2 shows the effect of alloying elements on the formation of secondary phases below 1000°C. Such as σ-phase and α’. Other secondary phases are also observed to be stable with compositions such as Cr2N, χ-phase
and R phase. Due to the formation of secondary phases the working temperature of DSS is often limited to below 300°C or above 1000°C.
It may be noted that controlled thermo-mechanical processing of duplex steels can improve mechanical properties. However, this necessitates proper understanding the evolution of microstructure and texture during thermo-mechanical processing. Interestingly, while the deformation of single phase FCC or BCC metals and alloys, two phase alloys with second phase in the dispersed form has been
Table 2.1: Typical chemistry of Duplex stainless steel grades [4] Family Cr Mo Ni Mn Cu N Others Standa rd Duplex S32304 23 0 4 1 0.13 S32205 22 3 6 1 0.17 S32750 25 3.5 7 1 0.27 S32760 25 3.8 7 1 0.7 0.27 0.7 S32520 25 3.5 7 1 1.5 0.25 NEW-Duplex (EX) S31500 18.5 2.7 5 1 0.1 S32101 21 0 1.5 5 0.2 S32001 20 0.3 1.7 5 0.3 0.15 S32003 20 1.7 3.5 2 0.15 S31260 27 3 7 1 0.5 0.16 0.3W S39274 25 3 7 1 0.6 0.27 2W S32906 29 2 6 1 0.4 S32707 27 5 6.5 1 0.4
22.5
Second generation duplex grade Lean S32001 0.03 19.5-21.5 0.6 1-3 0.05-0.17 4-6 1 S32101 0.04 21-22 0.1-0.8 1.35-1.7 0.2-0.25 4-6 0.1-0.8 S32202 0.03 21.5-24 0.45 1-2.8 0.18-0.26 2 S82011 0.03 20.5-23.5 0.1-1 1-2 0.15-0.27 2-3 0.5 S32304 0.03 21.5-24.5 0.05-0.6 3-5.5 0.05-0.2 2 0.5-0.6 Standard S32003 0.03 19.5-22.5 1.5-2 3-4 0.14-0.2 2 S31803 0.03 21-23 2.5-3.5 4.5-6.5 0.08-0.2 2 S32205 0.03 22-23 3-3.5 4.5-6.5 0.14-0.2 2 25Cr S31200 0.03 24-26 1.2-2 5.5-6.5 0.14-0.2 1 S31260 0.03 24-26 2.5-3.5 5.5-7.5 0.1-0.3 1 0.2-0.8 0.1-0.5 S32506 0.03 24-26 3-3.5 5.5-7.2 0.08-0.2 1.5 0.05-0.3 S32520 0.03 24-26 3-4 5.5-8 0.2-0.3 1.5 0.5-2
Super duplex S32750 0.03 24-26 3-5 6-8 0.24-0.32 1 0.5 S32760 0.03 24-26 3-4 6-8 0.2-0.3 1.1 0.5-1 0.5-1 S32808 0.03 26-29 0.8-1.2 7-8.2 0.3-0.4 0.8 2.1-2.5 S32906 0.03 24-26 1.5-2.6 5.8-7.5 0.3-0.4 1.5 0.8 S32950 0.03 24-26 1-2.5 3.5-5.2 0.15-0.35 2 S39274 0.03 28-30 2.5-3.5 6.8-8 0.24-0.32 1 0.2-0.8 1.5-2.5 S39277 0.025 26-29 3-4 6.5-8 0.23-0.33 0.8 1.2-2 0.8-1.2 Hyper duplex S32707 0.03 28-33 4-5 5.5-9.5 0.3-0.5 1.5 1 S33207 0.03 24.5-26.5 3-5 6-9 0.4-0.6 1.5 1
Cast duplex stainless steel
J93370 0.04 24.5-26.5 1.75-2.25 4.75-6 - 1 2.75-3.25 J93372 0.04 24-27 1.7-2.3 4.7-6 0.1-0.25 1 2.7-3.3 J93373 0.03 22.5-24.5 2.9-3.8 5.6-6.7 0.22-0.33 1.2 1.4-1.9 J93345 0.08 24-27 3-4.5 8-11 0.1-0.3 1 J93371 0.06 21-23 1.75-2.5 4-6 0.15-0.25 1 J92205 0.03 24-26 2.5-3.5 4.5-6.5 0.1-0.3 1.5 J93404 0.03 24-26 4-5 6-8 0.1-0.3 1.5
Fig.2.2: Summary of the effects of alloying elements on the formation of various precipitates [6].
the evolution of microstructure and texture during thermo-mechanical processing i.e. during deformation and recrystallization of DSS. As DSS consists of two phases (FCC+BCC), proper understanding of the evolution of microstructure and texture of the two phases during thermo-mechanical processing is of utmost importance.
In the following sections the microstructure and texture of the single phase FCC and BCC alloys will be critically reviewed which will be followed by an extensive review of the available literature on duplex alloys to place the present research in the most appropriate context.
2.2 Evolution of texture during deformation and recrystallization of single phase FCC materials
2.2.1 Representation of texture
Deformation processing of polycrystalline materials in general leads to preferred orientations or crystallographic texture with respect to a fixed reference system. The crystallographic texture can be conveniently represented by <uvw> where planes are parallel to the rolling plane (or <hkl> directions are parallel to the ND as in the cubic system plane and plane normals have the same indices) and <uvw> directions are parallel to the RD.
extensively investigated, duplex alloys have attracted much lesser attention [7]. In the present study the focus is on understanding of
Amongst several methods of representing texture, pole figures (PFs) are simple yet effective. A PF is a stereographic projection, which is a two dimensional (2D) representation showing the distribution of poles (or plane normal) with respect to the sample reference system. Figure 2.3 shows the position of the (0001) pole
Fig.2.3: The unit sphere showing the position of the (0001) pole with regard to an external reference frame which is described by the two angles α and β [8].
terms of the two angles α and β. The angle α describes the azimuth of the pole, whereas the angle β denotes the rotation of the pole starting from a specified reference direction.
The principle of projection of a pole onto a 2D plane is shown in Fig.2.4 where the {100} poles of a cubic crystal present in the stereographic projection with respect to the sample reference frame. Figure 2.4(a) shows the crystal in the unit sphere whose {100} poles are projected onto the equatorial plane (Fig. 2.4(b)) and Fig.2.4(c) shows {100} PF and definition of the PF angles α and β for the (100) pole with respect to the sample reference system.
Although, PF is one of the most effective ways of representing texture, however the information provided by PFs is mostly qualitative or semi-quantitative in nature [8]. Thus, analysis of PFs is rather difficult or ambiguous for complex texture where several components are present. In these cases analysis of orientation distribution functions (ODFs) yields much detailed information concerning texture.
ODF is a three dimensional representation of texture and gives the frequency of occurrence of any given orientation or texture component in Euler space. The Euler space is defined by three mutually orthogonal axes defined by a set of three Euler angles φ1,
Φ, φ2. These set of Euler angles constitute a scheme of three
consecutive rotations for transforming the sample frame (S) into crystal frame (C) as shown in Fig.2.5. Thus, each orientation given by <uvw> notation would correspond to a set of φ1, Φ, φ2 and
occupy a point in the three dimensional Euler space shown schematically in Fig.2.6.
ODFs are generated from several experimentally measured PFs using diverse mathematical methods. Most widely accepted methods are developed independently by Bunge [9] and Roe [10]
(a) (b) (c)
Fig.2.4: Representation of the {100} poles of a cubic crystal in the stereographic projection. (a) Crystal in the unit sphere; (b) projection of the {100} poles onto the equator plane; (c) {100} pole figure and definition of the pole figure angles α and β for the (100) pole [8].
Fig. 2.5: Schematic illustration of (a) reference system and (b) Euler angles [11].
Specimen frame (a) Crystalline frame
(b)
A first rotation φ1 around the normal direction ND transforming the transverse direction TD and the rolling direction RD into the new directions TD’ and RD’, respectively. φ1 has to have such a value that RD’ will be perpendicular to the plane formed by ND and [001].
A second rotation φ around the new direction RD’ with φ having such a value that ND is transformed into [001]] (=ND’) and TD’ into TD”.
A third rotation φ2 around [00] (=ND’) with φ2 having such a value that RD’ is transformed into [100] and TD” into [010].
Fig.2.6: Schematic representation of the three dimensional Euler space [12].
purpose. A detailed analysis of the mathematical treatments for ODF calculation can be found elsewhere [13, 14].
Depending on the crystal and sample symmetries the Euler space can be reduced. For example the Euler space is reduced to 0°≤ φ1≤90°, 0°≤Φ≤90° and 0°≤φ2≤90° for cubic crystal structure and
orthorhombic sample symmetry. However, the total Euler space can still be divided into three basic regions where each orientation appears only once.
The preferred orientation or texture would be expressed as the value of the orientation density at each point in Euler space in multiples of random. As it is difficult to interpret ODF in three dimensional space it is conveniently represented in two dimensional space using constant sections along one of the Euler angles in steps of 5°. For FCC materials ODF is represented in constant φ2 sections
[15] whereas for BCC materials constant φ1 sections are used for
representation of texture [16].
Texture can also be conveniently represented in certain cases by plotting orientation densities along certain characteristic paths or distinct crystallographic fibers. In heavily rolled FCC materials texture is characterized by two important fibers i.e. α and β fibers. The α fiber ({011}//ND) extends from the Goss or G ({011}<100>) to the brass or BS ({011}<112>) orientation while the β fiber runs
from the copper or Cu ({112}<111>) to the brass or BS
({011}<112>) through S ({123}<634>). Figure 2.7 illustrates the positions of the texture fibers along with the main rolling texture components of FCC materials in Euler space, whereas Fig.2.8 indicates their ideal locations in the constant φ2 sections.
Fig.2.7: Three dimensional view of Euler space with locations of some important ideal orientations and fibers of FCC metals [15].
Fig.2.8: Ideal orientations of FCC materials shown in the φ2 sections
2.2.2 Deformation texture of FCC materials
Microstructure and texture evolution of FCC materials during deformation depends significantly on their stacking fault energy (SFE). Therefore, medium to high SFE materials, such as, aluminum, nickel and copper show very different deformation texture as compared to low SFE FCC materials, such as, austenitic stainless steels and brass.
The rolling textures of high to medium SFE materials such as Al, Ni, and Cu are characterized by pure metal or copper type texture [7]. The copper type texture may be described by the strong presence of the ideal orientations Cu, S and BS [17-19]. The name
copper type texture is given as the texture developed is identical to the texture developed in pure copper which is shown in Fig.2.9. Figures 2.9(a) and 2.9(b) show the (111) PF of 95% cold rolled copper and aluminum, respectively which appear quite similar. This texture is developed in the form of a continuous tube running from BS (φ1=35°, Φ= 45°, φ2=0°/90°) through S (φ1=59°, Φ= 37°,
φ2=63°) to Cu (φ1=90°, Φ= 34°, φ2=45°). A schematic
representation of the tube is given in Fig.2.7. The tube shown in Fig.2.7 [15] can also be described in terms of its axis or skeleton line. A better description of the texture in 90% rolled pure copper can be provided by the ODF shown in Fig.2.10 which shows strong intensities at the ideal locations of pure metal texture components.
The deformation textures of low SFE FCC metals and alloys such as austenitic stainless steel, α brass are known as brass or alloy type texture. Alloy type texture is described by the presence of the ideal orientations which include G (φ1=0°, Φ= 45°, φ2=90°) and BS
orientation (φ1=35°, Φ= 45°, φ2=90°). In low SFE alloys, with
increasing strain, copper type texture is gradually transformed to brass type texture. Such transition is observed in Cu-Zn alloys [15]
(a) (b)
Fig.2.9: (111) pole figure of 95% cold rolled (a) copper and (b) aluminum [7].
Fig.2.10: ODF of 90% cold rolled aluminum with positions of deformation texture components indicated [7].
which is attributed to decrease in SFE due to increasing solute content.
Development of alloy type texture is shown in Fig.2.11 by the (111) PFs of a series of Cu-Zn alloys having 0, 5, and 30% Zn rolled to 50%, 75% and 95% reduction in thickness [15]. Well-developed alloy type texture after 95% cold-rolling of 70:30 brass is shown in the ODF in Fig.2.12. Transition from copper type texture to brass type texture in low SFE alloys is explained on the basis of formation of deformation twins [19] [20-23].
2.2.3 Annealing textures of FCC materials
During deformation energy is stored in materials mainly in the form of dislocations. This energy is released by three main processes, namely, recovery, recrystallization, and grain growth. The driving force for both recovery and recrystallization processes is the reduction in the stored energy of the deformed materials. However, as recovery lowers the driving force for recrystallization, excessive recovery may retard recrystallization. Conversely, the extent of recovery is limited by the ease with which recrystallization can occur.
Recrystallization in which the nucleation and growth of strain free grains occurs by the formation and migration of high angle grain boundaries (HAGBs) which consumes the deformed microstructure is known as primary or discontinuous recrystallization. In contrast, the process by which deformation microstructure can be converted into a microstructure consisting of grains fully bounded by HAGBs without any nucleation and growth of strain free grains (which are characteristics of a discontinuous recrystallization process as already pointed out) is known as continuous recrystallization or extended recovery.
95%
In the continuous recrystallization process the major mechanism of microstructural transformation is subgrain growth. Figure 2.13 schematically shows the major differences between the continuous (Fig.2.13((a)-(b)) and discontinuous recrystallization (Fig.2.13((c)-(d)) processes [24].
In general, during continuous recrystallization (extended recovery process) no perceptible change in annealing texture as compared to deformation texture is expected. This could be easily understood by the fact that this process does not involve nucleation and growth of strain free grains. In sharp contrast, the annealing textures of materials which show the discontinuous recrystallization behavior involving nucleation and growth of strain free grains, recrystallization textures may be significantly different as compared to their deformation textures.
Medium to high SFE FCC metals and alloys, such as, pure aluminum, nickel and copper show sharp cube texture ({001}<100>) following heavy deformation and annealing. The origin of the cube texture has been a subject of intense research for many years, presumably due to the importance of this texture component in controlling the physical and mechanical properties in many engineering applications including high voltage aluminum capacitor foil [25], nickel base superconducting substrate tapes [26] and deep-drawing properties of aluminum alloy beverage cans [27]. Understanding the origin of cube texture is also important for analyzing the two major but contrasting theories of formation of recrystallization texture, namely, oriented nucleation and oriented growth models.
Fig.2.13: Schematic illustration of ((a,b)) continuous and ((c,d)) discontinuous annealing processes [7].
The basic premise of the oriented nucleation theory is the preferred nucleation of grains of certain orientations e.g. cube orientation from pre-existing regions in the deformation matrix (known as cube bands) [28]. It is also suggested that the preferential nucleation of cube grains would be aided by the lower stored energy of the cube regions due to their unique dislocation arrangement for ideal cube orientation involving interaction of dislocations with orthogonal burgers vector.
The development of sharp recrystallization texture, according to the oriented growth model, is attributed to the preferential growth of grains of specific orientations (e.g. cube grains) from a rather random assembly of orientations. The preferential growth of certain orientations is attributed to the presence of high mobility boundaries with special misorientation relationship e.g. 40°<111> separating these grains from the deformed matrix.
In contrast to high to medium SFE FCC materials, the annealing textures of low SFE materials are far less investigated and understood. It must be pointed out that while the development of a brass-type texture during cold-rolling in low SFE alloys is widely reported [22, 29], there is much less clarity concerning the recrystallization texture of low SFE materials. This is compounded by the fact that the recrystallization texture of low SFE alloys is strongly influenced by the starting grain size, annealing temperatures and imposed strain. In addition, alloy composition also plays a crucial role.
In a more simplified manner, the annealing textures of low SFE FCC materials have been mostly studied using 70:30 brass as a model material. Low temperature annealing of heavily deformed 70:30 brass results in the formation of the well-known brass recrystallization component {236}<385> component. The origin of
such as, austenitic steels, twinning induced plasticity (TWIP steels) and high entropy alloys (HEAs) have been reported. Bracke et al [31] have critically analyzed the effects of various processing and microstructural parameters on the formation of recrystallization textures in various TWIP and austenitic stainless steels having low SFE values (15-45 mJ/m2). Interestingly, the majority of the
investigations reported retention of rolling texture components, particularly the BS and G [31-33] and development of α-fiber in the
[33, 34]. As already pointed out, continuous recrystallization or extended recovery can result in the retention of deformation texture, however, this possibility has been ruled out in favor of discontinuous recrystallization evidenced by the presence of clear recrystallization front [32]. The alternative but more acceptable explanation for the retention of deformation texture components after recrystallization is a consequence of nucleation of recrystallization without preferential orientation selection in an energetically homogeneous deformed matrix [31, 32]. Very similar observations have recently been reported in low SFE high entropy alloys [35]. In contrast, some researchers have also reported very weak or even randomized texture in TWIP steels after cold-rolling and annealing [36, 37]. The weak or randomized texture has been explained on the basis of nucleation at micro shear bands [36, 38],
2.3 Deformation and annealing textures of single phase BCC materials
2.3.1 Deformation textures of BCC materials
The rolling textures of BCC materials are usually described by two crystallographic fibers, namely, the RD (or α) (<011>//RD) and ND (or γ) (<111>//ND). Figure 2.14 shows the two fibers together with the major orientations along these fibers [40]. Despite the fact that BCC rolling and recrystallization textures are usually shown in constant φ1 sections, it is observed that the two most important
texture fibers can be easily visualized in the φ2=45° section as
shown in Fig.2.15 [8]. The characteristic changes in texture during rolling and recrystallization can thus be effectively compared by plotting the intensity along these fibers.
The rolling and recrystallization textures of different types of BCC steels show similarities, but also exhibit characteristic differences depending on starting texture, microstructure and presence of precipitates. However, review of texture development in low carbon, interstitial free (IF) and ferritic stainless steels will be most relevant for the present study.
The rolling texture evolution in low-carbon steels is independent of composition and processing [41]. During hot-rolling of these steels recrystallization and γα phase transformation happens which leads to grain refinement and a randomization of texture [40]. During cold-rolling the texture is strengthened with increasing strain. At lower strain (≤ 70% reduction in thickness), strong RD-fiber with {001}<110> and {112}<110> as the dominating components could be observed. In contrast, weak presence of the ND-fiber component {111}<112> is reported. However, beyond
Fig.2.14: Three dimensional view of Euler space with locations of some important ideal orientations and fibers of BCC metals [40].
Fig.2.15: Typical φ2= 45° section of ODF of BCC materials showing
the locations of individual texture components along the two fibers [8].
this deformation level maximum of the RD-fiber is shifted to {112}<110> and that on the ND-fiber from {11 1}<112> to {111}<110> [16]. The ND-fiber usually shows uniform intensity upto 80% reduction, but during further deformation the {111} <110> emerge as the dominant texture component. This is understood from Fig.2.16 which show variation of texture components along RD and ND fibers with increasing reduction in an extra low carbon IF steel.
Ferritic stainless steel grades will not undergo γα phase transformation during hot rolling, as a result, no randomization of texture takes place [42, 43]. Development of texture in these steels is dependent on the composition and processing history. The hot bands of ferritic stainless steels commonly display pronounced textures and strong through-thickness gradients. In the center layer a sharp RD-fiber [44] and close to the surface strong shear components such as G, {4 4 11}< 11 11 8}, and BS
develop during hot-rolling [44]. However, after heavy cold-rolling, stronger RD-fiber than ND-fiber is observed. The sharpness of the α-fiber is increased at the center layer of the strip, whereas, in the surface layer shear components rotate towards the RD-fiber [44].
Other BCC materials, like tantalum, molybdenum, and niobium, show the presence of RD and ND-fibers in the cold-rolling textures. However, pronounced through-thickness texture gradient is reported in cold-rolled refractory metals [8].
2.3.2 Annealing textures of BCC materials
Annealing textures of BCC materials strongly depend on the previous hot and cold-rolling textures [45]. The main
![Table 2.1: Typical chemistry of Duplex stainless steel grades [4] Family Cr Mo Ni Mn Cu N Others Standa rd Duplex S32304 23 0 4 1 0.13 S32205 22 3 6 1 0.17 S32750 25 3.5 7 1 0.27 S32760 25 3.8 7 1 0.7 0.27 0.7 S32520 25 3.5 7 1 1.5 0.25](https://thumb-us.123doks.com/thumbv2/123dok_us/909398.2617244/41.918.151.774.172.771/table-typical-chemistry-duplex-stainless-family-standa-duplex.webp)
![Fig. 2.5: Schematic illustration of (a) reference system and (b) Euler angles [11]](https://thumb-us.123doks.com/thumbv2/123dok_us/909398.2617244/49.918.136.829.115.918/fig-schematic-illustration-reference-b-euler-angles.webp)

![Fig. 3.5: Origin of Kikuchi lines from the EBSD perspective [8].](https://thumb-us.123doks.com/thumbv2/123dok_us/909398.2617244/90.918.180.669.382.787/fig-origin-kikuchi-lines-ebsd-perspective.webp)
![Fig: 3.6: Components of a commercial EBSD system [8].](https://thumb-us.123doks.com/thumbv2/123dok_us/909398.2617244/92.918.231.738.398.789/fig-components-commercial-ebsd.webp)