IZA DP No. 3930
Monopsonistic Discrimination, Worker Turnover,
and the Gender Wage Gap
Erling Barth Harald Dale-Olsen
DISCUSSION P
APER SERIES
Forschungsinstitut zur Zukunft der Arbeit Institute for the Study of Labor
Monopsonistic Discrimination, Worker
Turnover, and the Gender Wage Gap
Erling Barth
Institute for Social Research, Oslo, University of Oslo and IZA
Harald Dale-Olsen
Institute for Social Research, OsloDiscussion Paper No. 3930
January 2009
IZA P.O. Box 7240 53072 Bonn Germany Phone: +49-228-3894-0 Fax: +49-228-3894-180 E-mail: iza@iza.orgAnyopinions expressed here are those of the author(s) and not those of IZA. Research published in
this series may include views on policy, but the institute itself takes no institutional policy positions. The Institute for the Study of Labor (IZA) in Bonn is a local and virtual international research center and a place of communication between science, politics and business. IZA is an independent nonprofit organization supported by Deutsche Post World Net. The center is associated with the University of Bonn and offers a stimulating research environment through its international network, workshops and conferences, data service, project support, research visits and doctoral program. IZA engages in (i) original and internationally competitive research in all fields of labor economics, (ii) development of policy concepts, and (iii) dissemination of research results and concepts to the interested public. IZA Discussion Papers often represent preliminary work and are circulated to encourage discussion. Citation of such a paper should account for its provisional character. A revised version may be available directly from the author.
IZA Discussion Paper No. 3930 January 2009
ABSTRACT
Monopsonistic Discrimination, Worker Turnover,
and the Gender Wage Gap
*Motivated by models of worker flows, we argue in this paper that monopsonistic discrimination may be a substantial factor behind the overall gender wage gap. On matched employer-employee data from Norway, we estimate establishment-specific wage premiums separately for men and women, conditioning on fixed individual effects. Regressions of worker turnover on the wage premium identify less wage elastic labour supply facing each establishment of women than that of men. Workforce gender composition is strongly related to employers’ wage policies. The results suggest that 70-90 percent of the gender wage gap for low-educated workers may be attributed to differences in labour market frictions between men and women, while the similar figures for high-educated workers ranges from 20 to 70 percent.
JEL Classification: J16, J31, J42, J63, J71
Keywords: gender wage gap, monopsony
Corresponding author: Erling Barth
Institute for Social Research P.O. Box 3233 Elisenberg N-0208 Oslo Norway E-mail: eba@socialresearch.no *
An earlier version of this paper has been circulated as NBER working paper # 7197. The empirical part of the paper is, however, completely redone with panel data and more comprehensive methods. We thank Monica Galizzi, Claudia Goldin, the editor and the two anonymous referees for helpful and constructive comments and suggestions. We acknowledge financial support from the Norwegian Research Council, grants No. 124582/510 and 173951/S20.
The data used in this study are micro data received from Statistics Norway by consent of the Data Inspectorate, to be used for specified research projects at the Institute for Social Research. The Institute for Social Research is not therefore in a position to make these data available to other users, but Statistics Norway may allow access to the data, subject to approval of an application. Access from outside Norway will normally not be allowed. However, in such cases Statistics Norway may allow
1. Introduction
Modern labour economics does not give the theory of monopsonistic discrimination much credit as an explanation of gender differences in pay. In this paper, however, we identify gender differences in worker turnover patterns that provide employers with incentives to pay men and women differently. We show that the labour supply of men facing each establishment is more elastic than the labour supply of women.
Joan Robinson (1933) developed the idea of monopsonistic discrimination in the labour market. The idea is simple: a single buyer, a monopsonist, sets wages below marginal revenue product. The more inelastic the labour supply, the lower are wages relative to productivity. By differentiating wages between groups with different elasticities of labour supply, the monopsonist may obtain higher profits. Robinson suggests gender as one of the dimensions along which the employer may discriminate. If female labour supply is more inelastic than male labour supply, women will earn less than men relative to their productivity, and thus face a higher level of exploitation in the labour market.
While some works argue in favour of monopsonistic discrimination1, the general
consensus now seems to be that this model does not add much to the understanding of the overall gender wage gap. This is true on both sides of the Atlantic: Jane Humphries (1995) writes“But this classic case (pure monopsony) seems to have little empirical purchase” 2, in
1 See for example Madden (1973). Also, several studies report evidence consistent with such behaviour in particular labour markets (Ferber, Loeb and Lowry, 1978; Booton and Lane, 1985; Ransom, 1993; Bratsberg et al., 2003). Winter-Ebmer (1995) finds that wages and job opportunities of married women react negatively to spatial monopsony indicators.
2 She does, however, add, “women are more constrained than men in choice of employer” and “may face an effective monopsonist, in contrast to men who can travel further and be available more flexibly”.
the theoretical chapter of The Economics of Equal Opportunities, edited by herself and Jill Rubury. Blau, Ferber and Winkler (1998) write in a footnote “It seems likely,..., that the monopsony explanation is more applicable to specific occupations and specific labour markets than to the aggregate gender pay differential.” The model is refuted because single buyer situations are rare, but most importantly, since female labour supply is found to be at least as elastic as that of male labour supply.
More recent theoretical developments have revitalised the concept of monopsony in the labour market3. Among the theoretical works, the analyses of job-to-job flows within a
search theoretic framework by Burdett and Mortensen (1998) and Manning (2003) have established the idea that each single firm or establishment faces its own individual labour supply curve. The point is that workers quit endogenously, and have to be replaced by new hires. The higher the wage, the fewer the quits and also the easier it is to attract replacement hires. We analyse Robinson’s idea of monopsonistic discrimination within a modern model framework based on the dynamics of labour supply to each firm. In the dynamic monopsony model, differences in the exogenous quit rate or in the probability of receiving a job offer produce incentives for monopsonistic discrimination.4
Several conditions have to be met in order for the model of monopsonistic discri-mination to work. One is that employers should be able to distinguish between men and
3 See, e.g., Boal and Ransom (1997), Bashkar and To (1999), Bashkar, Manning and To (2002) and Manning (2003). 4 Green, Machin and Manning (1996) show in a dynamic monopsony model that the elasticity of wages with re-spect to employer size is increasing in the ratio of exogenous quits to the arrival rate of jobs. Both Black (1995) and Bowlus and Eckstein (2002) develop equilibrium search models associating discrimination with the pre-sence of a disutility taste factor on the part of employers. Particularly, Bowlus and Eckstein use a similar model framework as ours, where in their model,differences in job arrival rates follow from employers’ disutility factor.
women in the wage setting process. We argue that even in the absence of pure wage discrimi-nation - unequal wages for equal work – employers may distinguish between jobs with uneven gender composition.5 Lucifora and Reilly (1990) show that female-dominated occupations pay
less than male-dominated occupations. Meyerson et al. (2001) conclude that there are very small wage differences between men and women within finely defined job-cells in the same establishment. Gender differences arise across jobs or occupations and establishments.
Next, the labour supply curve of women has to be less elastic than the labour supply curve of men. This is the very point on which the model of monopsonistic discrimination has been scrapped. It seems that female labour supply is equally, or more, wage sensitive than men’s labour supply. However, this observation is done on the margin of the labour force; i.e. on the participation decision of men and women. An important point for our study is that even if the aggregate labour supply of women is more wage sensitive than the aggregate labour supply of men, the labour supply of women facing each establishment may be less wage sensitive than the labour supply of men facing each establishment. The main reason is that the labour supply facing each establishment also depends crucially on job-to-job search by employees in own and other establishments. The burden of proof then shifts from participation decisions to turnover behaviour.
5Employers hardly employ a separate wage policy for each gender. It is not legal for a firm to pay men and women differently within a job. It is hardly the practice to do so either (see eg. Meyersson Milgrom (2001)). As suggested by a referee, employers may also discriminate by creating different job titles when they hire women or men. We expect such behaviour to be constrained by other determinants of the job structure within establishments as well as considerations related to the gender of future replacement hires.
However, several studies reveal that women’s turnover is actually similar to that of men’s, once appropriate control is included (e.g. Blau and Kahn, 1981; Galizzi, 2001; and Viscusi, 1979). Even in Manning’s book on monopsony, he writes about gender discrimination in the labour market and gender differences in the elasticity of worker turnover with respect to wages that “the gender differences that we have identified in previous sections do not show up in these estimated elasticities. Whether this is because this approach to estimating elasticities is not very informative or because the total effect of the gender differences in constraints and motivation is small, is an issue that deserves further consideration”(Manning, 2003:208).
The main empirical contribution of our paper is to show that once we rinse the wage measure used in turnover regressions for worker differences in qualification and outside options, the estimated labour supply of women facing each employer is less wage elastic than the supply of men. Thus we provide strong support for the idea that employers have an incentive to apply monopsonistic discrimination against women in their wage policies. We use establishment fixed effects as measures of the establishments’ wage policies, and distinguish between demand and supply effects by using instruments for the establishments’ wage policy. Next, we show that the establishments’ gender composition is closely related to the establishments’ wage policies. Finally, we estimate the amount of the observed gender wage gap that may be attributed to frictions and monopsonistic discrimination.
Our study is not, however, the only one providing evidence supporting the model of monopsonistic discrimination. Using data on high school and college graduates, Bowlus (1997) identifies higher labour market frictions for women than men. Her study was the first to apply an equilibrium search model on gender wage differentials. Bowlus finds that the differences in search parameters explain 20-30 percent of overall male-female wage differentials of high school and college graduates.
Related evidence has also been presented by Green, Machin and Manning (1996) and Manning (1996). Green et al. (1996) identify higher size-wage effects for women than for men, an observation which is consistent with a model of monopsonistic discrimination in the labour market. Manning (1996) analyses relative female employment following from the large rise in the relative earnings of women in the UK after the Equal Pay act of 1970 was passed. He attributes the observation that female relative employment did not fall, to monopsony in the female labour market. Differences in turnover behaviour between men and women are identified in several studies. Loprest (1992) finds that young women have on average less than 50 per cent of the wage growth of young men when changing jobs. Sicherman (1996) finds that, at low levels of tenure, women have higher rates of departures than men do, but as tenure rises, women were less likely than men to leave the firm. The evidences of Pissarides and Wadsworth (1994) (UK) and Keith and McWilliams (1999) (US) suggest that there are gender differences in search behaviour and job-to-job search intensity. The paper is structured as follows. Section 2 presents a theoretical model of monop-sonistic discrimination. Section 3 discusses the elasticity of labour supply facing each establi-shment6 versus the elasticity of the aggregate labour supply. Section 4 presents the empirical
specification, while Section 5 describes the data. Section 6 reports results from separation and excess turnover regressions. In Section 7 we analyse the relationship between gender workforce composition and wage differentials between men and women, as well as establishment-specific wage premiums for each gender. Section 8 studies the importance of search frictions and monopsonistic discrimination for the gender wage gap. Section 9 concludes the paper.
2. A theory of monopsonistic discrimination
In this section we develop a model of monopsonistic discrimination based on the standard models of job-to-job search and equilibrium wage distribution of the Burdett and Mortensen (1998) and Manning (2003) type. We consider an economy consisting of two labour inputs, j=1,2 , and where the employers may freely set wages for each type of labour. We assume that the two types of labour operate in completely segregated labour markets, which means that they draw wage offers from separate distributions. Under this assumption, we may think of the two groups as men and women, or more realistically, as two types of occupational groups with no inter-occupational mobility in the short term.7
Assuming that there are some frictions in the labour market, the number of employees of type j the employer may hire in a given period of time, is an increasing function of the wage Hj(wj), Hj’(wj) > 0, while the fraction of the employer’s stock of
employees that leaves the firm over the same period is a decreasing function of the wage qj(wj), qj’(wj) < 0. While quits are assumed proportional to the number of employees, the
number of hires is, by an assumption of random matching (Burdett and Vishwanath, 1988) a function of w and independent of Lj (the employer’s stock of employees of type j). In steady
state, Lj is constant and the labour supply to any one firm is given by Lj(wj)=Hj(wj)/qj(wj).
Let λj be the probability that an employee of type j receives a job offer. Let Fj(wj) be
the endogenously determined wage offer cumulative distribution function (cdf). δj is an
6 We use the terms firm, employer and establishment interchangeably throughout. In the empirical analysis, an establishment is defined by an unique employer and location identification (see Section 4 for a discussion). 7 This is obvious a simplification, but note that most workers do not reenter the educational system in Norway (in our data less than 10% percent) and OECD (1988) ranks Norway as number 2 as far as occupational segregation in the OECD countries is concerned, while Great Britain ranks 4.
exogenous separation rate. The probability that an employee of type j separates is then given by qj(wj) = δj+λj(1-Fj (wj)). Consider next the hiring function. Let the probability that an
unemployed worker receives a wage offer be λj as well. We have Fj(b)=0, where b is the
common reservation wage of the unemployed workers. Unemployed workers who receive a wage offer accept. In addition, the firm hires from employed workers who earn less than w. The cdf of workers over wages is given by Gj(wj), and may deviate from the distribution of
firms over wages because the number of workers per firm may differ. Thus, , M ) U N ( ) w ( G M U ) w (
Hj j =λj j +λj j j j− j where Uj is the number of unemployed workers, Nj is
the labour force and M is the number of firms in the economy. The steady state unemployment rate is given by δj/(δj+λj).
Equating the flows in and out of the wage distribution, and using the condition of a steady state unemployment rate, we obtain the labour supply of group j facing each firm which is given by:
1) , 1,2. )] ( 1 ( [ ) ( 2 = − + = j M N w F w L j j j j j j j j j λ δ λ δ
The profit of an employer is given by R[L1 (w1), L2(w2)] – w1 L1(w1) – w2 L2(w1), where R[·] is
revenue. We assume that each labour input has the same marginal revenue product, p, and is inde-pendent in production. The first order conditions for the wage-setting employers are:
2) ( ) − =0, =1,2. ∂ ∂ − L j w L w p j j j j
Equation 2) readily translates into the standard expression of monopsonistic exploitation for each group of workers:
3) , 2 , 1 , 1 = = − j w w p j j j ε
where εj is the elasticity of labour supply of type j facing a firm. Thus wages are set so that
the marginal value product equals wages multiplied a mark-up, ωj, which depends on the
elasticity of labour supply of type j facing a firm, i.e., as expressed by Equation 4):
4) 1 j j j j. j w w p ω ε ε = + =
Transformation of Equation 4) gives the wage gap between workers of the two types as: 5) , 1 ) 1 ( 2 1 2 1 1 2 1 1 2 − = + − = − ω ω ε ε ε ε w w w
which increases in the ratio of the elasticity of labour supply of group 2 relative to the elasticity of labour supply of group 1.
The crucial empirical prediction from the model of monopsonistic discrimination is that the labour supply of women facing each firm is less wage elastic than that of men. This is what provides the employer with an incentive to discriminate between the two groups, and this is exactly the feature that we examine and test in the empirical part of the paper.
Consider next the relationship between the labour supply facing each establishment and aggregate labour supply. The labour supply of one type of labour facing establishment f may be written Lf =lf(w) N, where
M 1 )] w ( F 1 ( [ ) w ( lf 2 − + = λ δ δλ is establishment f’s share of aggregate labour supply (see Equation 1). Traditional labour supply models analyse the participation decision, or the relationship between aggregate labour supply, N, and the
expected wage, ωG, They have found women’s labour market participation to be more wage
elastic than that of men.8
Manning (2003) incorporates aggregate labour supply into the monopsony model.
He does so by allowing for heterogeneity in reservation wages and shows that Lf = lf(w) Γ(w) N, where Γ(.) is the cdf of reservation wages.9 The elasticity of labour supply
facing each firm equals: εlf = εl + εA , where εl is the elasiticy of l arising from the firms’ need
to accommodate turnover in a market with frictions (i.e. from the standard monopsony model as analysed above), and εA is the elasticity of Γ arising from the participation decision
(i.e. aggregate labour supply). It is thus an empirical question to what extent the labour supply of women facing each firm is more or less wage elastic than the labour supply of men facing each firm, even if the elasticity of participation is higher for women. What matters for the wage policy of the firm is the labour supply facing each establishment, and if the labour market frictions are sufficiently larger for women than for men, the monopsony model may still provide the explanation of the gender wage gap even if aggregate supply of women is more wage elastic. The purpose of the empirical part of this paper is thus to provide an answer to this question: Are there significant differences between the labour supply elasticities of men and women facing each establishment?
4. Empirical specification
From Equation 1), the elasticity of labour supply of type j facing a firm may be written:
8 This is for example the implication found in a recent contribution studying the impact of taxation on the labour supply of men and women (husbands and wives) in Sweden, where exogenous tax variation cause variation in earnings (Gelber, 2008).
6) , 2 , 1 j , w ) w ( q ) w ( q w 2 w ) w ( L ) w ( L w j j j j j j j j j j j j j = ∂ ∂ − = ∂ ∂ = ε
where denotes the separation rate defined previously in Section 2. Thus, examining the elasticity of labour supply with respect to wages is equivalent to examining the elasticity of the steady state separation rate with respect to wages. This implies that what we need in our econometric analysis, are measures of the employer’s wage policy and of the steady-state separation rate. These measures are described in the next sections, where we for expositional simplicity suppress the superscript for the type of worker.
) ( j
j
w q
The Employer’s Wage Policy
Let the expected alternative wage of an employee i outside his current establishment f at time t, wa ift, be given: 7) ln t ift i, a ift x w =γ + β +θ
where xift are covariates describing time-varying observable productivity characteristics such
as experience and establishment-specific seniority, and θi is an individual productivity factor
(including both unobservable and observable characteristics). The establishment-specific wage premium or wage policy is modelled as follows. We assume the employer chooses a
wage policyφf which produces the wage:
8) ln ln f ift,
a ift
ift w
w =γ + +ϕ +υ
for individual i at time t. γt describes time dummies. ϕf expresses an establishment-specific
fixed effect, which defines the establishment-specific wage premium of establishment f relative to the alternative wage of its workers. νift is an error term with standard properties.
Our measure of the wage policy of the firm is completely rinsed of all wage effects associated with the individual’s level of human capital. As is standard with all fixed individual and firm-models, potential match-specific wage effects are disregarded.10
We estimate 8) as follows: First we introduce a vector of establishment dummies. Then we conduct the ordinary panel data within-individual transformation11 of all covariates
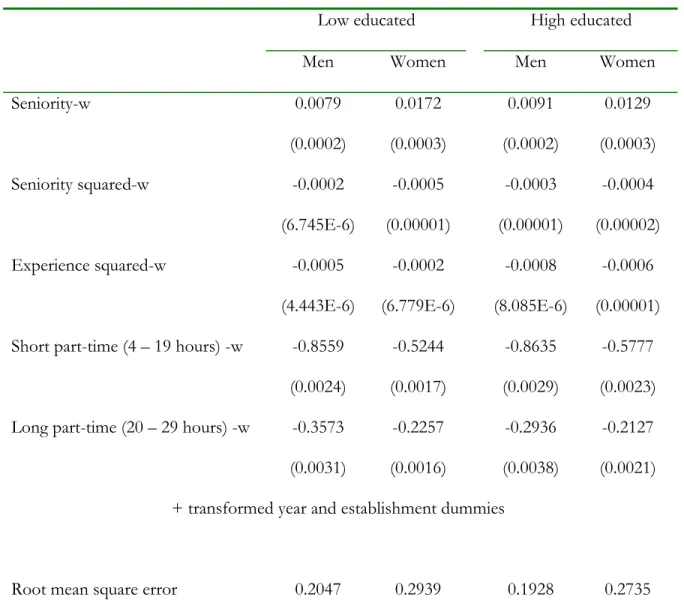
(including the establishment dummies) as well as of log(wage). Running OLS for each group of workers on this transformed equation then produces unbiased efficient estimates of the establishments dummies and β (see Table A1 in the appendix for the results). ϕf is then
normalised by taking the deviation from the employment-weighted mean of the estimated establishment dummies across all establishments.
This way of modelling the wage policy of the firm, produces the following relationship between the elasticity of labour supply facing a specific employer f and the employer-specific separation rate:
9) f f f f f f f f f q (w ) log q (w ) 1 2 2 q (w ) ∂ ∂ ε = − = − ∂ϕ ∂ϕ ,
according to Equation 6) and the semi-logarithmic specification of the wage equation. Our turnover regressions follow from Equation 9).
10 Potential match specific components will be distributed on the individual- or firm-specific effects according to the variations in the data set. For instance, for stayers a match specific component over and above the firm effect will be attributed to the individual, while for movers the distribution will depend on the other movers that identify any given firm effect.
11 The transformation implies that a variable is subtracted the individual-specific average (over the observation period) of that variable.
Steady-state separation rate
In steady-state where establishment-size is kept constant, each separation has to be met by a replacement hire. In this case, the separation rate is equal to the turnover rate. However, in our data some establishments grow, while other establishments decline. We use two empirical measures of the steady-state separation rate – the empirical separation rate and an excess turnover rate. The separation rate, s, is constructed by first defining a dummy-variable at the individual level, S=1 if an employee separates12, otherwise S=0, and then estimate the
establishment-specific separation rate by taking the establishment-specific mean.The excess turnover rate corrects for the fact that growth (decline) of an establishment also induces hires (separations). Excess turnover (et) is defined as et=min[h,s], where h and s denote starts (h) and separations (s)during the period. Excess turnover is thus the part of worker turnover needed in a stationary environment for each firm to keep its stock of workers constant. The excess turnover rate is then defined by dividing the excess turnover by the average stock of workers during the
12 We use the term “separations”, since we do not know whether the employee quits voluntarily or if the employee was fired. This is not ideal, but common in many linked employer-employee data studies. However, voluntary quits are likely to dominate involuntary quits in Norway, at least partly due to the rather strict employment protection legislation (EPL). Furthermore, according to our model, displacements/involuntary quits are not related to wages, so when we study empirically the relationship between separations and wages, we still measure the desired relationship. On the other hand, if involuntary quits and displacements are influenced by wages, for this to matter for our key results, the relationship between involuntary quits and wages for men and women have to be contrary to the relationship between voluntary quits and wages. Since EPL does not provide women with different rights or protection than men, there is little reason to think that the relationship between involuntary quits and wages differ between men and women.
period. 13 Both the separation rate and excess turnover rate are calculated separately for four
groups of workers (gender/level of educational attainment) (see Section 5).
We use establishments as our unit of observation. This implies that we cannot disentangle the movement of workers between establishments within the same firm from movements of workers between firms. If the personnel and wage policies of the firms are establishment specific, this poses no problem for us. If the wage polices of firms are firm specific, on the other hand, the movements of workers across plants within a firm may create some noise in our data. However, a majority of the Norwegian firms consists of a single establishment only, and movements of workers between establishments within multi-establishment comprise a relatively small part of the aggregate separation rate.14
Finally, one may argue that worker turnover and the wage policy of an employer are jointly determined. In some of the turnover regressions we therefore instrument the wage policy by capital (see Section 6 for discussion and details).
13 The excess turnover rate is equivalent to what Albæk and Sørensen (1998) define as the replacement hiring rate, or to half of the churning rate as defined by Burgess et al. (2000).
14 One referee pointed out this potential shortcoming. Using similar Norwegian register data for the growth
years of 1996 and 1997 comprising the complete population of private sector jobs, establishments and firms, we explored this issue. Of 118405 private sector firms in 1996, 113800 firms (96.1 percent) comprised one single establishment only. The average aggregate separation rate in 1996-97 was 27 percent, whereof 3.7 percentage points are caused by within-firm mobility, we thus regard this potential shortcoming of our data to be of little worry.
5. The data
Our data comprise all establishments and employees in the central south-east region of Norway, covering about 45 percent of all employees in Norway during the period 1989-97. They are based on information from the Current System of Social Data (CSSD). CSSD consists of several public administrative registers linked together into an integrated data system, which is managed by Statistics Norway. However, we restrict our analysis to individuals 20-60 years of age working in what may be considered the same geographical labour market. We focus on four groups of individuals, depending on their gender and their level of educational attainment, whom are working in the central south-east area of Norway (comprising e.g., the capital Oslo).15 Our four educational groups are: I) Women – low
education, II) Men – low education, III) Women – high education (college or university) and IV) Men – high education (college or university). Unskilled labour, vocational training and high school (highest educational attainment less than five years education in excess of 9-years of compulsory schooling) are denoted as low education.
Wages are measured as daily earnings. Our earnings measure comprises ordinary wages and all taxable fringe benefits reported to (and evaluated) by the Norwegian tax authorities. To avoid observations of outliers, we have estimated a simple OLS log wage regression controlling for standard human capital variables. We then discard observations where the residual from the regression is outside +/- five standard errors.
The identification of fixed worker and establishments effects rests on observations of movers (workers that change employers during our period of observation). The fixed worker and establishments effects cannot be identified in establishments with no movers. Thus we
discard all observations of establishments with less than five movers. The wage estimations were conducted separately for each group. The groups vary in size, from just below 100 000 workers to more than 200 000 workers.16 Since our wage equations are estimated separately
for each group, they identify fixed group-specific establishment effects.
Establishments’ separation rates and excess turnover rates are constructed by using information about all employees of the given gender/educational group, who is employed on the 16th of May each of the years 1989-97. This date is chosen to maximise the quality of the
register information, since an administrative correction procedure is conducted by the public authorities late winter each year. In order to avoid integer problems and small sample uncertainty, we discard in the group-specific turnover regressions all observations of establishments with less than 10 employees belonging to any specific group.
Since our analyses of the groups are mainly conducted separately for each group, the variables related to an establishment’s employees are usually constructed for employees belonging to one group only. The main reason for doing this is to focus on the group differences. In general, our establishments may very well employ a mixture of employees belonging to different groups.
6. Gender differences in the elasticity of worker turnover with respect to
wages
A prerequisite for the theory of monopsonistic discrimination to provide a reasonable explanation for the gender wage gap is that worker turnover of women is less sensitive to
16 Information on the group composition (observations/wage earners/establishments): group I (1145377/227927/6291), group II (1040826/216155/5434), group III (471349/95144/2380) and group IV (465769/98508/2423).
wages than that of men’s worker turnover. Previous studies, such as for example Manning (2003), have not been able to find strong evidence for this. As a backdrop to our empirical analysis, we first show that given Manning’s empirical approach this appears true also in our data. We will later show that these results are basically caused by lack of appropriate control for individual productivity differences.
In Table 1 we repeat Manning’s analysis on the elasticity of worker turnover with respect to wages (Table 7.7, Manning, 2003). We have split our sample of establishments into four categories depending on the workforce’s level of education (low or high education) and gender. Then we run, separately for each group, weighted least squares regressions (WLS)17 of establishment-specific quit rates on the establishment-specific average wage,
including controls for industry (2-digit SIC-code) and county. [ Table 1 around here ]
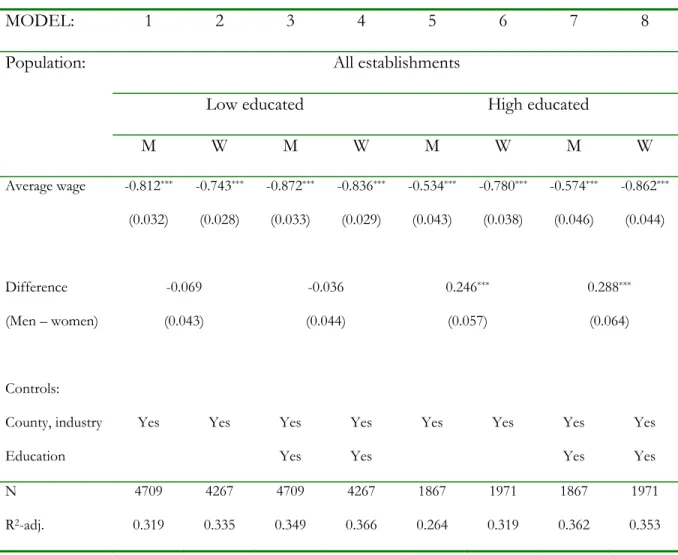
Table 1 shows that for low educated workers, the estimated elasticity of worker turnover w.r.t. wages for both men and women is around -0.9. For high educated workers, however, the estimated elasticity of worker turnover w.r.t. wages for women is around -0.9, while the corresponding elasticity for men is only -0.5. Thus for the high-educated workers, we even observe that women’s quits are significantly more sensitive to wages than that of men’s. This confirms Manning’s findings that “now the female elasticity is larger than the male in three of the data sets and the gap is actually significant.”
Evidently, this evidence appears to go against the theory of monopsonistic discrimination as an explanation of the gender wage gap. However, this exercise fails to distinguish between the parts of the wage that are specific to the establishment and the parts
of the wage, like human capital, that also influence the outside option of the workers. Thus, following the description of Section 4, we now proceed by reporting results using the establishments wage policy, measured by the establishment specific wage premium relative to workers’ alternative wages, in the turnover regressions. Tables 2 and 3 reports the impact of the establishment specific wage premium on our two measures of quit rates: log separation rate and log excess turnover rate, respectively. According to Equation 9) this yields directly empirical evidence on the elasticity of labour supply with respect to wages.
[ Table 2 around here ] [ Table 3 around here ]
As before, we split our sample of establishments into four categories depending on the workforce’s level of education (low or high education) and gender, and run separately for each group, weighted least squares log quit regressions (WLS) on the establishment-specific wage premium and controls for workforce average years of education (and squared), proportion of workforce’s fields of educational qualification (we differentiate between 8 categories which basically expresses occupational categories), industry, and county. The models of Tables 2 and 3 are comparable to the models of Table 1. Models 1-4 of Table 4 repeat the analyses for low educated workers employed by establishments in the Manufacturing Statistics only.
Changing the focus from establishment average wages to establishment wage premium has a major impact on our conclusions regarding gender differences in the elasticity of labour supply. Regardless of how we measure quits and regardless of level of educational attainment, men’s turnover is more sensitive to wages than women’s turnover. While this difference is not significant when estimated for high educated workers and using separations as turnover measure, it is strongly significant for all groups using excess turnover as our
measure. Since individual productivity differences are controlled for, our results are not caused by gender differences in human capital.
Since wages are set by profit maximizing employers, the wage premium may be considered endogenous. In the regressions of Table 4, we take this into account by introdu-cing instruments for the wage premium. Unfortunately, our analyses are in this case limited to workplaces included in the Statistics Norway’s Manufacturing Statistics and then for low-educated workers only.18
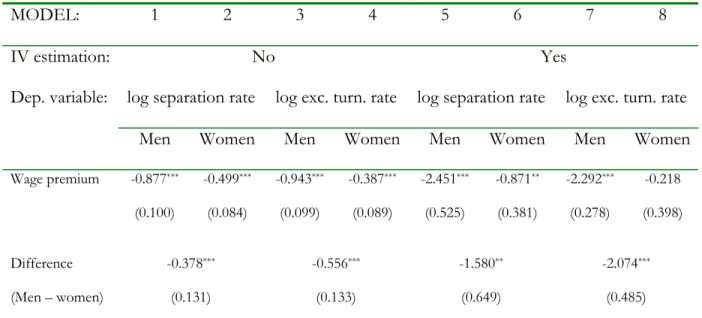
Table 4 presents four sets of the result. Models 1-2 and 3-4 of Table 4 present the WLS results for the separation rate and the excess turnover rate, respectively, on this sample for comparison. Compared to Tables 2 and 3 we see that focusing on these establishments employing low-educated workforces implies more wage-sensitive turnover for men and less wage-sensitive turnover for women. Models 5-6 and 7-8 of Table 4 then present the similar regressions using weighted IV-regressions. We use log capital related to machinery and inventory and capital related to buildings (in millions) as instruments, since there is a rich literature arguing and identifying that more capital intensive firms pay higher wages.19 Due to
18 Information on our instruments is limited to workplaces participating in Statistics Norway’s Manufacturing Statistics. This comprises mainly the manufacturing industries, but also mining, construction, service and trade workplaces are found. However, the number of establishments in our sample with a sufficient number of high educated workers of each gender moving between establishments in our panel is too small to identify effects for the high educated workers.
19 Within the equilibrium search framework this relationship is for example described by Robin and Roux (2002). Note that we have estimated our models using log capital related to machinery and inventory, capital related to machinery and inventory (in millions), log capital related to buildings and capital related to buildings (in millions) as instruments. The first stage of these regressions reveal that capital related to machinery and inventory (in millions) and log capital related to buildings are highly insignificant (P-values around 0.9) in the
the quasi-fixed nature of capital, these capital measures may be considered appropriate instruments for wages. As seen in Table 4 our instruments are strong and they also satisfy the Sargan-test.
When we instrument the wage premiums using these instruments, Models 5-8, our results are even stronger, i.e. men’s turnover turns even more wage sensitive. This is true regardless of turnover measure. For the low-educated workers, men’s turnover is quite simply more wage sensitive than women’s turnover.
[ Table 4 around here ]
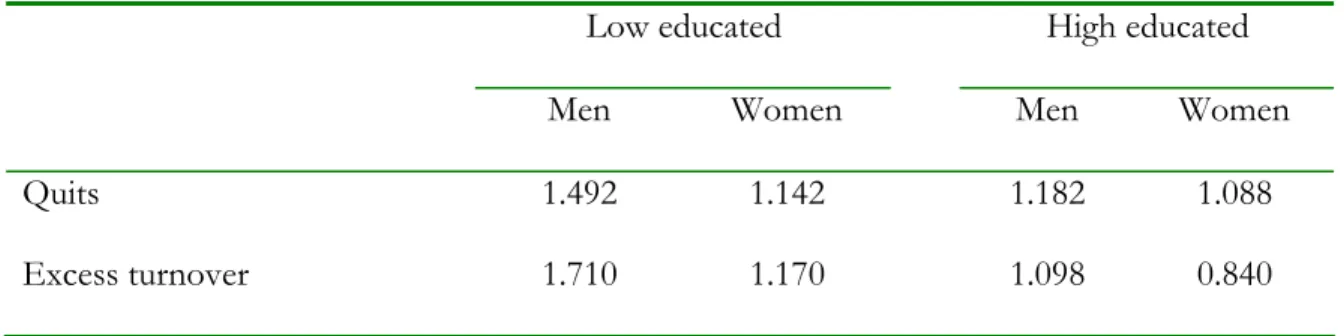
What do our results imply regarding the elasticity of labour supply facing each establishment? In Table 5 we have calculated the elasticity for our four groups of workers using the estimated parameters of tables 2 and 3. For men the elasticity of labour supply is always over 1, while the elasticity of labour supply for women is strictly below 1 regardless of educational group or turnover measure. Our preferred estimates are those based on the excess turnover regression parameters. We find, quite surprisingly, that the elasticity of labour supply is larger for the low-educated workers than for the high-educated workers.
[ Table 5 around here ]
Finally, note that we have been conservative when evaluating the potential importance of monopsonistic discrimination, since the average elasticities of Table 5 are based on non-IV estimation. At least for the low educated employed in the manufacturing
first-stage regressions and the inclusion of these as instruments in the regressions for women yield test results implying weak instruments (F-test of the excluded instruments yield F-values around 5-6). The second stage results still imply significantly higher turnover elasticity of men than that of women. However, to avoid weak instruments we exclude capital related to machinery and inventory (in millions) and log capital related to buildings from our final regressions.
sector, IV-estimation implies larger gender elasticity differences, thus increasing the potential importance of monopsonistic discrimination.
7. Workforce composition and the employers’ wage policy
According to our theory of monopsonistic discrimination average establishment wages should be related to the employment of men and women. Log establishment wages, averaged across men and women, can be expressed, using the log-transform of Equation 4), as:
10) , ln ln ln ln ln ln ln ln f m k m f k f m f k f k f m f m f k f k f m f k f m f k f m f m f f K p L L L w w w w L L L w L L L w ⎥ ⎥ ⎦ ⎤ ⎢ ⎢ ⎣ ⎡ ⎟⎟ ⎠ ⎞ ⎜⎜ ⎝ ⎛ − − = + ⎥ ⎥ ⎦ ⎤ ⎢ ⎢ ⎣ ⎡ ⎟ ⎟ ⎠ ⎞ ⎜ ⎜ ⎝ ⎛ − = + + + = ω ω ω
where p, ω and L denote the marginal revenue product, the mark-up on wages and the labour supply facing an establishment, respectively, and subscripts f, m and k denote establishments, men and women. For simplicity, we denote the proportion of women in establishment f as Kf. We note that if the marginal revenue product is equal for men and women, then a lower mark-up for men than for women (i.e., more elastic labour smark-upply for men than for women), implies that average wages diminish as Kf increases.
To test this proposition we have estimated 5 regressions of average log wage at the establishment and the wage premiums on the proportion of women in the establishment. Table 6 presents the results from these regressions.
In all the regressions our results are clear and very robust: as the establishments become more dominated by women, the wage or the wage premium drops. This is true whether we control for county and industry, include a second order term (proportion of women squared), or if the proportion of women in the establishments are instrumented (since one may argue it is endogenous). If the proportion of women is instrumented, as in Model 5, our results are only enforced.
While we anticipated a negative relationship between wages and the proportion of women in the establishment, the estimated magnitude is quite unexpected. Using the estimated average elasticities of Table 5 to calculate -ln(ωk/ωm) we find values between -0.037
and -0.136, while the estimated coefficients in the last two models of table 6 is around -0.40. This discrepancy suggests that up to one third of the effect of the share of women at the establishment on wages may be attributed to monopsonistic discrimination. The remaining two third may be explained either from differences in productivity between men and women within the establishment, or as a result of gender segregation across establishments in such a way that men more often work in the more productive firms. The last explanation is consistent with the distribution of men and women across establishments that would arise from more wage elastic job-to-job moves on part of men.
8. The gender wage gap and labour market frictions
In this section we finally turn to the gender wage gap and ask how much of this gap can be related to frictions and thus potentially monopsonistic discrimination. In Table 7 we report from an estimation of log hourly wages from the pooled Level of Living Surveys 1991 and 1995. We have, for each educational group, estimated separately a simple log wage human capital regression model including years of education, potential experience and its squared
value, a part time dummy, and a dummy for women. This provides us with a measure of the “observed” gender wage gap in the Norwegian labour market.
[ Table 7 around here ]
For low educated workers, the “observed” wage gap estimated by the coefficient for the gender dummy is -0.160.For high educated workers, the gender wage gap is -0.191.
The next two lines of Table 7 then presents the gender wage gap as it is implied by our estimated elasticities (using Equation 4) and thus implicitly assuming that each labour input has the same marginal revenue product). In all cases women clearly earn less than men. For low-educated workers it varies between 11 and 14.5 percent, while for high low-educated workers it varies between close to 4 and close to 13 percent. This implies that between 70 and 90 percent of the gender wage gap for the low-educated workers may be attributed to labour market frictions, while frictions may explain between 20 and 70 percent of the gender wage gap for the high-educated workers.20 From this we can safely conclude that labour market frictions may
potentially be an important source of the gender wage differentials in Norway.
9. Concluding remarks
Monopsonistic discrimination was refuted as an explanation of the male-female wage gap mainly because female labour supply has been found to be at least as wage-elastic as male
20If one allows the marginal revenue product to vary between men and women, Equation 5) can be expressed
as ) 1 ( 1 + − ⎥ ⎦ ⎤ ⎢ ⎣ ⎡ + ⎥ ⎦ ⎤ ⎢ ⎣ ⎡ − = − k m m k m k k m m k m m k p p p p w w w ε ε ε ε ε ε
. The observed wage differential between men and women may then be completely explained by the model, assuming that the marginal revenue product of men is 2-6 percent (low educated) and 7-15 percent (high educated) higher than that of women.
labour supply. A recent study by Gelber (2008) confirms this finding utilizing IV methods and family responses to the Swedish 1991 tax reform. He finds that women’s labour supply is more responsive to changes in the marginal tax rate than men’s. How do we reconcile our findings of a less wage elastic labour supply facing each establishment with these observations?
As pointed out by Manning (2003) the elasticity of labour supply facing each establishment is composed of two parts: one part arising from the effects on aggregate labour supply and the other part arising from the effects on turnover associated with job-to-job transitions in the competition between employers. When competition between employers is less than perfect, each establishment may experience an upward sloping labour supply curve. The part arising from competition between employers may well dominate the part arising from effects on labour supply. Together with the previously reported results on aggregate supply, our results thus strongly indicate that the wage elasticity of job-to-job transitions of women is considerably smaller than that of men. In fact the difference in wage elasticity of job-to-job transitions has to be larger in absolute value than the difference in wage elasticity of aggregate labour supply, since in sum they add up to a negative number.
On average, women tend to have at least as high turnover as men. An insightful tradition arose from observations of this fact: Building on Mincer and Polachek (1974) and Polachek (1975) a host of work has demonstrated the importance of differences in turnover for differences in investment in human capital, and used this mechanism to explain gender differences in labour market outcomes. Our observation does not run counter to this mechanism. Quite on the contrary, we demonstrate that the endogenous part of women’s turnover; that which is sensitive to the firm’s wage policy, is small. This means that the exogenous part of women’s turnover is relatively larger, compared to men’s turnover
behaviour. Gender differences in labour market outcomes may thus arise from both dimensions of turnover: less wage sensitivity provides employers with incentives for monopsonistic discrimination and more exogenous quits provides both employers and employees with fewer incentives for human capital accumulation and the provision of career opportunities.
It is a well known fact that during the recent decades, gender wage differences did not arise as a result of differences in wages between men and women in the same detailed job category within the same establishment (see for example Meyersson-Milgrom et al., 2001). However, gender segregation across jobs and establishments implies gender based differences in the elasticity of labour supply facing each establishment across jobs and occupations. These differences may explain the fact that female dominated jobs and occupations pay less, and that female dominated occupations tend to have flatter wage profiles. Even if employers do not apply a policy of monopsonistic discrimination towards women as individuals or a group, the level of segregation in the labour market ensures that the same mechanisms may be at work, but rather at the level of jobs and occupations.
This study does not try to sort out potential reasons for the differences in job-offer arrivals or exogenous separations between the sexes that may underlie the differences in the elasticity of labour supply21 Thus most of the usual explanations are still relevant (see
Manning, 2003:200-204), such as potential gender differences in time constraints or in the
21 In addition to potential differences between male versus female search behaviour, the theoretical analysis of Bowlus and Eckstein (2002) shows that even if only a fraction of employers have discriminating tastes in employment, there will be effects in the whole labour market via differences in job-arrival rates between groups.
evaluation of non-pecuniary versus pecuniary aspects of a job. Allowing for endogenous search intensities for both employer and employees is also likely to highlight self-enforcing mechanisms that may add to the explanation of the magnitude of the differences between men and women.
Although Norway is known for gender equalising policies, for example with respect to public child-care, women still have the main domestic responsibility for children. Thus when Manning finds that family commitment prevent both job search and taking jobs to a higher degree for women than men in the UK (Manning, 2003:Table 7.2 on p.201), this should be valid for Norway as well. Since the public child-care is geographically linked within the home municipality, and there exists an excess demand for public day-care, job lock-in issues may arise at important stages of the career for women.
Our main empirical result is that excess turnover of workers in the establishments is significantly more sensitive to the wage premium of men than to that of women, which again implies a higher elasticity of labour supply facing each establishment for men than for women. This difference provides employers with an incentive to employ the policy of monopsonistic discrimination. Even if employers cannot discriminate between men and women within the same jobs, a practice which is illegal in most countries, they may differentiate their wage policy towards different types of jobs or occupations with different gender compositions. Our results show that as much as 70-90 percent of the gender wage gap for low-educated workers may be attributed to differences in labour market frictions between men and women, while the similar figures for high-educated workers ranges from 20 to 70 percent. Search frictions may thus be one of the major sources of gender wage inequality.
References
Albæk, Karsten, and Sørensen, Bent S. (1998). “Worker Flows and Job Flows in Danish Manufacturing, 1980-91”, Economic Journal, 108:1750-1771.
Bhaskar, V. and To, Ted (1999). “Minimum wages for Ronald McDonald Monopsonies: A Theory of Monopsonistic competition.” Economic Journal, 109: 190 – 203.
Bhaskar, V., Manning, Alan, and To, Ted (2002). “Oligopsony and Monopsonistic Competition in the Labor Market.” Journal of Economic Perspectives, 16: 155 – 174. Black, D. (1995). “Discrimination in an Equilibrium Search Model.” Journal of Labor
Economics, 13: 309 – 334.
Blau, Francine D., and Kahn, Lawrence M.(1981). “Race and sex Differences in Quits by Young Workers”, Industrial and Labor Relations Review, 34: 563-77.
Blau, Francine D., Ferber, Marianne A. and Winkler, Anne E. (1998). The Economics of Women, Men and Work. Upper Saddle River, NJ: Prentice Hall.
Boal, William M. and Michael R. Ransom (1997), “Monopsony in the Labor Market' Journal of Economic Literature, 35: 86-112.
Booton, Lavonne and Lane, Julia (1985). “Hospital Market Structure and the Return to Nursing Education”, Journal of Human Resources, 20: 184-96.
Bowlus, Audra J. (1997). “A Search Interpretation of Male-Female Wage Differentials”,
Journal of Labor Economics, 15: 625-657.
Bowlus, Audra J., and Eckstein, Zvi (2002). “Discrimination and Skill Differences in an Equilibrium Search Model.” International Economic Review, 43: 1309-1345.
Bratsberg, Bernt, Ragan, James F. and Warren, John T. (2003). “Negative Returns to Seniority. New Evidence in Academic Markets.” Industrial and Labor Relations Review, 56: 306-323
Burdett, Kenneth, and Mortensen, Dale (1998). “Equilibrium Wage Differentials and Employer Size”, International Economic Review, 39: 257-73.
Burdett, Kenneth, and Vishwanath, Tara (1988). “Balanced Matching and Labor Market Equilibrium”, Journal of Political Economy, 96: 1048-65.
Burgess, Simon; Lane, Julia; and Stevens, David (2000). “Job Flows, Worker Flows, and Churning.” Journal of Labor Economics, 18: 473-502.
Ferber, Marianne, Loeb, Jane, and Lowry, Helen (1978). “The Economic Status of Women Faculty: A Reappraisal,” Journal of Human Resources, 13: 385-401.
Galizzi, Monica (2001). “Gender and Labor Attachment: Do Within-Firms’ Relative Wages Matter?” Industrial Relations, 40: 591 – 619.
Gelber, Alexander (2008). “Taxation and Family Labour Supply.” Harvard University [not yet a working paper, quote yet to be confirmed with the authour]
Green, Francis, Machin, Stephen and Manning, Alan (1996). The Employer Size-Wage Effect: Can Dynamic Monopsony Provide and Explanation?”, Oxford Economic Papers,
48: 433-455.
Humphries, Jane (1995). “Economics, Gender and Equal Opportunities”. In The Economics of Equal Opportunities edited by Jane Humphries and Jill Rubury. Manchester: Equal Opportunities Commission.
Keith, Kristen, and McWilliams, Abagail (1999). “The Returns to Mobility and Job Search by Gender”, Industrial and Labor Relations Review, 52: 463-474.
Loprest, Pamela J. (1993). “Gender Differences in Wage Growth and Job Mobility”,
American Economic Review, 82: 526-532.
Lucifora, Claudio, and Reilly, Barry (1990). “Wage Discrimination and Female Occupational Intensity”, Labour, 4: 147-68.
Manning, Alan (1996). “The Equal Pay Act as an Experiment to Test Theories of the Labour Market”, Economica, 63: 191-212.
Manning, Alan (2003). Monopsony in Motion. Imperfect competition in labor markets. New Jersey: Princeton University Press.
Madden, Janice F. (1973). The Economics of Sex Discrimination. Lexington MA: Lexington Books. Meyerson-Milgrom, Eva M., Pettersen, Trond and Snartland, Vemund (2001). “Equal Pay
for Equal Work? Evidence from Sweden and a Comparison with Norway and the U.S.” Scandinavian Journal of Economics, 103: 559 – 583.
Mincer, J. and S. Polacheck (1974). “Family Investments in Human Capital: Earnings of Women.” Journal of Political Economy 32(2, Part II): S76-S108.
OECD (1998). “Women’s Activity, Employment and Earnings: A Review of Recent Developments”. Employment Outlook, (Ch.5):129 – 72.
Pissarides, Christopher A. and Wadsworth, Jonathan (1994). “On-the-job search, Some empirical evidence from Britain”, European Economic Review, 38: 385-401.
Polachek, S. (1975). “Differences in Expected Post-School Investment as a Determinant of Market Wage Differentials.” International Economic Review, 16(2): 451-470
Ransom, Michael R. (1993). “Seniority and Monopsony in the Academic Labour Market”,
American Economic Review, 83: 221-33.
Robin, Jean Marc and Roux, Sebastien (2002). “Random or Balanced Matching. An Equilibrium Search Model with Endogenous Capital and Two-sided Search.” Annales d’Économie et de Statistique, 67-68 (July-December 2002): 257- 307.
Robinson, Joan (1933). The Economics of Imperfect Competition. London: Macmillan. Sicherman, Nachum (1996). “Gender Differences in Departures from a Large Firm”,
Viscusi, W. Kip (1979). “Sex Differences in Worker Quitting”, The Review of Economics and Statistics, 62: 388-398.
Winter-Ebmer, Rudolf (1995). “Sex discrimination and competition in product and labour markets”, Applied Economics, 27: 849-857.
Table 1 The elasticity of worker separation with respect to wages. Dependent variable: log separation rate.
MODEL: 1 2 3 4 5 6 7 8
Population: All establishments
Low educated High educated
M W M W M W M W Average wage -0.812*** -0.743*** -0.872*** -0.836*** -0.534*** -0.780*** -0.574*** -0.862*** (0.032) (0.028) (0.033) (0.029) (0.043) (0.038) (0.046) (0.044) Difference -0.069 -0.036 0.246*** 0.288*** (Men – women) (0.043) (0.044) (0.057) (0.064) Controls:
County, industry Yes Yes Yes Yes Yes Yes Yes Yes
Education Yes Yes Yes Yes
N 4709 4267 4709 4267 1867 1971 1867 1971
R2-adj. 0.319 0.335 0.349 0.366 0.264 0.319 0.362 0.353
Note: Column sub-heading M and W express men and women, respectively. Unit of observation is establishments, where each observation expresses average across the period of observation. In the WLS-regressions, each observation is weighted by the number of years the establishment is observed. All regressions also include an intercept. Controls for 2-digit NACE industry and for county are in the form of dummies. Workforce educational qualification is controlled for in the form of variables measuring proportion of workers having educational qualification within 8 specific fields and by variables expressing years of education in excess of compulsory schooling and years of education in excess of compulsory schooling squared. Standard errors reported in parentheses. ***, ** and * denote significant at 1, 5 and 10 percent level, respectively.
Table 2 The elasticity of worker separations with respect to establishments’ wage premiums. Dependent variable: log separation rate.
MODEL: 1 2 3 4 5 6 7 8
Population: All establishments
Low educated High educated
M W M W M W M W Wage premium -0.770*** -0.562*** -0.746*** -0.571*** -0.610*** -0.590*** -0.591*** -0.544*** (0.040) (0.026) (0.040) (0.029) (0.063) (0.040) (0.063) (0.042) Difference -0.208*** -0.175*** -0.020 -0.047 (Men – women) (0.048) (0.049) (0.075) (0.076) Controls:
County, industry Yes Yes Yes Yes Yes Yes Yes Yes
Education Yes Yes Yes Yes
N 4709 4267 4709 4267 1867 1971 1867 1971
R2-adj. 0.285 0.299 0.303 0.321 0.240 0.260 0.339 0.287
Note: Column sub-heading M and W express men and women, respectively. Unit of observation is establishments, where each observation expresses average across the period of observation. In the WLS-regressions, each observation is weighted by the number of years the establishment is observed. All regressions also include an intercept. Controls for 2-digit NACE industry and for county are in the form of dummies. Workforce educational qualification is controlled for in the form of variables measuring proportion of workers having educational qualification within 8 specific fields and by variables expressing years of education in excess of compulsory schooling and years of education in excess of compulsory schooling squared. Standard errors reported in parentheses. ***, ** and * denote significant at 1, 5 and 10 percent level, respectively.
Table 3 The elasticity of worker excess turnover with respect to establishments’ wage premiums. Dependent variable: log excess turnover rate.
MODEL: 1 2 3 4 5 6 7 8
Population: All establishments
Low educated High educated
M W M W M W M W Wage premium -0.868*** -0.579*** -0.855*** -0.585*** -0.548*** -0.425*** -0.549*** -0.420*** (0.043) (0.027) (0.044) (0.027) (0.027) (0.039) (0.060) (0.041) Difference -0.289*** -0.270*** -0.123*** -0.129* (Men – women) (0.050) (0.052) (0.047) (0.073) Controls:
County, industry Yes Yes Yes Yes Yes Yes Yes Yes
Education Yes Yes Yes Yes
N 4709 4267 4709 4237 1867 1971 1867 1971
R2-adj. 0.330 0.413 0.358 0.456 0.330 0.300 0.453 0.332
Note: Column sub-heading M and W express men and women, respectively. Unit of observation is establishments, where each observation expresses average across the period of observation. In the WLS-regressions, each observation is weighted by the number of years the establishment is observed. All regressions also include an intercept. Controls for 2-digit NACE industry and for county are in the form of dummies. Workforce educational qualification is controlled for in the form of variables measuring proportion of workers having educational qualification within 8 specific fields and by variables expressing years of education in excess of compulsory schooling and years of education in excess of compulsory schooling squared. Standard errors reported in parentheses. ***, ** and * denote significant at 1, 5 and 10 percent level, respectively.
Table 4 The elasticity of worker turnover with respect to establishments’ wage premiums. Population: Establishments in the manufacturing statistics, low educated workers
MODEL: 1 2 3 4 5 6 7 8
IV estimation: No Yes
Dep. variable: log separation rate log exc. turn. rate log separation rate log exc. turn. rate Men Women Men Women Men Women Men Women
Wage premium -0.877*** -0.499*** -0.943*** -0.387*** -2.451*** -0.871** -2.292*** -0.218 (0.100) (0.084) (0.099) (0.089) (0.525) (0.381) (0.278) (0.398)
Difference -0.378*** -0.556*** -1.580** -2.074***
(Men – women) (0.131) (0.133) (0.649) (0.485)
+ intercept and controls for county, industry, and education in all regression models.
Strength of instruments:
First step F-value excluded instruments:
25.47 11.26 25.47 11.26
Anderson IV relevance test P-value
0.00 0.00 0.00 0.00
Sargan overidentification test P-value
0.21 0.14 0.18 0.92
N 1206 517 1206 517 1206 517 1206 517
R2-adj. 0.227 0.265 0.248 0.363
Note: The manufacturing statistics cover the manufacturing industries, but also mining, oil, construction and some trade industries. Unit of observation is establishments, where each observation expresses average across the period of observation. In the regressions, each observation is weighted by the number of years the establishment is observed. Controls for 2-digit NACE industry and for county are in the form of dummies. Workforce educational qualification is controlled for in the form of variables measuring proportion of workers having educational qualification within 8 specific fields and by variables expressing years of education in excess of compulsory schooling and years of education in excess of compulsory schooling squared. The instrument vector consists of capital related to buildings (in 1000000Nok) and log capital related to machinery and inventory. Standard errors reported in parentheses. ** denote significant at 5 per cent level.
Table 5 The elasticity of labour supply facing each establishment
Low educated High educated
Men Women Men Women
Quits 1.492 1.142 1.182 1.088
Excess turnover 1.710 1.170 1.098 0.840
Note: Cells express the elasticities of labour supply facing each establishment, which are calculated using the estimates of models 3, 4, 7, and 8 of Table 2 (separations) and Table 3 (excess turnover) for all establishments.
Table 6 The impact of the proportion of women in establishment on the establishments’ wage policy
Average log
observed wage
Establishment’s wage premium
Model 1 Model 2 Model 3 Model 4 Model 5
Ratio of women in establishment -0.7240*** -0.4723*** -0.2233*** -0.3805*** -0.4197***
(0.0084) (0.0103) (0.0522) (0.0145) (0.0175)
Ratio of women in establish. squared -0.2874***
(0.0581)
Control for:
Intercept, education, year Yes Yes Yes Yes Yes
County, industry, sector Yes Yes
R2-adj. 0.4940 0.4878 0.4934 0.6015 0.6009
N 10675 10519 10519 10519 10519
Estimation WLS WLS WLS WLS 2WSLS
Note: Unit of observation is establishment, where each observation is establishment-specific averages. Dependent variable in Model 1 is establishment-specific average of log daily wages. Dependent variable in models 2–5 is establishment-specific total wage premium. In the regression of Model 1 each observation is weighted according the number of observations of each establishment. In the regressions of models 2–5, each observation is weighted by the inverse variance of the wage premium. In Model 5 the ratio of women in establishment is considered endogenous, and is instrumented by the predicted proportion of women in establishment given that the establishment employs workers following the occupational gender distribution in the economy. Education denotes establishment-specific average years of education and dummy for being considered high education. Robust standard errors are reported in parentheses. *** , ** and * denote significant at 1, 5 and 10 per cent level of significance, respectively.
Table 7 The gender wage gap.
Low educated High educated “Observed” wage gap -0.1600 -0.191 Estimated wage gap (quits) -0.1095 -0.0381 Estimated wage gap (excess turnover) -0.1455 -0.1277
Note: Cells express the gender wage gap, i.e., the how much lower wages women receive compared to that of men relative to men’s wages. The “Observed” wage gap follows from an estimation of a standard human capital wage regression using pooled Level of Living Surveys 1991 and 1995 data.The estimated wage gaps are calculated using figures from Table 5.
Table A1 The estimation of establishments’ wage policy: Parameter estimates from the within-individual log wage regressions
Low educated High educated
Men Women Men Women
Seniority-w 0.0079 0.0172 0.0091 0.0129
(0.0002) (0.0003) (0.0002) (0.0003)
Seniority squared-w -0.0002 -0.0005 -0.0003 -0.0004
(6.745E-6) (0.00001) (0.00001) (0.00002)
Experience squared-w -0.0005 -0.0002 -0.0008 -0.0006
(4.443E-6) (6.779E-6) (8.085E-6) (0.00001)
Short part-time (4 – 19 hours) -w -0.8559 -0.5244 -0.8635 -0.5777
(0.0024) (0.0017) (0.0029) (0.0023)
Long part-time (20 – 29 hours) -w -0.3573 -0.2257 -0.2936 -0.2127
(0.0031) (0.0016) (0.0038) (0.0021)
+ transformed year and establishment dummies
Root mean square error 0.2047 0.2939 0.1928 0.2735
Note: The results from OLS-regressions on the within-individual transformed covariates (each covariate subtracted its individual-specific mean), estimated separately for high and low-educated women and men.