Upjohn Press Upjohn Press Collection
1-1-2014
What Does the Minimum Wage Do?
What Does the Minimum Wage Do?
Dale Belman
Michigan State University
Paul J. Wolfson
Tuck School of Business at Dartmouth
Follow this and additional works at: https://research.upjohn.org/up_press
Part of the Income Distribution Commons, and the Labor Economics Commons
Citation Citation
Belman, Dale and Paul J. Wolfson. 2014. What Does the Minimum Wage Do? Kalamazoo, MI: W.E. Upjohn Institute for Employment Research.
What Does the
Minimum Wage Do?
What Does the
Minimum Wage Do?
Dale Belman
Paul J. Wolfson
2014
W.E. Upjohn Institute for Employment Research
Kalamazoo, Michigan
Library of Congress Cataloging-in-Publication Data
Belman, Dale.
What does the minimum wage do? / Dale Belman, Paul J. Wolfson. pages cm
ISBN 978-0-88099-456-9 (pbk. : alk. paper) — ISBN 0-88099-456-8 (pbk. : alk. paper) — ISBN 978-0-88099-457-6 (hardcover : alk. paper) — ISBN 0-88099-457-6 (hardcover : alk. paper)
1. Minimum wage—United States. 2. Working poor—United States. 3. Poverty— United States. 4. Minimum wage. 5. Working poor. 6. Poverty I. Wolfson, Paul J. II. Title.
HD4918.B45 2014 331.2'30973—dc23
2014012215
© 2014
W.E. Upjohn Institute for Employment Research 300 S. Westnedge Avenue
Kalamazoo, Michigan 49007-4686
The facts presented in this study and the observations and viewpoints expressed are the sole responsibility of the authors. They do not necessarily represent positions of the W.E. Upjohn Institute for Employment Research.
Cover design by Alcorn Publication Design. Indexes prepared by Diane Worden. Printed in the United States of America. Printed on recycled paper.
To my family, Sarah, Jesse, and Margie, for whom
my minimum wage has been love and devotion.
–PJW
Thanks to Amy, Livia, and Aaron for their patience
with the demands of the book and occasional lectures
during dinner. Love to each of you.
Contents
Acknowledgments xiii Abbreviations xv 1 Introduction 1Minimum Wage and the Distribution of Hourly Earnings 3 Three Labor Market Models Used in New Minimum Wage Research 10
An Overview of the Book 15
Part 1: Micro
2 Employment 21
Early New Minimum Wage Research 21
The New Minimum Wage Research Since 2000 31
U.S. Studies 32
Other Developed Countries 77
The Timing of the Employment Response 102
Conclusion 107
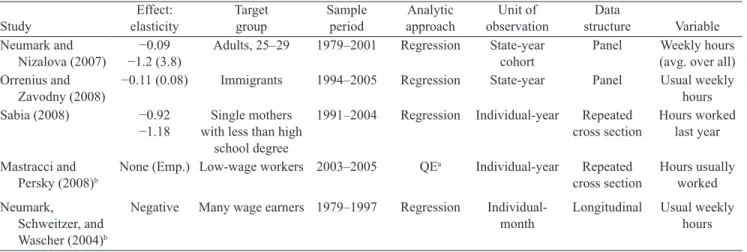
3 Hours of Employment 119
U.S. Studies 120
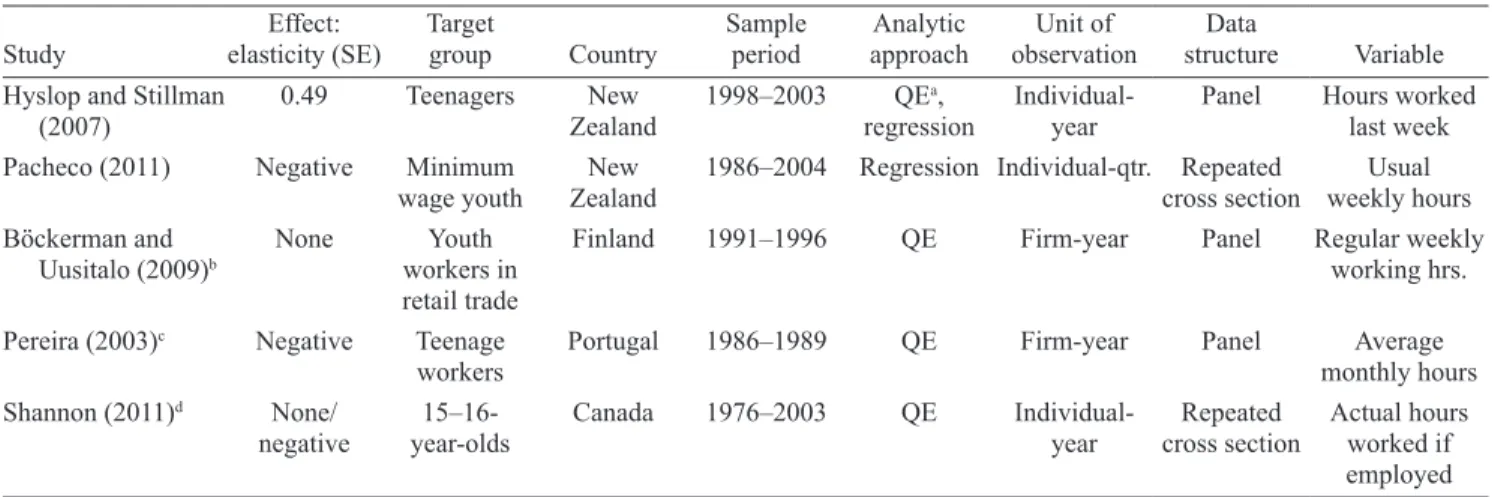
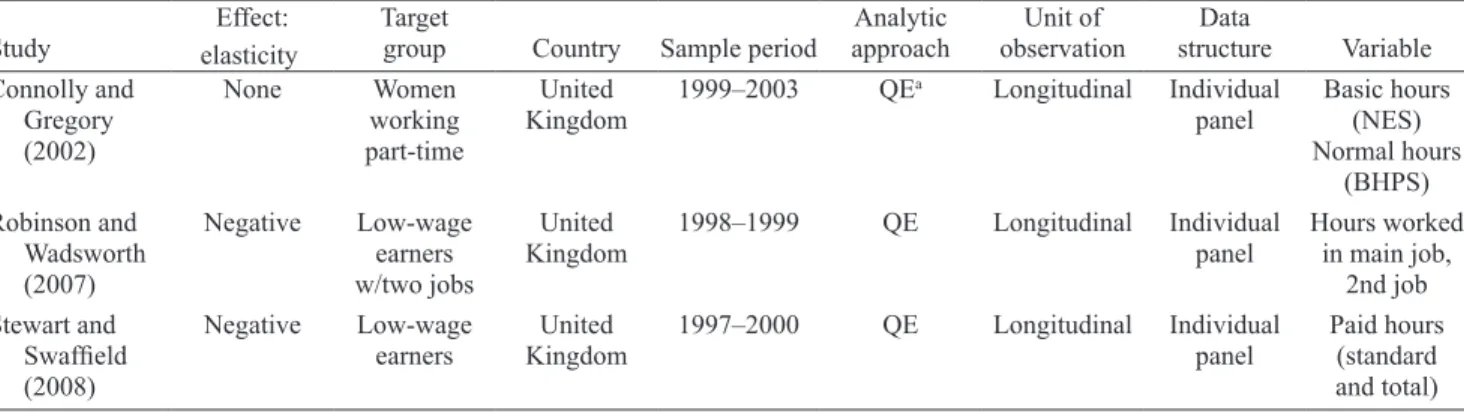
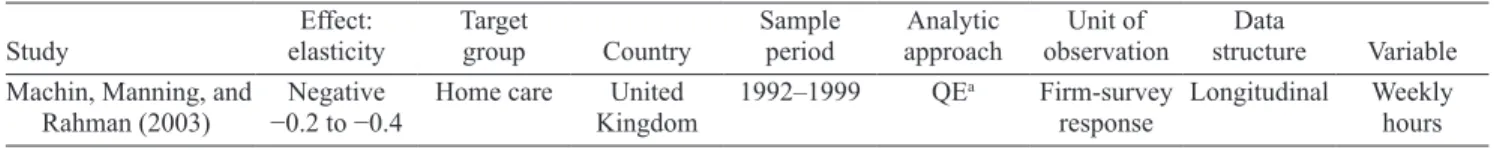
Other Developed Countries 131
Summing Up 141
4 Meta-Analysis 147
A Brief Survey of Recent Prior Work 149
The Data 151
Metaregressions—Part 1 159
Metaregressions—Part 2 165
Conclusion 176
5 Wages and Earnings 183
Measuring the Effects of the Minimum Wage 184
Wage Distribution 186
Sectoral and Industry Studies 211
Workers Who Are Bound by the New Minimum Wage 223
Spillover Effects 236
Conclusion 249
6 Human Capital 259 and Findings and Findings
The Logic of Individual and Firm Investment in Human Capital 260
Human Capital and the Minimum Wage 262
The Effect of the Minimum Wage on School Enrollment: Theory 263 The Minimum Wage and Employer-Supplied Training: Theory 280 TheMinimumWageandEmployer-ProvidedBenefits:HealthCare 288
and Pensions
Summary 294
7 Poverty and Inequality 301
Economic Inequality Minimum Wage?
Inequality and the Distribution of Wages 301 The Effect of the Minimum Wage on Poverty and 308 How Long Do Minimum Wage Earners Continue to Earn the 326
Conclusion 336
Part 2: Macro
8 Gross Flows in the Labor Market 343
Data Issues 345
StudiesofGrossFlowsThatLeanHeavilyonSpecificLabor 348 Market Models
Studies of Gross Flows That Are Agnostic about Labor Market 355 Models
Discussions of Findings on Separations and Accessions 356
9 Labor Force Participation Rate, Unemployment, and Vacancies 365
Labor Force Participation 368
The Unemployment Rate 370
Unemployment Duration 375
Vacancies 377
Conclusion 379
10 The Product Market 383
Prices 384
Output 392
Profitability 392
11 Conclusion 401
A Summary of Our Findings 401
WhatWeKnowwithConfidence 405
Big Ideas 406
Issues of Innovation and Craftsmanship 410
Intended Consequences 411
Appendix A: Data Sources and Variables 413
References 425
Authors 447
Author Index 449
Subject Index 457
About the Institute 471
Figures
1.1 Competitive Labor Market with a Minimum Wage 10 1.2 Monopsony Labor Market with No Minimum Wage 13 1.3 Monopsony Labor Market with a Minimum Wage 13 4.1 Employment and Hours Elasticities vs. Precision 154 4.2 Distinguishing between Reliable and Unreliable Standard Errors: 155
Employment and Hours Elasticities vs. Precision
4.3 Eating and Drinking Places and Youth: Employment and Hours 156 Elasticities vs. Precision
4.4 Distinguishing between Quasi-Experiments and (Other) 157 Regressions: Employment and Hours Elasticities vs. Precision 5.1 Kernel Density Estimate of Hourly Wages 193 5.2 Kernel Density Estimates of the Ratio of Hourly Earnings to the 195
Applicable Minimum Wage
5.3 Kernel Density Estimate of Average Hourly Earnings, 1981 197 5.4 Distribution of Hourly Wages in the United Kingdom, 1998–2004 228 5.5 Increase in Percentile Gross Hourly Earnings Excluding 230
Overtime Minus Increase in the Median, Male Employees (Aged 22 and Over), 1992–2003
5.6 Increase in Percentile Gross Hourly Earnings Excluding 230 Overtime Minus Increase in the Median, Female Employees
(Aged 22 and Over), 1992–2003
5.7 Increase in Percentile Gross Hourly Earnings Excluding 231 Overtime Minus Increase in the Median, Full-Time Employees (Aged 22 and Over), 1992–2003
5.8 Increase in Percentile Gross Hourly Earnings Excluding 231 Overtime Minus Increase in the Median, Part-Time Employees (Aged 22 and Over), 1992–2003
Tables
1.1 The Distribution of Hourly Wages and Hourly Earnings in 2010 5 for Individuals Not Enrolled in High School or College
1.2 How the Minimum Wage Relates to Measures of Income Adequacy 8
2.1 Youth (Panels, U.S. Data) 34
2.2 Youth (Individual-Level Data, U.S. Data) 40 2.3 Youth (Simpler Data Structures, U.S. Data) 48
2.4 Other Groups (U.S. Data) 52
2.5 Restaurants and Hotels (U.S. Data) 62
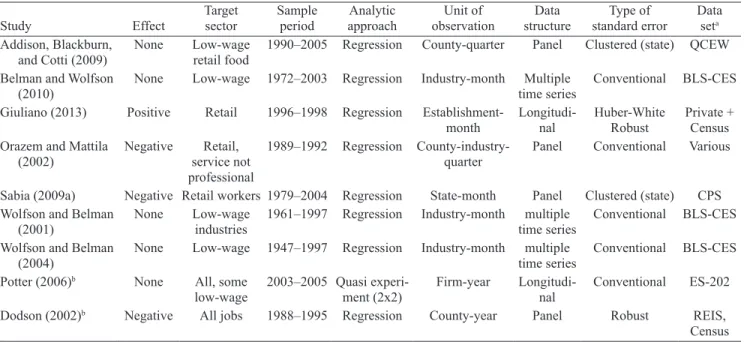
2.6 Other Low-Wage Sectors (U.S. Data) 73
2.7 Youth (Other Developed Countries) 80
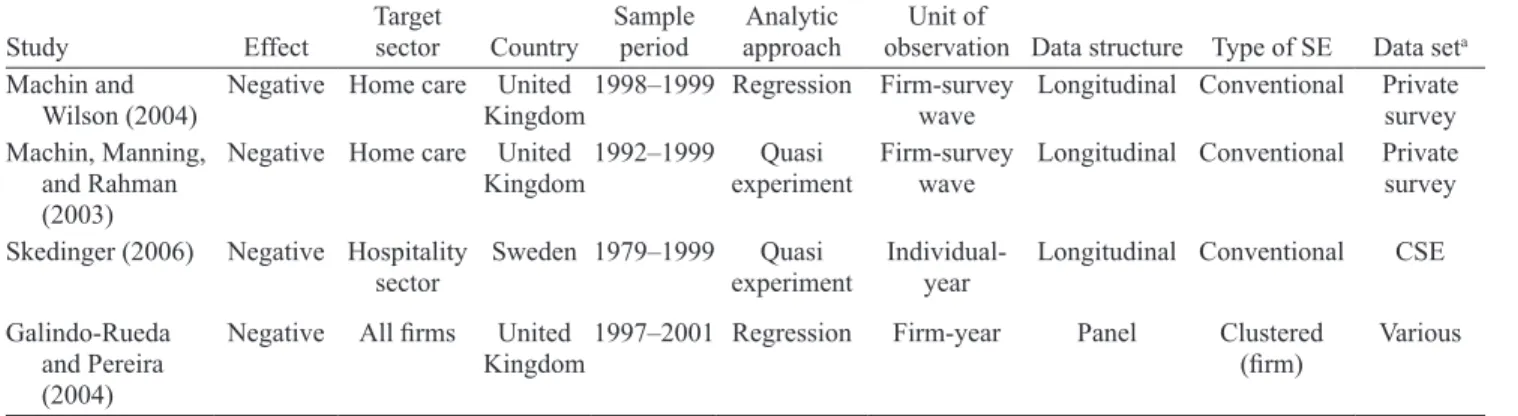
2.8 Other Low-Wage Groups (Other Developed Countries) 94 2.9 Studies of Industries (Other Developed Countries) 100
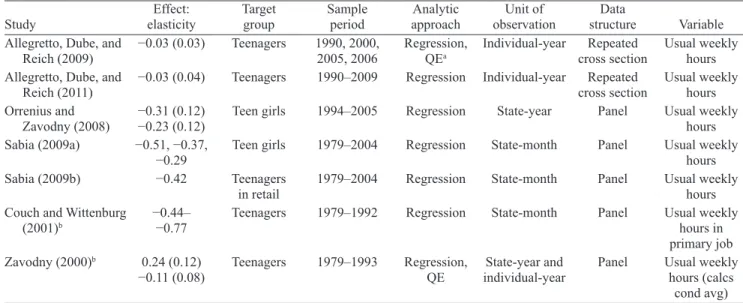
3.1 Youth (U.S. Data) 121
3.2 Other Groups (U.S. Data) 125
3.3 Studies of Industries (U.S. Data) 126
3.4 Youth (Foreign Data) 132
3.5 Other Groups (Foreign Data) 135
3.6 Studies of Industries (Foreign Data) 140 4.1 Studies Included in the Metaregression 152 4.2 Percentage of Observations in the Left and Right Tails 158 4.3 Preliminary Meta-Estimates of the Minimum Wage Elasticity, b1 161 4.4 Meta-Estimates of the Minimum Wage Elasticity of Employment, 164
b1, When a Correction for Publication Bias Is Included
4.5 Meta-Estimates of the Minimum Wage Elasticity of Employment 168 and Hours
4.6 Meta-Estimates of the Minimum Wage Elasticity of Employment 173 and Hours for Models with Controls for Youth and Eating and Drinking Places
4.7 Meta-Estimates of the Minimum Wage Elasticity of Employment 174 and Hours for Models with Controls for Youth and Eating and Drinking Places
5.1 The Distribution of Hourly Wages and Hourly Earnings by Dollar 187 Amount, 2010
5.2 The Distribution of Hourly Wages and Hourly Earnings by 189 Percentile, 2010
5.3 The Distribution of Hourly Wages and Earnings Relative to the 190 Minimum Wage, 2010
5.4 The Effect of the Minimum Wage on Average Wages, Vulnerable 202 Groups: Teens
5.5 The Effect of the Minimum Wage on Average Wages, Vulnerable 206 Groups: Other
5.6 The Effect of the Minimum Wage on Average Wages 209 5.7 The Effect of the Minimum Wage on Average Wages: Restaurants 214 5.8 The Effect of the Minimum Wage on Average Wages: Service 218
Industries
5.9 The Effect of the Minimum Wage on Average Wages: Studies of 221 the United Kingdom
5.10 The Effect of the Minimum Wage on Those Bound by the 224 New Minimum Wage
5.11 The Effects of Minimum Wage Increases in California, 1994–1999 226 5.12 The Effect of the Minimum Wage on Those Bound by the New 233
Minimum Longitudinal Studies
5.13 Spillover Effects: The Effect of the Minimum Wage on Those 240 Earning More but Close to the New Minimum Wage
6.1 Schooling and Human Capital 264
6.2 Firm-Provided Training 284
6.3 TheMinimumWageandBenefits 292
7.1 The Effect of the Minimum Wage on the Distribution of Wages 304 7.2 Poverty Thresholds for 2010 by Size of Family and Number of 311
Related Children under 18 Years ($, 2010)
7.3 Labor Force Status in 2006 by Family Income in 2005 314 7.4 Statistical Studies of the Minimum Wage and Poverty 318 7.5 Simulation Studies of the Minimum Wage and Poverty 322
7.6 Studies of the Minimum Wage and Antipoverty Policies 324 7.7 The Dynamics of Minimum Wage Earners: How Long Do Those 328
Earning the Minimum Wage Remain Close to the Minimum?
7.8 Share of Population in Minimum Wage or Near-Minimum Wage 330 Jobs by Years into Career
7.9 The Dynamics of the Minimum Wage 332
7.10 The Dynamics of Minimum Wage Earners: How Is Wage Growth 335 Affected by Receiving the Minimum Wage?
8.1 Gross Labor Flows 346
8.2 Changes in Teen Shares in Gross Flows in Portugal Following 352 the 1987 Minimum Wage Increase
8.3 Gross Flows for Teens and Adults in Portugal Following the 353 1987 Minimum Wage Increase (%)
8.4 Estimated Elasticities 354
9.1 LaborForceDefinitions 366
9.2 Labor Force Measures 367
9.3 Labor Force Participation Response 369
9.4 Unemployment Rate/Duration 372
9.5 Vacancies 378
10.1 Prices 384
10.2 ProfitabilityandFailureRates 394
Acknowledgments
We wish to express our sincere thanks to Tim Bartik and Kevin Hollenbeck of the Upjohn Institute for Employment Research for their guidance and patience with this long effort. We are particularly indebted to Tim Butcher, chief economist at the UK Low Pay Commission, and Felix Ritchie, professor at the University of the West England, for providing the data needed to repro-duce graphics in their reports. Also, thanks to the participants in the Upjohn Institute seminar in March 2010 on the minimum wage and the Meta-Analysis of Economic Research Network Colloquium in September 2013 for comments and insights. Particular thanks are owed to Kritkorn Nawakitphaitoon, a for-mer gradate student in the School of Human Resources and Labor Relations at Michigan State University, now a professor at Renmin University in Beijing, for assembling the data on the overwhelming number of articles reviewed in this book, and for an almost equal amount that was dropped from the review. And, of course, deepest thanks to Allison Colosky not only for her help in thinking through the book and for working with us on the rewriting and editing of the manuscript, but also for her boundless patience and good humor.
Abbreviations
ACS: American Community Survey
ASHE: Annual Survey of Hours and Earnings BHPS: British Household Panel Survey BLS: Bureau of Labor Statistics
BLS-CES: Bureau of Labor Statistics-Current Establishment Survey CPS: Current Population Survey
CSE: Confederation of Swedish Enterprise CRSP: Center for Research in Security Prices EE: Enrolled and employed
EITC: Earned Income Tax Credit
ENE: Enrolled in school but not employed EOPP: Employment Opportunities Pilot Projects EPAS: Economically Active Population Survey EPI: Economic Policy Institute
FAME: Financial Analysis Made Easy FSI: French Statistical Institute FTE: Full-time equivalent
GPEU:GeographicProfileofEmploymentandUnemployment HLFS: Household Labour Force Survey
IRSs: Impulse response functions IRG: Investment Research Group IRS: Internal Revenue Service IS: Income Survey
LFPR: Labor Force Participation Rate LFS: Labour Force Survey
MCL: Marginal cost of labor MPL: Marginal product of labor MSA: Metropolitan statistical area
NAIRU:Nonacceleratinginflationrateofunemployment NEE: Not enrolled but employed
NENE: Neither enrolled nor employed NES: New Earnings Survey
(continued)
Abbreviations
(continued) NLSY: National Longitudinal Survey of YouthNMW: National Minimum Wage NMWR: New minimum wage research
OECD: Organisation for Economic Co-Operation and Development OLS: Ordinary least squares
ORG: Outgoing Rotation Groups PCC:Partialcorrelationcoefficients
PCSE-PSAR:Panel-correctedstandarderrors,panel-specificAR1 autocorrelation structure
REIS: Regional Economic Information System SIPP: Survey of Income and Program Participation SLID: Survey of Labour and Income Dynamics QCEW: Quarterly Census of Employment and Wages QE: Quasi experiment
QP: Quadros de Pessoal
QWI: Quarterly Workforce Indicators VARs: Vector autoregressions
WERS: Workplace Employment Relations Survey
1
Introduction
The birth of the new minimum wage research (NMWR) can be dated to a conference at Cornell University held in late 1991 and the
subsequent symposium that appeared in Industrial and Labor Relations
Review (see Ehrenberg [1992] for a description of the conference and
its attendees). The first period of this research came to a close nine years later. Prior to the conference, empirical research on the minimum wage had been dominated by studies that considered only the effect of the federal minimum wage on teenage employment, using aggregate time-series data. These earlier studies generally concluded that a 10 percent increase in the minimum wage is associated with a 1–3 percent decrease in teenage employment (Brown 1999). Energized by increases in the federal minimum wage in 1990, 1991, 1996, and 1997, research-ers approached minimum wage issues through a variety of statistical frameworks, techniques, and data sources; explanatory economic mod-els proliferated, as did the number of articles.
Bytheendofthefirstperiodin2000,itwasnolongerpossibleto identify a dominant line of research. In this review, which primarily focuses on articles published from 2000 forward, we have considered more than 200 scholarly and policy papers relating to the minimum wage that have appeared in English since the conference. While a few are surveys, most are original analyses, and most of these are statistical in nature rather than presentations of theoretical models or survey results.
This book is our attempt to make sense of the research.1 We look at
which observable, measurable variables (e.g., wages, employment, schoolenrollment)theminimumwageinfluences;howlongittakesfor the variables to respond to the minimum wage and the size and desir-ability of the effect; why the minimum wage has the results it does (and not others); and the workers most likely to be affected by changes to the minimum wage. Our emphasis is on studies that analyze data from the United States, but we also touch on studies of data from other countries: Canada, Australia, New Zealand, and the United Kingdom and other countries in Western Europe.
2 Belman and Wolfson
One set of issues revolves around who is affected by changes in the minimum wage. It is almost a given that those living in poverty are less likely to be affected than low-wage employees, since those below the poverty line, to a great extent, are not involved in the labor market (Freeman 1996). There remains an issue of who, among those who are employed and those who want to be employed, is affected when the minimum wage is increased. Among the employed, does the minimum wage affect only those who would be earning less than the minimum without it, or does it also affect those higher up the wage scale? Older minimum wage studies have generally focused on teenage workers— with their low skills and limited attachment to the labor market, it was thought that teenagers were most sensitive to the minimum wage and therefore any effect would be clearest here. While much of the NMWR examines what happens to teenagers when the minimum wage rises, many studies focus on other demographic groups with limited skills and labormarket attachment,as wellas workersidentified specifically by theirlowwages,bymembershipinaspecificdemographicgroup(such as single mothers, young women, or immigrants), or by the industry in which they work (primarily hospitality and home care/nursing home).
Another issue relates to identifying the outcomes of minimum wage increases. As with earlier research, most NMWR focuses on the number of jobs or the probability of employment. However, there has been considerable expansion of issues, even within the realm of em-ployment broadlydefined.Wereview studiesofthe consequencesfor hours worked, turnover, unemployment, and labor force participation, along with studies of the effects on wages and their distribution, fringe benefitsandtraining,pricesandprofitability,andtheeffectofthemini -mum wage on school enrollment.
The timing of effects of the minimum wage has become a recog-nized and challenging issue. How long it takes for the response to the minimum wage to play itself out is central to the effectiveness of policy. Before the NMWR, response to the minimum wage was thought to be nearly immediate. Most recent research also assumes that the response is rapid and examines only a short period immediately following an in-crease. Baker, Benjamin, and Stanger (1999), in a look at the Canadian experience with a minimum wage, argue that such assumptions result in missing much of the response, which can take up to six years. Stud-ies of timing require careful attention to dynamics, which is generally
Introduction 3
absent in the NMWR. The few analyses of this issue (including some of our own work, such as Belman and Wolfson [2010]) suggest that the response is not entirely immediate but ends well before six years.
Assessing the size of effects is also important to understand-ing the minimum wage. By and large, the size of the impact of an increase in a minimum wage is related only to the issue of job loss, and the observations are all over the map. For over a decade, the minimum wage elasticity of employment was widely believed to be
between !0.3 and !0.1, with greater faith in values closer to zero.2
This accord no longer exists, with the range of estimates for U.S.
teen-agers extending “from well below !1.0 to well above zero” (Neumark
and Wascher 2007, p. 107). In addition, the issue of the magnitude of the impact is composed of at least two distinct parts: 1) does the wide range of results apply to all outcomes or only to employment, and 2) are patterns in the magnitude of the response related to who is under study, the methods used in the study, measurement issues, or other factors?
Researchers have spent a great deal of effort developing models to explain the results just mentioned, but no agreement yet exists on which, if any, should replace the simple supply and demand model of the labor market that Stigler (1946) expounded. Card and Krueger (1995) de-vote a chapter to various theoretical models before leaning toward one in which employers have market power in the labor market, enabling them, up to a point, to set wages rather than take them as given by the market. They conclude that “this . . . is inconsistent with the proposition
that the standard model is always correct” (p. 383). We take no stand on
which model is most useful, much less settle the question. Rather, we present three general models discussed in the literature—the competi-tive labor market, the monopsony labor market, and search models of the labor market—and show how they relate to the issues at hand. MINIMUM WAGE AND THE DISTRIBUTION OF
HOURLY EARNINGS
As much as the minimum wage is an issue of importance in policy circles, few of those involved in the analysis or debate have had re-cent experience with the minimum wage. Many may have earned the
4 Belman and Wolfson
minimum wage or close to the minimum wage when in high school or college, but that was typically many years ago. To many of those involved in this issue, the minimum wage would seem very low and unlikely to affect many in the labor force.
Contrary to this view, the minimum wage and jobs that pay close to the minimum wage play an important role in the U.S. labor force. Research reviewed in this monograph indicates that changes in the mini-mum wage affect 20–30 percent of the labor force. As such, considering minimum wage policies and their effect is more than a scholastic exer-cise—they may affect a large portion of the labor force. We consider in detail the place in the earnings distribution of the minimum wage itself and near minimum wage earnings in the chapter on wages and earnings, butwebrieflydiscussthisnow.
Table 1.1 provides three views on the importance of the minimum wageinthedistributionofwagesandhourlyearnings.Thefirst,panel A, considers the wages associated with points in the distribution of in-dividual wages in 2010. Panel B displays the percentiles of the wage distribution associatedwith specific hourlywages. PanelC considers the proportion of the employed earning no more than a percentage of the minimum wage in their state. In each panel, the left-hand column of data is for individuals who are paid by the hour, and the right-hand column adds employed salaried workers. The distributions are limited to those who report that they are not enrolled in school. Individuals who report being enrolled in school are fairly evenly distributed across family incomes. By removing this group from our data, we improve the association between being employed near the minimum wage and being from a lower-income household, and thereby improve the association between the minimum wage and economic need.
Panel A displays the association between individuals’ place in the national distribution of wages and the wage they earn. Those at the 5th percentile for wages or hourly earnings are very close to the federal minimum of $7.25 and below the minimum wage for some states. At the 10th percentile, those paid by the hour earn $8.00, 110 percent of the federal minimum wage; for all employees the 10th percentile is $8.50. Twenty percent of wage earners earn $9.25 or less; 20 percent of all employees earn $10.00 or less. Thirty percent of wage earners earn no more than $10.25, $3.00 per hour more than the federal minimum; the 30th percentile for all employees is $12.00. Considering the
distribu-5
Table 1.1 The Distribution of Hourly Wages and Hourly Earnings in 2010 for Individuals Not Enrolled in High School or College
Panel A: Earnings by percentiles Panel B: Percentiles by wage or hourly earnings Wage of those Wage at this Percent of Percent paid hourly at this percentile including Wage ($) or those paid by the below including Percentile percentile ($) salaried workers ($) hourly earnings hour below salaried workers
5th 7.50 7.50 < 7.00 1.2 1.8
10th 8.00 8.50 < 7.51 (minimum wage) 4.7 4.1 20th 9.25 10.00 < 8.00 (1.10% of federal min.) 7.3 6.0 30th 10.25 12.00 < 9.00 (1.25% of federal min.) 16.7 12.5
40th 12.00 14.00 < 10.00 24.7 17.8
50th (median) 13.50 16.34 < 11.00 (150% of federal min.) 34.9 24.9 Panel C: The distribution of hourly wages and earnings relative to the effective minimum wage in 2010
Percent of those paid by the Percent below minimum wage hour below minimum wage including salaried workers
Less than the minimum wage 2.9 3.0
At the minimum wage 5.9 4.8
Less than 110% of the minimum wage 10.7 8.1
Less than 125% of the minimum wage 21.9 15.7 No more than 150% of the minimum wage 36.4 26.0
NOTE: Calculations of average hourly earnings (inclusive of salaried workers) does not include those who report variable hours. SOURCE: Authors’ calculations from the 2010 Outgoing Rotation File of the Current Population Survey.
6 Belman and Wolfson
tion for all employees, the more complete of the two distributions, only 1 in 20 employees works at or very close to the minimum wage, but 1 out of 10 employees who are not also students earn within $1.25 of the minimum wage, and 1 out of 5 employees who are not also students earn within $2.75 of the minimum wage.
Panel B provides a different view of the same data. Here we cal-culate the percentage of our sample who work at or below particular wage levels. For example, 4 percent of all employees (the right-hand data column) work at or below the federal minimum wage (allowing for rounding). Six percent earn no more than 1.1 times the federal mini-mum, 13 percent earn no more than 1.25 times the federal minimum wage, and 1 out of 4 employees work for no more than $11.00 per hour, 1.5 times the federal minimum wage. Research reviewed in this vol-ume suggests that increases in the minimum wage affect the earnings of those in the lower quarter of the earnings distribution; and we might then expect that those earning up to $11 per hour would see their wages rise in response to the minimum wage.
A limitation of Panels A and B is that we compared wages to the federal minimum in a period when many states have minimum wages above the federal minimum wage. In Panel C we calculate the ratio of individuals’ wages and hourly earnings with respect to the higher of
the federal or state minimum wage, often called the effective minimum
wage, and then create a distribution from this ratio. Again, focusing on the more complete distribution, that for all employees (right-hand column), 8 percent of the nonstudent workforce are employed in jobs paying no more than the minimum wage, 8 percent are in jobs paying no more than 1.1 times the minimum wage, 16 percent are paid no more than 1.25 times the effective minimum, and 25 percent are paid no more than 1.5 times the effective minimum. The proportion earn-ing no more than each of the levels above the effective minimum is, of course, substantially higher for those on hourly pay. Again, although the proportion of employees earning exactly the minimum wage is modest, the proportion earning close to the minimum wage comprises a substantial proportion of the labor force. Given evidence that increases in the minimum wage extend to some of those whose earnings are above the new minimum wage, and that the minimum wage is a bench-mark for those earning above the minimum, the minimum wage can
Introduction 7
Another view to consider is the ability of those earning the mini-mum wage to meet their basic needs. To do this, we consider a household with either one or two individuals working full time at the minimum wage, and compare its total earnings to three standards of income ad-equacy: 1) the poverty line, 2) the income limit for qualifying for food stamps, and 3) a basic family budget provided by the Economic Policy Institute (EPI) (Bernstein and Lin 2008). The latter measure updates a budget developed by the Bureau of Labor Statistics, which compiled the costs of essentials such as housing, transportation, food, and like items. We also consider a household with one or two members earning 150 percent of the minimum wage, a point near the upper limit at which wages respond to changes in the minimum wage.
The upper panel of Table 1.2 provides calculations of family in-come with one and two earners who earn either the minimum wage or150 percentofthe minimum wage. Inthe firstrow,the household has either one or two earners working full time, 2000 hours, at the current federal minimum wage. If there is only one earner, the annual earnings for a 2,000-hour work year are $14,500; if two, $29,000. The second row provides annual household income if a household has one or two individuals working full time in positions that pay 150 percent of the minimum wage. In this case, household earnings are $21,750 and $43,500, respectively.
The second, middle panel, considers two common measures of income adequacy, the poverty line and food stamp eligibility, for
fami-lies of between one and four members.4 Poverty thresholds are used to
evaluate the extent of serious economic deprivation in our society and determine eligibility for income maintenance programs. To establish the adequacy of the minimum wage in providing an income that moves households beyond this threshold, we can compare our annual earnings estimates from the upper panel to the poverty threshold for households of various sizes. For example, comparing the 2012 federal poverty threshold to our annual income calculations for households earning exactlythe minimum wage,we findthata single-earner householdis above the poverty line for a single-person household, at the poverty line for a two-person household with no other income, and below the poverty line for a three- or four-person household. With two minimum wage earners, the household income is well above the poverty line for even a four-person family. A household with one member employed
8 Belman and Wolfson
Table 1.2 How the Minimum Wage Relates to Measures of Income Adequacy
Family earnings if family members work 2,000 hours One earner ($) Two earners ($) Earners employed full time at 14,500 29,000
minimum wage
Earners employed at 150% of 21,750 43,500 the federal minimum wage
Measures of income adequacy
Number of family members 1 2 3 4
Federal poverty threshold 10,890 14,710 18,530 22,350 ($, 2011)
Food Stamp eligibility ($) 14,157 19,123 24,089 29,055 Low family budget (2007)
1 adult, 1 adult, 2 2 adults, 2 adults, 2 1 child children 1 child children Utah (rural) ($) 26,089 32,961 33,358 39,125 Utah (Salt Lake City) ($) 31,898 38.769 37,933 43,499 SOURCE: Bernstein and Lin (2008). Food Stamp eligibility guidelines: http://www
.fns.usda.gov/snap/eligibility#income (accessed March 18, 2014). Health and Human Services poverty guidelines: http://aspe.hhs.gov/poverty/11poverty.shtml (accessed March 18, 2014).
full time at 150 percent of the minimum wage comes close to exceeding the poverty line for a family of four, and, with two earners, household income is well in excess of the poverty line for even a family of four.
Food stamp eligibility is a second measure of whether a family is
earning enough to avoid serious economic deprivation.5 A one-member
household whose member earns the minimum wage is only $343 above the income limit for food stamps. Larger households without additional earners are between $4,623 and $14,555 below the limit on food stamp eligibility. Households with the income from two people earning just the minimum wage are slightly below the limit (that is, eligible for food stamps) if they have four members, and above the limit with only three. A household with a single earner who earns 150 percent of the mini-mum wage (at 40 hours per week or 2,000 hours per year) is below the food stamp limit for a household of three or more. The household of
Introduction 9
four is not eligible for food stamps if it has two full-time earners with wages equal to 150 percent of the minimum wage. Just as in the case of the poverty line, full-time earnings at the minimum wage help move a household above the threshold, and earnings of 150 percent of the mini-mum wage on an annual basis substantially improves the likelihood that a household would be above the threshold for food stamps.
An alternative measure is a basic family budget, the income a fam-ily needs to secure safe and decent-yet-modest living standards. The Bureau of Labor Statistics developed the basic family budget as part of a broader set of standard-of-living measures, which were published annually from 1966 to 1979 (the program was discontinued after 1979; see Johnson, Rogers, and Tan [2001]). The basic family budget is the income that a household needs for a nutritionally adequate diet, shelter, clothing, and transportation. The EPI updated this basic budget in 2007. It includes the cost of health insurance, renting shelter at the 40th per-centile of the rental housing distribution in the area, child care, limited necessities, and taxes, but it does not include savings of any type, res-taurant meals, emergency funds, or insurance to cover emergencies. EPI calculates this budget for rural areas and for the metropolitan statistical areas of each state. We use basic family budgets for Utah, the state that has a median income closest to the U.S. median family income. Table 1.2 provides the 2007 basic budgets for rural areas and for Salt Lake City. The budgets are calculated for one- and two-adult households; all households include at least one child.
Households in which the earners only make the minimum wage do not net enough for the basic family budget, even when there are two working adults. The maximum income earned by two adults employed at the minimum wage is $29,000. The minimum income required for the modest but decent basic budget in Utah is $33,358; in Salt Lake City it is $37,933. The result is substantially better if the adults are earning 150 percent of the minimum wage. A single earner is still not able to earnasufficientincometomeetanyofthebasicfamilybudgets,even in rural areas. A two-earner household earns somewhat more than the rural basic family income, and just at the level of a basic family income in Salt Lake City.
In summary, a large proportion of the labor force works at or rela-tively close to the minimum wage. While only about 1 in 20 nonstudent employees work at no more than 110 percent of the minimum wage,
10 Belman and Wolfson
almost 1 in 6 earn no more than 125 percent of the effective minimum wage, and better than 1 in 4 earn no more than 150 percent of the effec-tive minimum. Having a single minimum wage earner does not assure any but the smallest households of incomes above the thresholds for economic deprivation, but having two full-time minimum wage earners moves households above this mark. With two individuals earning 150 percent of the minimum wage, the representative family of four moves into the ranks of those living at a safe and decent standard of living. THREE LABOR MARKET MODELS USED IN NMWR Competitive
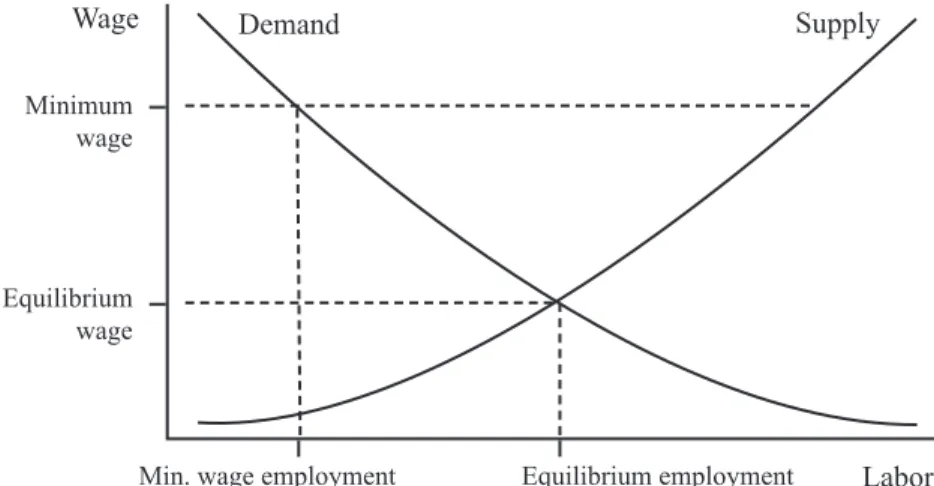
Relying on the simplest and most widely used economic model to analyze the labor market leads to the conclusion that whenever the minimum wage results in higher wages, someone who would have been employed, in the absence of the minimum wage at a wage less than the minimum wage, must instead now be out of work. This is easily seen in Figure 1.1 Competitive Labor Market with a Minimum Wage
Wage Demand Supply
Minimum wage
Equilibrium wage
Introduction 11
Figure 1.1, which shows the demand for labor increasing as the wage decreases, and the supply of labor increasing as the wage increases. In the absence of a minimum wage, their intersection indicates how many
people will be working, indicated by equilibrium employment, and the
wage that they will receive, the equilibrium wage. In this analysis there
aremanyfirms,nonelargeenoughtohaveadetectibleeffectonthela -bor market by itself, and there are many prospective employees, none of whom individually have any effect on the wage or employment. Each firmhires just tothe point where if it employed oneworker moreor fewer,profitswouldbelower.Ifthereisaminimumwagethatexceeds the equilibrium wage,more people willwant jobs,but firmswill not want to employ as many. Both of these facts can be seen where the dashed line indicating the minimum wage intersects the supply and de-mand curves. Because there is no compulsion to hire but there is to pay at least the minimum wage, the wage will be higher, but there will be fewer jobs than in the absence of a minimum wage.
Before moving on to the next model, an explanation is required to explain the derivation of these demand and supply curves and to make the two analyses comparable. The marginal product of labor (MPL) for eachfirmisdefinedastheincreaseintotaloutputthatisassociatedwith
employment of the last, or marginal, worker: MPL(N) = Q(N) !Q(N ! 1),
where Q(N)istheamountofoutputthefirmproduceswhenemploying
N workers. The marginal cost of labor (MCL) is the increase in total
payroll from employing the marginal worker: MCL = W(N) !W(N ! 1),
where W is the total payroll when N workers are employed. Both must
be measured in the same units if they are to be compared, so let both be
measured in money terms (dollars), and let R(N)bethefirm’srevenue
when it employs N workers, net of all costs of production other than
labor (materials, energy, and so forth).
Deriving the industry or aggregate demand curve requires working backward. EachfirmcancalculateitsMPLfor each levelofemploy
-ment, each value of N. The labor demand curve is the horizontal sum
oftheindividualfirmMPLcurves.Thatis,foreachvalueofthewage, wefindthelevelofemploymentforeachfirmthatequatestheMPLto the wage, and add all those values of employment. Doing this for all values of the wage gives the demand curve. The equilibrium wage is the value that equates this sum, total labor demanded, to the corresponding value of the supply curve. The way the market is considered to work is
12 Belman and Wolfson
thatitisalreadyfunctioningwheneachfirmentersthemarket.Thereis alreadyanequilibriumwagethattheenteringfirmcansee,andthefirm knows it must pay that wage if it is to hire any employees. It will hire
employees to the point where the MPL equals the equilibrium wage.6
Becauseeachfirmissmall,andbecauseeachfirm’simpactonthemar -ket is not detectible, its decisions have no effect on the equilibrium wage,andthe firmcanhireasmanyorasfewworkers asitwants at this wage. The equilibrium wage is its MCL; it hires to the point that MPL = MCL = equilibrium wage. A competitive market is at one logi-cal extreme.
Monopsony
Another labor market model is monopsony,inwhichonlyonefirm
is inthe labormarket, appropriatelydefined: only one firmthathires teenagers, for instance. Here, the competitive assumption is replaced by theassumption thatthe singlefirmrecognizesitseffect onwages, and that if it wants to hire an additional worker, it must not only pay a higher wage to attract that one, it must also raise wages for all current employees.
Likethecompetitivefirm,themonopsonisthiresuntilMPL=MCL, butunlikethecompetitivefirm,thewagenecessarytoattractthedesired amount of labor is less than the MCL (because in raising the wage to attract an additional worker it must also raise wages to that level for all current employees), so it pays a lower wage. This is graphed in Figure 1.2. Equilibrium employment here is less than it would be if the monop-sonist did not recognize its effect on wages; if the monopmonop-sonist did not recognize this effect, the equilibrium level of employment would be the same as in the competitive model, where MPL = supply.
Figure 1.3 shows what may happen when a minimum wage is im-posed on a monopsony labor market. Because the employer must pay at least the minimum wage to all its employees, its MCL equals the minimum wage for all levels of employment less than some value (la-beled minimum wage employment). The MCL exceeds the minimum wage only at employment levels higher than this, where a higher wage is necessary to attract that much labor. In Figure 1.3, the relevant MCL schedule is indicated with a solid line, and the one that is relevant only in the absence of a minimum wage is indicated with a dotted line. The
Introduction 13
Figure 1.2 Monopsony Labor Market with No Minimum Wage
Wage Equilibrium wage MPL MCL Supply Equilibrium Labor employment
Figure 1.3 Monopsony Labor Market with a Minimum Wage
Wage Equilibrium wage MPL MCL Supply Minimum wage
Equilibrium Minimum wage Labor employment employment
14 Belman and Wolfson
monopsony firmonce againhires until the further hiring would raise the MCL above the MPL, and this is a higher level of employment than without the minimum wage.
Search Models
While the minimum wage can raise both employment and wages in the case of monopsony, the monopsony model has one important drawback. Evidence that it is relevant to low-wage labor markets where the minimum wage is relevant is scarce on the ground. Except for those living in the most isolated areas, teenagers in the United States typically have more than one fast food establishment in a small neighborhood to canvas for employment opportunities, and often possibilities exist in other sectors as well.
A more plausible but more complicated class of models that gen-erate analytic results similar to those of monopsony is that of search models. The fundamental distinguishing feature is that prospective workers and employerscannot findeach other without some cost,so thatnotallindividuals willingtoworkatwagesthatfirmsarewilling topaycanfindemployment.This isbasedonthe observationthatin -formation is neither free nor perfect, and that individuals must use time and resources to determine who is hiring. Individuals recognize this and must decide on the basis of incomplete information whether it is
worthwhile even to engage in search.7
Two key variables in search models are 1) the contact rate, the probability that someone who is searching for a job will be offered one in any period of time; and 2) the distribution of wage offers. In the competitive model, the contact rate equals one and the offer distribution implies that all offers equal the equilibrium wage. In search models, the contact rate is positive but less than one, and the wage distribution is not necessarily degenerate. Other important parameters include an individual’s cost of searching, typically positive; the rate at which jobs disappearduetolayoffs,firings,andquits;andthe valueofnotbeing employed, for instance, the value of additional schooling, leisure, or unpaid work in the home.
Alongwithotherdetailsofmodelspecification,itispossibletouse these models to analyze not only employment but also unemployment, participation in the labor force, job vacancies, and wage distributions
Introduction 15
withinandamongfirms.Whileitisnotnecessarilythecasethatsearch models of the labor market generate results similar to that seen in Fig-ure 1.3—that is, both higher wages and employment—it is a possibility when the model is appropriately specified. InFlinn (2006) andAhn, Arcidiacono, and Wessels (2011), this is largely because the participa-tion rate responds to the minimum wage, and within a certain range, the greater ease of hiring dominates the greater cost of employment in the responseoffirmstotheminimumwage.
AN OVERVIEW OF THE BOOK
This review includes more than 200 articles on the minimum wage. Most date from 2000 forward but some, on topics that have not re-ceived much attention, date back to the 1980s and 1970s. Chapters areorganizedaroundnarrowlydefinedtopics.Wefocusonmicroand market-specificoutcomesintheearlierchaptersandthenturntobroad -er, macro issues toward the end of the review.
Chapter2,thefirstchapterintheMicrosectionofthebook,consid -ers the research on employment, or more precisely, on the effect of the minimum wage on the number of employees or jobs. Chapter 3 broad-ens the measures of employment in considering research on the effect oftheminimumwageonhoursofwork.Herewefindstrongevidence that the implementation of a minimum wage in the United Kingdom reduced hours of work, but that the evidence for the United States is inconclusive. Chapter 4 presents a meta-analysis of the employment and hours research, providing estimates of the effect of the minimum wagecorrectedforpublicationbiasandarticle-specificeffects,includ -ing specific estimates for young workers and the restaurant industry. Although estimates of the elasticity of employment/hours with respect to the minimum wage vary across estimates, most are either statisti-callynonsignificantoraretoosmallinmagnitudetobeeconomically meaningful.
Starting with Chapter 5, the review considers a broader set of the labor market outcomes. Chapter 5 addresses the effect of the minimum wage on the level and distribution of wages and the provision of fringe benefits.Wefindalmostuniversalagreementthatincreasingthemini
16 Belman and Wolfson
mum wage raises the wages of bound and near-bound workers, and that the effect of the minimum wage is far stronger for women than for men. Chapter 6 considers the effects on human capital formation, including education and employer-provided training. Results on education are sufficiently varied, and sufficiently problematic, topreclude a simple conclusion; the evidence on training is likewise too varied to support a straightforward summary. Chapter 7 looks at the evidence about the im-pact of the minimum wage on wage inequality, poverty, and the length of time individuals remain at low wages. Although the magnitude of the effect remains in play, there is universal agreement that the minimum wage reduces wage inequality, particularly among women. In contrast, the minimum wage appears to have no effect on the poverty status of individuals, possibly because so few of those below the poverty line are employed. Finally, although most employees who earn a wage at or close to the minimum rapidly move to wages considerably above the minimum, a substantial number remain at wages no more than 150 percent of the minimum wage in the initial decade of employment.
Chapters 8 and 9 return to employment-related issues, with Chapter 8lookingatgrossflowsinthelabormarketandChapter9considering the effect ofthe minimum wage onfirms’hiring and layoffbehavior andunemployment. Current researchfinds thatincreases in themini -mum wage reduce both hiring and layoffs almost equally; both labor force participation rates and unemployment appear to increase slightly with increases in the minimum wage. The minimum wage has a dif-ferential effect on unemployment duration, with duration declining for better-educated and rising for less-educated workers. The effect of the minimum wage on product markets is addressed in Chapter 10. Al-though there is too little research to reach any conclusions about the effectsoftheminimumwageonfirmperformanceintheUnitedStates, researchusingdatafromtheUnitedKingdomsuggeststhatprofitability declines with increases in the minimum wage, but this does not lead to anincreaseinfirmsleavingthemarketoradecreaseinshareprices.
Rounding things off, the conclusion attempts the yeoman’s work of summarizing our review, suggesting issues that are in need of fur-ther research, and providing some thoughts on improving the quality of research on the minimum wage. The conclusion is followed by an appen-dix, which discusses data sources and variables and their construction.
Introduction 17
Finally, a brief discussion on our statistical approach is in order. According to one well-known opinion, the function of cavalry in mod-ern warfare is “to give tone to what would otherwise be a mere vulgar brawl!” (Hammerton 2011). It is our hope that this is not the role of statistics in the minimum wage debate. Our approach has been to hold the articles we discuss to reasonable standards. We typically apply a 5
percent p-value in determining whether there is an effect. Given
typi-cal sample sizes used in this research, this standard is a low hurdle. We alsorequirethatspecificationsbereasonably complete—thatthereare no grounds to be skeptical about estimated standard errors. This may
lead to an apparent fetish about p-values, but with the large number of
studies we consider, setting a minimum standard is a necessary screen-ing device.
Different standards and criteria may appeal to readers. Our meta-analysis of the employment and hours studies remedies this otherwise arbitrary, discontinuous, either/or cutoff with a continuous method of weighting estimates based on their estimated standard error. The sum-mary tables in each chapter provide fairly complete information about the studies included in this review. The reader is invited to use these to reach their own conclusions.
Notes
1. More than 600 scholarly and policy papers that mention the minimum wage have been published since 2000. The 200 that we review were selected because they included empirical research on developed countries.
2. An elasticity between -0.3 and -0.1 indicates that a 10 percent increase in the mini-mum wage will reduce employment by 1–3 percent.
3. We use benchmark to mean a guideline for assessing how satisfactory a wage or wage offer is.
4. The column for a one-person household reports only the annual income from
hav-ingasinglepersonemployedattheminimumwagebecauseitisdifficulttohave
more than one earner in a one-person household. The balance of the columns re-port household earnings with both one and two individuals receiving the minimum wage.
5. Although based on both income and assets, we attend only to the income require-ment since that is the only one that the minimum wage directly affects.
6. In the standard analysis, it is assumed both that the MPL is positive in the range of employment considered, and that it gets progressively smaller as N increases.
18 Belman and Wolfson
7. This is most often modeled from the perspective of the individual looking for work. Depending on the issue of interest, it can also be viewed from the
perspec-tiveofthefirm,sothatallfirmswillingtopaywagesthatindividualsarewillingto
acceptcanfindpeopletohireonlywithsomecost.Inthiscase,firmsmustdevote
resources to identifying individuals appropriate to hire and the suitable wage.
Fi-nally,bothperspectivescanbecombined,sothatfirmsandindividualsencounter
Part 1
Micro
2
Employment
Employment,specificallythenumberofjobs,issquareonefordis -putes about the minimum wage and its effects. Support for the mini-mum wage is premised on its improving the lives of those most vulner-able in the labor market. If a minimum wage leads to job loss for many of those same people, serious questions arise with respect to its relative benefits and costs,especially if third parties, such asemployers,also bear some of the costs. The disagreement here is not so much whether the minimum wage ever leads to some loss of jobs but whether it al-ways or usually does. If it does not, then legislation setting a minimum wage is not necessarily a bad idea. The NMWR has yet to come to any widely accepted resolution on this issue, and we will not presume that we can settle the matter here. This chapter presents a comprehensive review of research on the effects of a minimum wage on employment, describing the contributions and mutual criticisms of the best-known early protagonists in the NMWR, followed by a detailed look at more recent research.
EARLY NMWR
The employment effect of the minimum wage is the topic of four of thefive(revised)papersfromtheconferencethatappearedthefollow
-ing year in the Industrial and Labor Relations Review. Among them,
they contained many of the features that were to become common in the NMWR: state-level panels and establishment data rather than national aggregates, quasi experiments in addition to regressions, and ways of gauging minimum wage changes other than the Kaitz index (or similar
measures).1 Neumark and Wascher (1992) draw on the framework of
the earlier aggregate time-series research on teenagers to study a panel of state-year observations. Card (1992a) performs a differences analy-sis of state-level data to examine the response of teenage employment to the federal minimum wage increase in 1990; the minimum wage
22 Belman and Wolfson
variable is the fraction affected, the percentage of a state’s teenage em-ployees who were earning less than the higher minimum wage in the
three quarters before the increase.2 Katz and Krueger (1992) perform a
differences analysis of establishment data to examine the employment response of Texas’s fast food industry to the federal minimum wage in-crease in 1991; the minimum wage variable is a wage gap measure, how much an establishment’s starting wage would have to rise from its value fivemonthsbeforetheincreaseinordertocomplywiththenewmini -mum wage. Card (1992b) uses the 1988 increase in California’s mini-mum wage as an opportunity for a (proto-) difference-in-differences analysis of several employment responses: of teenagers, of the retail sector as a whole, andof one specific partof theretail sector, eating
and drinking establishments.3 OnlyNeumarkandWascher (1992)find
a negative employment response, consistent with the earlier literature. A year and a half later, an exchange between Card, Katz, and Krueger (1994) and Neumark and Wascher (1994) appeared. Card, Katz, and Krueger (1994) criticized aspects of Neumark and Wascher’s (1992) analysis, including the reconciliation with Card (1992a,b) that Neumark and Wascher believe shows that Card’s (1992b) specifica -tion was unable to detect much of the employment response. Card and Krueger (1994), the most well-known and controversial analysis in the NMWR, appeared almost immediately following this exchange. Build-ing on Katz and Krueger (1992) and Card (1992b), Card and Krueger (1994) use the 1992 increase in New Jersey’s minimum wage to con-struct a quasi experiment. The treatment group consists of fast food establishments in New Jersey, and the control group consists of similar establishmentsinnearbyPennsylvaniacounties.Thisgeneratedafinal exchange of criticism (Neumark and Wascher 2000) and response (Card and Krueger 2000). In describing this work in detail, the focus will be onwhat hasturned outto bemost influential:Neumark andWascher (1992), Card and Krueger (1994), and the exchange that each generated. The Conference: Staking Out Positions
Prior to NMWR, studies of the minimum wage and teenage em-ployment in the United States relied on aggregate time-series data or, much less frequently, a cross section of states. Neumark and Wascher (1992) introduce to this literature state-by-year panels based on the CPS
Employment 23
Outgoing Rotation Groups. Analysis of data sets like this became pos-sible because of both advances in computer technology and the avail-ability of data at this level of aggregation, and it was useful because of
the increasing variation in the minimum wage across states.4 The basic
version of Neumark and Wascher’s (1992) empirical model resembles that of the older time-series work. Their outcome variable is the teenage employment ratio, their minimum wage variable is the Kaitz index, and their control variables, reflecting fluctuations in supply and demand,
are drawn from the same short list as in the older literature.5 The panel
structureallows foranobvious extension, two-wayfixedeffects(i.e., dummy variables for each state and year) to account for factors that are roughly constant within each state over time or within each year across states. They present several versions of the basic model to verify robustness of results, and the one that became the most prominent in-cluded not only a contemporaneous term of the minimum wage but also a single (i.e., one-year) lagged term. For this version they report an employmentelasticity(withrespecttotheminimumwage)of−0.19.
The importance of the lagged minimum wage term becomes ap-parent when Neumark and Wascher (1992) reconcile their results with Card’s (1992a,b) report of a “positive contemporaneous correlation be-tweenchanges(thatis,shortfirstdifferences)intheminimumwageand changes in the employment of teenagers” (p. 67). When Neumark and Wascherestimatetheirmodelinfirstdifferences,theytoofindnoem -ployment response to the minimum wage (or a small positive response). Thedifferencebetweenthetwospecifications,oneinfirstdifferences and one in levels with both contemporaneous and lagged minimum wage terms, is that the former can capture only short-term effects of the minimum wage, while the latter can capture longer ones as well. That is,ittakestimefortheminimumwagetoinfluenceteenagers’employ -ment, and specificationsthat do not allowfor this possibility willbe unable to detect it.
Card, Katz, and Krueger (1994) make serious criticisms of Neumark and Wascher (1992), the most important of which concerns the variant
of the Kaitz index that Neumark and Wascher use.6 A major part of the
index is a ratio, of which the numerator is the nominal value of the mini-mum wage and the denominator is the average nominal adult wage. Card, Katz, and Krueger object that this way of measuring the minimum wage leads to the mistaken attribution of effects to the minimum wage when
24 Belman and Wolfson
they are actually due to other factors.7 Card, Katz, and Krueger conclude
by reconsidering Card’s (1992a) examination of the 1990 increase in the federal minimum wage, modifying the analysis in two ways. First, they include a measure of teenage school enrollment. Second, they measure employment change over two years rather than one to capture the same phenomena that the lagged minimum wage term does in Neumark and Wascher’sspecification.Theminimumwagevariableremainsthefrac -tion affected. With only the minimum wage variable on the right-hand side of the equation, its effect on teenage employment is positive and statisticallysignificant.However,oncetheyincludeavariabletocontrol forthebusinesscycle,theestimatedminimumwagecoefficientremains positivebutisnolongerstatisticallysignificant.
Neumark and Wascher (1994) disagree with each criticism that Card, Katz, and Krueger (1994) level at their work and argue that the two-year window that Card, Katz, and Krueger consider in their re-analysisisnotequivalenttothelaggedtermintheirownspecification. We are left neither with agreement between the two parties nor with an obvious way to determine independently who is correct. The dispute has no clear winner. In addition to the question, “Does the minimum wage always reduce employment if it leads to higher wages?” other is-sues that are left unresolved include the appropriate way to measure the minimum wage in addressing this question and the time frame in which employment responds (if indeed it does).
Card and Krueger (1994) and After
Card and Krueger (1994), the best-known article in the NMWR, is the coming-of-age of the quasi experiment in this literature. Like Katz and Krueger (1992), they survey several hundred fast food restaurants, but they do so in two states rather than one: in New Jersey and in several counties of eastern Pennsylvania that are close to New Jersey. Like Katz and Krueger (1992), they perform a differences analysis using a measure of the wage gap, but the best-known part of their study is a difference-in-differences analysis using a treatment dummy. In April 1992, the minimum wage in New Jersey rose from $4.25 to $5.05, while that in Pennsylvania remained constant at $4.25. This allows Card and Krueger todefinetheirtreatmentgroupasfastfoodestablishmentsinNewJersey and their comparison group as the fast food establishments in eastern
Employment 25
Pennsylvania. They also consider a secondary comparison group of New Jersey fast food establishments that were paying at least $5 per hour at thetimeoftheirfirstsurvey,beforethelawwentintoeffect.Withneither comparison group are they able to detect a loss of employment in re-sponse to the minimum wage increase. Nor could they detect any effect when they considered the opening of new McDonald’s establishments rather thanemployment. CardandKreugerfind thatprices didrisein New Jersey more than in Pennsylvania following the increase, but not more in lower-wage New Jersey establishments than in the higher-wage ones that constituted the secondary comparison group (p. 792).
Neumark and Wascher (2000) begin their response to Card and Krueger’s (1994) analysis with a long, detailed critique of the data set that Card and Kreuger constructed. At the center of their argument is an alternative data set that they constructed from historical payroll re-cords for fast food establishments in the same areas and the same chains as Card and Kreuger examined, and that they believe is superior to Card and Krueger’s. It consists of two parts, one of establishments for which they compiled the data, and one of other establishments whose data were given to them independently of their own efforts. Neumark and Wascher assert that a comparison of their data set with Card and Kreuger’s brings to light problems in the latter that cast doubt on the results. Further, when they replicate Card and Krueger’s analysis on their data, they find employment losses in the New Jersey fast food establishments relative to those in Pennsylvania that are about the size one would expect from their earlier analyses of teenage employment. To bolster their case, they next turn to two government data sets for employment in the entire restaurant industry (since neither allows them to examine the fast food sector alone). Based on both a quick examina-tion along quasi experimental lines and a more careful regression analy-sis over a longer period, Neumark and Wascher conclude, “Taken as a whole, it is our view that the BLS data on employment at eating and drinkingplacesneitherconfirmnorrejectourfindingsfromthepayroll data that the New Jersey minimum-wage increase appears to have re-duced fast-food employment in that state. The BLS data do, however, provide complementary evidence that minimum-wage increases reduce employment in the restaurant industry” (pp. 1389–1390).
Neumark and Wascher (2000) explain the differences between their results and Card and Krueger’s (1994):
26 Belman and Wolfson
We think that there is simply considerable measurement error in [Card and Krueger’s] data, attributable to the design of their sur-vey. In contrast, our data should accurately reflect the actual quantity of labor employed at each restaurant in each survey pe-riod. . . . Because the Pennsylvania sample in both data sources is rather small, and much of the difference between the two data sources arises for Pennsylvania, it is entirely possible that random measurement error in Card and Krueger’s data is the culprit. . . . The second possibility is that the measurement error is not random. (p. 1387)
Card and Krueger (2000) respond in several steps. First, addressing the criticisms of the data set that they had constructed themselves, they follow Neumark and Wascher’s (2000) lead and turn to the same BLS data that are gathered to administer the unemployment insurance
pro-gram.8 Using the same type of analysis as in Card and Krueger (1994),
they generate similar results about the employment effects. New
Jer-sey’s 1992 minimum wage increase.9 Second, having constructed a
sample through the middle of 1997 from the government data, they per-form the same analysis for the 1996 increase in the federal minimum wage, which increased the minimum wage for Pennsylvania but not
New Jersey.10 Onceagain,CardandKrueger(2000)findnoevidenceof
employment responding to the minimum wage.
Finally, they turn their attention to the data set at the heart of Neu-mark and Wascher’s (2000) critique. NeuNeu-mark and Wascher clearly feel vulnerable to questions about the two different sources for their data, devoting several pages to showing that, despite concerns about its prov-enance, it is in important ways similar to unquestionably reliable data. Card and Krueger have elsewhere labeled the two parts of the sample as the NW sample and the Berman sample, BNW when combined (Card and Krueger 1999). They detail numerous problems with the samples, the most serious being that the Berman sample, more than 40 percent of the whole, was constructed in part through personal contacts in the industry. As a result, it is not at all a random sample and has all the problems that that entails for statistical analysis. All 23 observations for Pennsylvania in the Berman sample came from a single Burger King franchisee. Neither subsample contains any establishments in Pennsyl-vania affiliatedwith KFC, one of the slower-growing chains in Card and Krueger’s (1994) original sample. In comparing these data with
Employment 27
their own,Card andKrueger (2000)find a strongresemblance in the New Jersey portions, but not in those for Pennsylvania until they re-move the 23 Pennsylvania observations of the Berman sample. They
conclude, “The increase in New Jersey’s minimum wage probably had
no effect on total employment in New Jersey’s fast-food industry, and possibly had a small positive effect . . .” [italics in the original].
The onlydatasetthatindicates asignificantdecline in employ-ment in New Jersey relative to Pennsylvania is the small set of restaurants collected by [Berman]. Results of this data set stand in contrast to our survey data, to the BLS’s payroll data, and to the supplemental data collected by Neumark and Wascher. . . . We suspect the common denominator is that representative samples showstatistically insignificant and small differences in employ-ment growth between New Jersey and eastern Pennsylvania, while the nonrepresentative sample informally collected for Berman pro-duces anomalous results.
An alternative interpretation of the full spectrum of results is that the New Jersey minimum wage increase did not reduce total em-ployment, but it did slightly reduce the average number of hours worked per employee. Neumark and Wascher (1995b) reject this interpretation. Although we are less quick to rule out this possi-bility, we are skeptical about any conclusion concerning average hours worked per employee that relies so heavily on the informally collected Berman/EPI sample, and the exclusion of controls for the length of the reporting interval. Moreover, within New Jersey the BNW data indicate that hours grew more at restaurants in the low-est wage areas of the state, where the minimum-wage increase was morelikelytobeabindingconstraint.Thisfindingrunscounter to the view that total hours declined in response to the New Jersey minimum wage increase. (Card and Krueger 2000, pp. 1419–1420)
In contrast with the exchange following the conference (Card, Katz, and Krueger 1994; Neumark and Wascher 1994), this one leaves the reader feeling confident about the appropriate resolution of the disagreements between the two contending parties. Card and Krueger (1994, 2000) demonstrate that the minimum wage is not necessarily bad for employment, contra Neumark and Wascher (1992, 1994, 2000). Rather than directly defend their original data set, they analyze an al-ternative one drawn from government data about which no serious con-cerns have been raised; the results are similar to their original results.
28 Belman and Wolfson
Finally, they examine Neumark and Wascher’s (2000) BNW data set thoroughly and show that once questionable observations are deleted, it too gives similar results.
The 1990s Studies in Retrospect
The next important developments for this literature (but not ac-tually of or by it) were several methodological pieces that brought to lightstatisticalissuessufficientlyseveretodestroyconfidenceinmost inferences from both lines of research, both the state-year panels of Neumark and Wascher and the simple quasi experiments of Card and Krueger. Rather than explain this in media res, it will be better to start at the beginning. Kloek (1981) and Moulton (1986, 1990) examine situa-tions in which ordinary least squares (OLS) is used on data that can be grouped, and within each group either some regressors have a constant value or it is plausible that the error term is correlated (as with a random effect)orboth.Notonlyarethecoefficientsinefficientlyestimatedbut the estimated standard errors are biased downward. A common solution istoestimatethecoefficientswithOLSandtoclusterobservations by group when estimating the standard errors.
Bertrand, Duflo, and Mullainathan (2004) demonstrate that even where the Moulton problem as conventionally understood is appro-priately addressed, serial correlation remains and results in estimated
standard errors that have a large downward bias.11 They begin with a
50 × 20 (50 states by 20 years) repeat cross section in a difference-in-differences framework, soon switching over to a 50 × 20 panel of ag-gregated data to make clear that the symptoms they are examining are related to serial correlation. Hansen (2007a,b) explores this further in the context of panels and more conventional serial correlation than is typical of the treatment dummy of difference-in-differences analyses. Hansen(2007a,b)andBertrand,Duflo,andMullainathandemonstrate that in the presence of positive serial correlation, the estimated standard errors of key variables are biased downward substantially, leading to fantastically high rates of false positive results. This is true not only for estimates based on conventional formula that take no account of serial correlation but also for several commonly used parametric and nonparametric treatments of serial correlation (Wolfson 2011). Only clusteringandseveralbootstrapproceduresthataccountforunspecified
Figure

Related documents
Random Testing: A minimum annual random selection rate of twenty-five percent (25%) or as permitted by law of the workforce employed on covered jobs shall be tested. Random
More importantly, the effects of sector minimum wages improves the fit of the model for the upper tail by a substantial factor, suggesting the compression on the right hand side of
None of these studies on the Argentine minimum wage though have employed the tools, kernel density distributions and di¤erence-in-di¤erence estimates, advocated in the minimum
Look at each safety point in turn and complete the right hand column to explain how you , as the business operator, ensure the food you produce is safe.. You should also examine
