The British Journal of Developmental Disabilities Vol. 45, Part 2, JULY 1999, No. 89
EXPLORING THE USE OF QUESTION METHODS:
PICTURES DO NOT ALWAYS HELP PEOPLE WITH
LEARNING DISABILITIES
Denise Cardone
Introduction
Since the early 1980’s there has been a growing body of literature looking at how best to obtain meaningful information from people with learning disabilities. Several types of response bias have been identified which contaminate reliability. These in-clude acquiescence (a person answering ‘yes’, regardless of the question) (Sigelman et al., 1981), consistently choosing the last alter-native in a multiple guess (Sigelman et al.,
1983) and giving false information in re-sponse to a leading closed question (Cardone and Dent, 1996).
Although the results of different studies are sometimes contradictory (Cardone, 1995) two premises are generally accepted. First, it is both necessary and desirable to seek the opinions of people with learning disabili-ties about issues that affect them. Second, responses should be checked for their reli-ability. To do this, for example, the same question could be asked using several for-mats and consistency compared, or inter-views could be supplemented by observational data or information from third
*Denise Cardone
Chartered Clinical Psychologist, Community Learning Disabilities Team, Tewkesbury Hospital, Barton Street, Tewkesbury, Glos. GL20 5QN UK. Tel: 0044 (0) 1684 275115 * For Correspondence
party informants (Lowe and de Pavia, 1988; March, 1992; Edgerton, 1984).
Recently, two potentially useful meth-ods for asking questions have been piloted (Dagnan et al., 1994; Dagnan et al., 1995). Both methods allow reliability to be checked and provide quantitative information. The first method, the personal questionnaire, in-volves participants choosing the answers from three printed words, each on a separate card. The second method, the pictorial ana-logue, consists of 2 pictures representing ex-tremes. Participants then indicate their feelings by marking a line between them. The results have shown that many people with learning disabilities were able to use these methods reliably. However, each of the methods had their own strengths and draw-backs. Although the personal questionnaire had an in-built reliability check and was easy to score, participants with higher re-ceptive language tended to be able to use it better than those of lower ability. This ten-dency was not apparent with the pictorial analogue scale: its strength is its accessibility to people with varying degrees of learning disability. However, the pictorial analogue
scale also has its problems. First, there may have been a test-retest bias; since it is given more than once during an interview partici-pants may simply score reliably because they remember their earlier response. Sec-ond, to calculate reliability one has to use sta-tistical methods making this an impractical method for use by clinical professionals in everyday settings.
Aims of the Present Study
As part of a service evaluation project, the aim of the present study was to find a reliable, easy to score method for asking people with various degrees of learning dis-ability. Dagnan’s work (Dagnan et al., 1994; Dagnan et al., 1995) was replicated and ex-tended by using both the personal ques-tionnaire format, and by creating a pictorial version of the personal questionnaire for-mat. It was hypothesised that, unlike the personal questionnaire, the pictorial version of the personal questionnaire would be in-dependent of receptive language ability.
Method
Materials
i) The British Picture Vocabulary Scale (BPVS) (Dunn et al., 1982). This instru-ment measures receptive language ability.
ii) Personal questionnaire (Shapiro, 1961; Dagnan et al., 1994; Dagnan et al., 1995). This response format is individualised according to the question asked. For each question, three cards with words printed on them are created, represent-ing two extremes and a choice in the middle (e.g., ‘Always’, ‘Sometimes’, ‘Never’). These three responses are pre-sented to the interviewee in the three possible paired combinations (Always/
Sometimes, Always/Never, Sometimes/ Never). A four point scale results, or un-reliable responding is detected. For ex-ample, if someone chooses ‘Always; Always; Never’, this is not consistent and therefore not reliable (see Dagnan et al., 1994, for a full explanation of scoring). iii) Pictorial personal questionnaire. This was devised for this study, replacing the words as above with pictures taken from Makaton Symbols (Walker, 1985).
Participants
Twenty-eight people with learning dis-abilities were interviewed. All were receiv-ing a service from the Community Learnreceiv-ing Disabilities teams of the East Gloucestershire NHS Trust and were being seen on an on-going basis for at least the past year. The group consisted of 13 men and 15 women, and had a mean age of 39.54 years (SD = 13.40, range 16-68 years).
The Interview
All interviews took place at the partici-pants’ convenience, either in their homes, colleges or Adult Opportunity Centres. The confidential nature of the interviews was explained with the proviso that the inter-viewer would share any information at the participant’s request. All interviews were tape recorded. Interviews lasted approxi-mately one hour.
Following the protocol of Dagnan et al.
(1994), the interview was semi-structured, covering four broad areas which were ex-plored in an open-ended manner. The first two of these broad areas were replicated from the above study, the second two were not. In each broad area, a structured question was asked, using the pictorial questionnaire and the personal questionnaire response format as follows:
1. Broad area - How the client felt when they saw the service provider.
Structured question: ‘How do you feel when you see (the service provider’s name)?
Response format: Happy, OK, Sad. 2. Broad area - What the clients felt the
ses-sions were for.
Structured question: ‘Does the (service provider’s name) listen to you?
Response format: A lot, Sometimes, Never.
3. Broad area - Whether the client felt the sessions were beneficial.
Structured question: ‘Does (service pro-vider’s name) help you?
Response format: A lot, A little, Not at all.
4. Broad area - How the client felt about the amount of help they were receiving. Structured question: Thinking about the number of times you have seen (service
provider’s name), is it . . .
Response format: Too much, Just right, Too little?
Question and response format were randomised. Midway through the inter-view, the BPVS was administered.
Results
TABLES I and II present the number of people who were unable to respond (did not give an answer), refused to respond (would not choose one of the two cards when presented with a forced-choice), re-sponded reliably, and rere-sponded unreliably to each question, using the personal tionnaire and the pictorial personal ques-tionnaire respectively.
To see if language ability affected reliable responding, the BPVS scores of people who TABLE I
Responses to the Personal Questionnaire
Question No. Unable Refused Reliable Unreliable
1 8 5 12 3
2 8 8 10 2
3 8 8 9 3
4 8 8 9 3
Number of people responsing in each way using the personal question
TABLE II
Responses to the Pictorial Personal Questionnaire
Question No. Unable Refused Reliable Unreliable
1 8 3 14 3
2 8 7 11 2
3 8 7 10 3
4 8 7 11 2
Number of people responsing in each way using the pictorial personal question
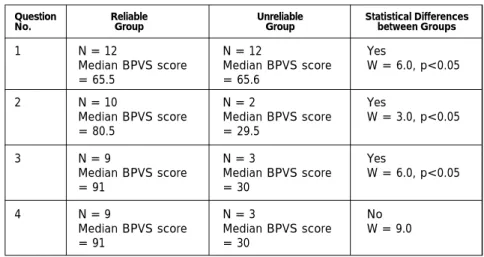
were reliable were compared with the scores of people who were not, for both the personal questionnaire and the pictorial personal questionnaire. Of the people who agreed to complete the BPVS, TABLE III shows the results for the personal question-naire and TABLE IV the results of the picto-rial personal questionnaire. These tables show the number of people who were
reliable and unreliable, also their median BPVS scores, and whether there was a statis-tically significant difference between the BPVS scores of people who were reliable, compared with those who were unreliable, as calculated using a Wilcoxon-Mann-Whitney test WX.
TABLE III
Results from the Personal Questionnaire
Question Reliable Unreliable Statistical Differences
No. Group Group between Groups
1 N = 12 N = 12 Yes
Median BPVS score Median BPVS score W = 6.0, p<0.05
= 65.5 = 65.6
2 N = 10 N = 2 Yes
Median BPVS score Median BPVS score W = 3.0, p<0.05
= 80.5 = 29.5
3 N = 9 N = 3 Yes
Median BPVS score Median BPVS score W = 6.0, p<0.05
= 91 = 30
4 N = 9 N = 3 No
Median BPVS score Median BPVS score W = 9.0
= 91 = 30
TABLE IV
Results from the Pictorial Personal Questionnaire
Question Reliable Unreliable Statistical Differences
No. Group Group between Groups
1 N = 13 N = 3 Yes
Median BPVS score Median BPVS score W = 6.0, p<0.05
= 61 = 29
2 N = 11 N = 2 Yes
Median BPVS score Median BPVS score W = 3.0, p<0.05
= 70 = 29.5
3 N = 9 N = 3 Yes
Median BPVS score Median BPVS score W = 6.0, p<0.05
= 91 = 30
4 N = 11 N = 2 Yes
Median BPVS score Median BPVS score W = 3.0, p<0.05
Discussion
As expected, people with better recep-tive language ability were more reliable us-ing the personal questionnaire than people of lower ability. However, the same trend was apparent using the pictorial version, a finding that was not predicted based on previous research (Dagnan et al., 1994; Dagnan et al., 1995). The present study sug-gests that the use of pictures is not always helpful to people with lower language abil-ity. This may be due to the way in which the pictures were presented; the combina-tion of forced choices inherent in the per-sonal questionnaire format may make responding difficult for this client group. This was reflected in the number of people who refused to answer questions presented in this format, whether pictorial or written. Generally, people who refused to answer were only happy to make 2 of the 3 forced choices which presented their chosen re-sponse. For example, they chose ‘Happy’ twice when presented with the choices ‘Happy/Sad’ and ‘Happy/OK’. However, when presented with the forced choice that did not include their chosen response, e.g. ‘Sad/OK’, they refused to choose, instead verbally saying ‘Happy’. Thus, the demand characteristics inherent in the personal ques-tionnaire may mask reliable responding.
There were also a number of people who were unable to use the personal question-naire format: they simply did not answer. However, they could answer ‘Yes/No’ ques-tions reliably and were able to give non-elaborate information in response to open questions. ‘Yes/No’ questions were asked using a reversal design (Sigelman et al.,
1983). For example, participants were asked “Do you like seeing (service provider’s name)?” and then later in the interview were asked, “Do you dislike seeing (Service provider’s name?). Using this format, participants were generally able to answer
reliably both factual questions and ques-tions which required a preference or opin-ion. Further, they could generally provide factual information to open questions (e.g., “What do you do with (service provider’s name)?”), but had some difficulty express-ing preferences (e.g., “What else would you like to do with (service provider’s name)?”). It is likely that this group of people had low receptive language ability, but this cannot be determined, since they chose not to com-plete the BPVS.
Finally, the majority of participants in this and other studies (Cardone, 1995; Cardone and Dent, 1996) became annoyed by the repetitive asking of the same ques-tions in different formats. Participants often commented, saying things such as ‘I’ve al-ready answered that!’ Although reliability checks are important, future research should take a more qualitative approach, asking questions in ways that make sense to the participants.
Summary
This study evaluated the usefulness of various question formats for assessing con-sumer satisfaction with a community learn-ing disabilities service. Twenty eight people with learning disabilities were interviewed using various question formats, including the forced-choice personal questionnaire method, along with a pictorial version of this method. Contrary to expectation, it was found that many participants had difficulty using the personal questionnaire method, and that supplementing it with pictures did not help. It was suggested that the combi-nation of forced choices inherent in the personal questionnaire made responding difficult for this client group and future research should take a more qualitative approach.
References
Cardone, D. (1995). Interviewing people with a learning disability: A case study. Unpublished doctoral thesis. Birmingham University Psychology Training Course.
Cardone, D. and Dent, H. (1996). Memory and Interrogative Suggestibility: The effects of modality of information presentation and retrieval conditions upon the suggestibility scores of people with learning disabilities. Legal and Criminal Psychology, 1, 165-177.
Dagnan, D., Dennis, S. and Wood, H. (1994). A pilot study of the satisfaction of people with learning disabilities with the services they receive from Community Psychology services. The British Journal of Developmental Disabilities, 40, 38-44.
Dagnan, D. J. and Ruddick, L. (1995). The use of analogue scales and personal questionnaires for interviewing people with learning disabilities. Clinical Psychology Forum, 69, 21-24.
Dunn, L. M., Whetton, E. and Pintilie, D.
(1982). British Picture Vocabulary Scale. Windsor, Berkshire: NFER-Nelson.
Edgerton, R. (1984). The Participant-Observer approach to research in Mental Retardation. American Journal of Mental Deficiency, 88, 498-505.
Lowe, K. and de Pavia, S. (1988). Canvassing the views of people with a mental handicap. The Irish Journal of Psychology, 9, 220-234.
March, P. (1992). Do photographs help adults with severe mental handicap make choices? The British Journal of Mental Subnormality,38, 122-128.
Shapiro, M. B. (1961). A method of measuring psychological changes specific to the individual psychiatric patient. British Journal of Medical Psychology, 34, 151-155.
Sigelman, C. K., Budd, E. C., Spantel, C. L. and Schoenrock, D. J. (1981). When in doubt, say ‘yes’: Acquiescence in interviews with mentally retarded persons. Mental Retardation, 19, 53-58.
Sigelman, C. K., Schoenrock, C. J., Budd, E. C., Winer, J. L., Spantel, C. L., Martin, P. W., Homas, S. and Bensberg, G. J. (1983). Communicating with Mentally Retarded Persons:
Asking questions and getting answers. Lubbock: Texas Technical University.
Walker, M. (1985). Symbols for Makaton. Camberley: MVDP/EARO.