Sourcing or Selling: Value in the
Flame at the Bottom of the Pyramid.
Prof. Robert L. Williams, Jr.,
Assistant Professor of Business and Marketing Brown School of Business and Leadership, Stevenson University,
1525 Greenspring Valley Road, Stevenson, MD 21153-0641
Ph: 443-352-4159; fax 443-352-4191 [email protected]
Dr. Maktoba Omar
Reader in Marketing Strategy Edinburgh Napier University The Business School Craiglockhart Campus Edinburgh EH14 1DJ Phone: +44 (0) 131 455 4404 [email protected] Dr. John Ensor
Head of School of Marketing, Tourism and Languages Edinburgh Napier University
The Business School Craiglockhart Campus Edinburgh EH14 1DJ Phone: +44 (0) 131 455 4385 [email protected] Correspondent address Prof. Robert L. Williams, Jr.,
Assistant Professor of Business and Marketing Brown School of Business and Leadership, Stevenson University,
1525 Greenspring Valley Road, Stevenson, MD 21153-0641
Ph: 443-352-4159; fax 443-352-4191 [email protected]
Sourcing or Selling:
The Value Flame at the Bottom of the Pyramid
Abstract
The significance of emerging economies to global marketing within a context of a paradigm shift of international business is enormous. With more manageable risks, ease of communications, faster transportation, higher income growth and increasing consumer purchasing power, there are new opportunities for multinational corporations to generate profits from not only sourcing lower cost / higher quality products from these areas, but to also increase revenue and global market share by designing and selling offerings to these areas. However, emerging markets do not consist of one market. They are diverse and can require separate market entry and market development strategies. This paper will look at these opportunities through the lenses of two theories: the Bottom of the Pyramid (BOP), and Blue Ocean Strategy (BOS). The value at the Bottom of the Pyramid concept was pioneered by Prahalad, and London & Hart, to identify the potential of emerging markets not only as resource suppliers but as a market to sell into. Blue Ocean Strategy is characterised by untapped market space, demand creation, and possibilities for highly profitable growth, rather than focusing on trying to outperform rivals and increase market share within existing demand. These two concepts will be used to see the potential of shifting paradigms in regards to emerging markets to identify a leap in value for both consumers and producers. The purpose of this paper is to show that emerging markets offer two separate but complimentary areas of opportunity for multinational corporations: to source and to sell in the Value Flame at the Bottom of the Pyramid.
Key words
Value Flame at the Bottom of the Pyramid, emerging markets, VFBOP, Blue Ocean Strategy, Bottom of the Pyramid, market entry.
Introduction
The significance of emerging economies to global marketing within a context of a paradigm shift of international business is enormous. With more manageable risks, ease of communications, faster transportation, higher income growth and increasing consumer purchasing power, there are new opportunities for multinational corporations to generate profits from not only sourcing lower cost/ higher quality products from these areas, but to also increase revenue and global market share by designing and selling offerings to these areas. However, emerging markets do not consist of one market. They are diverse and can require separate market entry and market development strategies. This paper looks at these opportunities through the lenses of two theories: the Bottom of the Pyramid (BOP), and Blue Ocean Strategy (BOS). The value at the Bottom of the Pyramid concept was pioneered by Prahalad (2006), and London & Hart (2004), to identify the potential of emerging markets not only as resource suppliers but as a market to sell into. Blue Ocean Strategy (Kim & Mauborgne, 2005) is characterised by untapped market space, demand creation, and possibilities for highly profitable growth, rather than focusing on trying to outperform rivals and increase market share within existing demand. These two concepts will be used to see the potential of shifting paradigms in regards to emerging markets to identify a leap in value for both consumers and producers. Emerging markets offer two separate but complimentary areas of opportunity for multinational corporations: to source and to sell in the Value Flame at the Bottom of the Pyramid (VFBOP). Literature Review
In the second half of 1997 the Asian financial crisis began. Most of the Asian Tiger economies slowed significantly in 1998; and at that time critics described the economic miracle that happened there over the previous decades as illusory (Harrison et al., 2000, p 191). These countries are clearly ‘developing’ countries, but they do so at a faster rate than many of their peers. East and South-East Asia have produced the most dramatic examples of emerging economies. Hong Kong, Singapore, South Korea and Taiwan followed in Japan’s footsteps, joined by China, Indonesia, Malaysia, and Thailand by the early 1990’s. With new growth and a bounce back from the late 1990’s it looks like the economic miracle is continuing. Another emerging economy area is Latin America; however, the situation here is rather different. Economic gains were made during the 1960’s and the 1970’s based mainly on export revenues from commodities like oil or coffee. Foreign debts - incurred when commodity prices were high - crippled many of these economies when the terms of trade moved against them. Inflation reached 1,000% in Argentina and currencies collapsed. Since the 1980’s, however, there has been a move towards democracy and economic reform, especially in Mexico, Argentina, Chile, Brazil, Uruguay and Peru (Harrison et al., 2000).
The Emerging Economies - Development
No single theory explains why some countries are more developed than others. There are four theories that attempt to explain the different development patterns seen around the world. These are presented by (Harrison et al., 2000, pp 196-9):
The stages of economic development: Rostow’s theory (1960) suggests four
stages for development: the traditional society; the preconditions for take-off into self-sustaining growth; the take-off to drive to maturity; and the age of mass high consumption. The theory has been criticised because it compares
countries at different stages of development without clearly establishing the reasons for their development. It is also based on the experience of developed countries and makes no account for different cultures and political systems.
Dependency theory: The focus here is on the developing countries’ dependence on rich countries. Many developing countries are former colonies which were dependent economically as well as politically. Even after independence, economic ties are difficult to break and this culture of dependence holds development back. The dependency theory recognises two solutions. One is to create policies to alter the balance of power between the rich and poor countries, through bodies such as UNCTAD, or by increasing the representation of developing countries at the United Nations, International Monitory Fund, or the World Bank. The second argues for governmental domestic, political and social interventions to promote or to control economic development.
The neo classical revival: This theory argues that competitive markets, absence of government intervention and the promotion of free trade, are the best way for economic efficiency and growth which will promote privatization, market deregulation and the liberalisation of foreign trade and investment. The theory is the main standpoint for bodies such as the International Monitory Fund, the World Bank and World Trade Organisation. Some countries that have adopted such policies have seen success, for example Chile, Argentina and Peru.
Endogenous growth theory: This is an attempt to explain the importance of internal factors within an economy, which explain why countries develop at different rates. It argues that long-term growth is created by the existence of free market forces and also by investment in infrastructure and in knowledge such as education, research and development, and new technology. This type of development creates economies of scale, making an argument for a combination of market forces and long-term public and private sector investments. This combination should create dynamic forces leading to efficiency, innovation and economic growth.
New Growth / Emerging Markets
It is estimated that over 75% of the expected growth in world trade over the next 20 years will be derived from the 130 developing and newly industrialized countries Prahalad (2006). There are many ways to classify new growth/emerging markets. Rostow (1971) classifies countries by stage of economic development, where each stage is determined by the cost of labor, the technical capability of buyers, scale of operations, level of product sophistication, and interest rates. Countries in the first three stages are economically underdeveloped. Cateora et al. (2005) describe the stages per the following UN level of industrialization in order to group countries into three categories:
1. MDC (more-developed countries): Industrialized countries with high per capita incomes, such as Canada, England, France, Germany, Japan, and the United States.
2. LDC (Less developed countries): Industrially developing countries just entering world trade, many of which are in Asia and Latin America, with relatively low per capita incomes.
3. LLDC (least developed countries): Industrially underdeveloped, agrarian, subsistence societies with rural populations, extremely low per capita income levels, and little world trade involvement. LLDCs are found in Central Africa and parts of Asia.
Johansson (2003, p82) distinguishes between two kinds of NIE (Newly Industrialized Economy) markets. The first group are “relatively rich in natural raw materials but the majority of the people have suffered pain inflicted to equal degrees by authoritarian political regimes and colonial domination”. The 2nd
group involves countries embracing Western-style capitalism, spurred by multinationals locating export-oriented facilities in order to access lower labor costs. As Johansson points out, “distribution channels are few and show low productivity, and communication media are limited in reach and coverage. Marketing research, therefore, rather than focusing on the buyer, is more usefully focused on the feasibility of various marketing activities”. One indicator of economic development relies on the level of infrastructure within the economy. Infrastructure (e.g. paved roads, communications, railroads, energy) serve the activities of many industries and are necessary to support production and marketing. “A marketer cannot superimpose a sophisticated marketing strategy on an undeveloped country. Marketing efforts must be keyed to each situation, custom tailored for each set of circumstances.” (Cateora et al. 2005, p.252). Accordingly, most of the difficulty in estimating market potential in the LDCs is due to economic dualism; the coexistence of modern and traditional sectors within the economy. For example, the modern sector is often centered in the capital city, and has modern airports, hotels, factories and an expanding middle class. The traditional sector however, contains the remainder (often majority) of the country’s population, and the two sectors may be centuries apart in production and consumption. In India, with a population of approximately 1 billion people, the modern sector of 200-250 million people demand products and services the same as any developed country. The traditional sector of 750 million (nearly 3x as large as the modern sector) demands more basic goods for subsistence – “sugar, coffee, soap, and kerosene”.
Global Importance of Emerging Markets
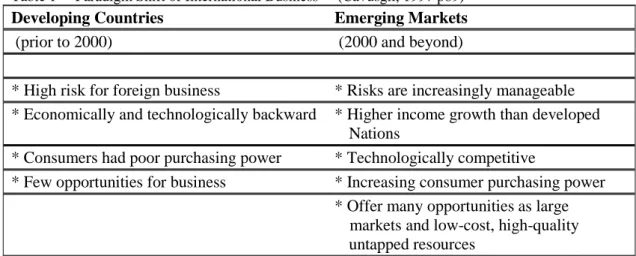
Ohmae (1985) stressed that for most global industries it was necessary to compete in all three parts of the “The Triad Market” (United States, Europe, and Japan) since they accounted for nearly 80% of most industries’ sales. Since Ohmae’s first discussion of the ‘triad’, it has expanded to encompass North America (NAFTA effect), the European Union (which has expanded to 25 countries), and the Asia Pacific region. It is precisely in large part due to the majority of firms focus on this ‘triad’ market, and its slowing growth rate (absolute market size is dramatic) that more companies are turning to emerging economies to generate higher growth rates for sales and profits. Global competitors need to make this “market” a key factor in their strategies. Conducting business in developed countries is more predictable, risks are better quantified, and the investment climate is more favourable, thus for many companies expansion in those countries is preferable to that in developing or emerging economies, even though the competition is usually more intense (Jeannet and Hennessey, 2004). Companies need to strategize on how to address successful marketing in the emerging economies, since 75% of the world’s population lives in the emerging economy countries, and the mobilization of technology and capital has increased globalization and fostered a paradigm shift in international business (Cavusgil et al., 1997). (See table 1 below)
Table 1 Paradigm Shift of International Business (Cavusgil, 1997 p89)
Developing Countries Emerging Markets
(prior to 2000) (2000 and beyond)
* High risk for foreign business * Risks are increasingly manageable * Economically and technologically backward * Higher income growth than developed Nations
* Consumers had poor purchasing power * Technologically competitive
* Few opportunities for business * Increasing consumer purchasing power * Offer many opportunities as large
markets and low-cost, high-quality untapped resources
Emerging Economies Rankings
There are numerous ways to identify and rank emerging economies. Cavusgil, et al. (2002) clusters countries based upon their demographic make-up. (See Table 2 below)
Latin America
Argentina, Peru, Brazil
Laggards
Algeria, Bangladesh, Egypt, Tunisia, Morocco, South Africa, Guatemala, Nigeria, Pakistan
Emerging markets
Chile, Colombia, Costa Rica, Dominican Republic, Ecuador, El Salvador, Honduras, Mexico, Philippines, Sri Lanka, Turkey, Venezuela
Southeast Asian
Indonesia, Malaysia, Thailand
Mature
Sweden, Switzerland, Austria, Belgium, Denmark, Finland, Norway, Poland, Netherlands, United Kingdom, Ireland, Italy, France, Spain, Greece, Hungary, Australia, New Zealand, Israel, Canada, Japan
Dynamic growth
Hong Kong, South Korea, Singapore, Portugal
Asian “elephants”
China, India
Table 2: Market-Oriented Classification of Emerging Economies (Cavusgil et. al, 2002 pg 23)
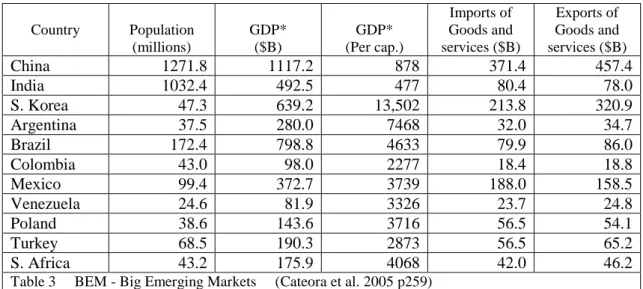
The World Bank identifies BEMs - Big Emerging Markets - which contain half the world’s population and account for 25% of the industrialized world’s GDP The list of BEMs is fluid (table 3), but they are characterized, in general, by:
Are physically large
Have significant populations
Represent considerable markets for a wide range of products Have strong rates of growth or the potential for significant growth Have undertaken significant programs of economic reform
Are “regional economic drivers”
Will engender further expansion in neighbouring markets as they grow
Country Population (millions) GDP* ($B) GDP* (Per cap.) Imports of Goods and services ($B) Exports of Goods and services ($B) China 1271.8 1117.2 878 371.4 457.4 India 1032.4 492.5 477 80.4 78.0 S. Korea 47.3 639.2 13,502 213.8 320.9 Argentina 37.5 280.0 7468 32.0 34.7 Brazil 172.4 798.8 4633 79.9 86.0 Colombia 43.0 98.0 2277 18.4 18.8 Mexico 99.4 372.7 3739 188.0 158.5 Venezuela 24.6 81.9 3326 23.7 24.8 Poland 38.6 143.6 3716 56.5 54.1 Turkey 68.5 190.3 2873 56.5 65.2 S. Africa 43.2 175.9 4068 42.0 46.2
Table 3 BEM - Big Emerging Markets (Cateora et al. 2005 p259)
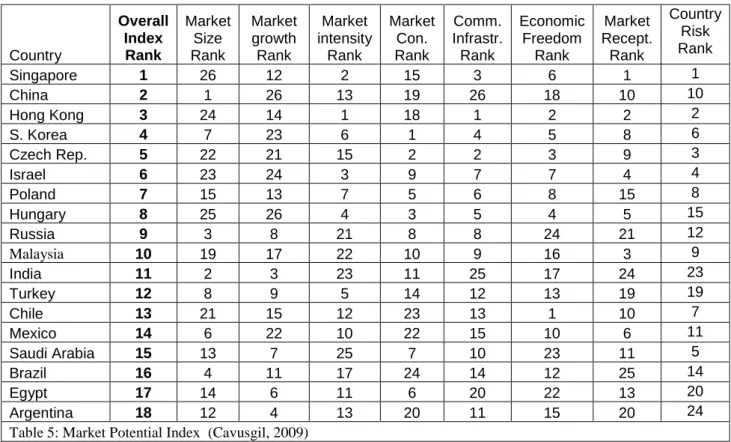
As noted by Cavusgil (2009) a Market Potential Index (MPI) is comprised of seven political, economic, and social variables (See Table 4 below). While subject to change depending upon global activities, the MPI is valuable for managers by analyzing the rankings for each dimension, as shown in Table 5.
DIMENSION WEIGHT MEASURES USED
Market size 10/50 Urban population electricity consumption.
Market growth rate 6/50 Average annual growth rate of primary energy use.
Real GDP growth rate.
Market intensity 7/50 GNI per capita estimates using PPP. Private consumption expenditure per capita Marketing Consumption
Capacity
5/50 Percentage share of middle-class in consumption/income
Commercial Infrastructure 7/50 Main telephone mainlines Cellular mobile subscribers Paved road density
Number of PC’s Internet users
Population per retail outlet
Percentage of households with TV Economic Freedom 5/50 Economic Freedom Index
Political Freedom Index Market Receptivity 6/50 Trade as a percentage of GDP
Per capita imports from USA Country Risk 4/50 Country risk rating
Country Overall Index Rank Market Size Rank Market growth Rank Market intensity Rank Market Con. Rank Comm. Infrastr. Rank Economic Freedom Rank Market Recept. Rank Country Risk Rank Singapore 1 26 12 2 15 3 6 1 1 China 2 1 26 13 19 26 18 10 10 Hong Kong 3 24 14 1 18 1 2 2 2 S. Korea 4 7 23 6 1 4 5 8 6 Czech Rep. 5 22 21 15 2 2 3 9 3 Israel 6 23 24 3 9 7 7 4 4 Poland 7 15 13 7 5 6 8 15 8 Hungary 8 25 26 4 3 5 4 5 15 Russia 9 3 8 21 8 8 24 21 12 Malaysia 10 19 17 22 10 9 16 3 9 India 11 2 3 23 11 25 17 24 23 Turkey 12 8 9 5 14 12 13 19 19 Chile 13 21 15 12 23 13 1 10 7 Mexico 14 6 22 10 22 15 10 6 11 Saudi Arabia 15 13 7 25 7 10 23 11 5 Brazil 16 4 11 17 24 14 12 25 14 Egypt 17 14 6 11 6 20 22 13 20 Argentina 18 12 4 13 20 11 15 20 24
Table 5: Market Potential Index (Cavusgil, 2009)
Sourcing or Selling
To analyze the issue of the potential of Emerging Markets, we will briefly review certain marketing and management strategies to tap this potential, such as Dynamic Legacies, Global Focusing, Born Global, Hidden Champions, Bottom Of the Pyramid, and Blue Ocean Strategy. In all these cases the emphasis is biased towards a global economy of satisfying consumer needs (Omar & Williams, 2009). To reach that paradigm a company has opportunities to serve both high-end developed markets as well as low-end developing ones. Berger, S. (2006, p44) defined Globalization as: “The changes in the international economy and in domestic economies that are moving toward creating one world market”, and characterized the drivers of these economic changes as 1) China’s opening to the West after 1979, 2) The Eastern Bloc collapse after 1989, and 3) Increase in world market volatility and financial crisis over the last 15 years, e.g. W. Europe (1992), Mexico (1994), Asia (1997), Russia (1998), and Argentina (2002). The first two drivers opened dramatic new markets of new consumers and low cost labor, while the third driver increased investment risks and the cost of capital.
Dynamic Legacies
What Berger, S. (2006, p.45) found was that the management of company Dynamic Legacies - defined as the “stock of experiences, skills, talents, organizational capabilities, and institutional memories” - determined success or failure in the global marketplace. Firms based upon different legacies utilized different methods to succeed in the global marketplace, resulting in a range of strategies with regard to the production process – i.e. offshoring, outsourcing, etc. Berger, T. (2006) found that there was no dominant model which led to global success: Neither the convergence model derived from theories discussed by economists like David Ricardo thru Paul
Samuelson regarding “comparative advantage” and “factor price equalization”, nor the “varieties of capitalism” model (Hall and Soskice, 2001) which predicts that companies expanding globally try to recreate the same types of institutions that they successfully depended upon at their domestic base. The model specifies two types of capitalist systems: 1) Coordinated market economies (Germany, Japan) where resource allocation decisions involve a variety of non-market institutions emphasizing trust between the parties, and 2) Liberal market economies, (US, Great Britain) whereby markets act as the primary medium to allocate resources.
In the 21st century there has been a major fragmentation of production systems, such that the functions can be “reorganized” or “outsourced”, and companies need to create strategies “for selecting which of the steps, from defining a product and delivering it to a customer, should remain in-house versus the functions that will be outsourced – that is, purchased from other firms” (Berger, T., 2006, p.15). A related change highlighted by Berger as a result of companies’ abilities to divide the production process involves a redistribution of firms’ production steps between ”home” and “host” locations. Companies can maximize utilization of low cost labor, abundant space, and new customers in foreign countries. Additionally, a networked global supply chain now distributes the production processes across different suppliers and global regions, with a ‘mix-and-match’ combination of design firms, contract manufacturers, assemblers, distribution channel partners, and retail operators.
Companies can now transmit complex design specifications electronically worldwide nearly instantaneously, and utilize the “enablers” of advanced communication and transportation technologies to disassemble the production process functions and distribute them to vendors virtually anywhere in the world. Yet corporate home base is where firms have their headquarters. Home markets are usually the MNCs’ largest customer base, and the goods and services a company makes trend toward the demands and needs of its home market. Not only is the largest share of corporate assets held in the home location, (Hirst and Thompson, 1999), but most R&D is conducted at home also (NSF, 2004). Berger T. (2006) recommended that companies maintain only two types of production process functions in-house: activities where they are competitive with global market leaders; and activities which may be important to the development of future businesses. Companies must compete based upon the production process functions in which they retain competitive advantages as a result of their “dynamic legacies”.
Global Focusing
In order to amortize increasing R&D costs (see Bartlett and Ghoshal, 1990; Pearce and Singh, 1992), globally active corporations are responding by attempting to introduce innovations as fast as possible over the widest geographical area. According to Howells and Wood (1993), these firms utilize the strategic options of global switching and global focusing of their international network to meet the requirements of space-time compression (Harvey, 1989). As one example of Global Focusing, MNCs in the global pharmaceutical industry are reorganizing their production process, and allocating specific responsibilities and tasks to their research centers on a global scale (Zeller, 2000). Three major changes forcing the realignment are 1) Necessity to generate continuous growth; 2) Exploding costs of R&D, and 3) Hugh capital requirements to achieve economies of scale requiring simultaneous launching in many markets.
Born Global
Born global companies aim at global marketing right from the start. The phrase “Born Global” is used to describe companies that commence operations with a focus on the global markets rather than on the domestic market (Burca et al., 2004, p. 272). These are companies who start their involvement overseas through direct foreign investment at the initial stage (Holstein, 1992; McKinsey and Co., 1993; Nordstrom, 1991; Oviatt and McDougall, 1994). They are characterised by being small - typically fewer than 500 employees and annual sales under $100 million - and very often rely on cutting-edge technology in the development of a relatively unique product or process innovation. But the most distinguished feature of Born Global companies is that they “tend to be managed by entrepreneurial visionaries who view the world as a single, borderless marketplace from the time of the company's founding” (Knight and Cavusgil, 1996, p 12). Any Born Global firm, regardless of experience or resources, can compete on an international basis (Knight and Cavusgil, 2004). According to Burca et al. (2004, p. 275) those sort of companies “offer products and services to small, niche markets and the size of that niche in the domestic market is insufficient to ensure the viability of the concept underlining the product. Therefore, at this stage companies might have to modify products that are not culturally sensitive”. The background of the owner of the company has a very strong influence on the creation of born global companies. It could include personal networking, market knowledge and skills, international contacts and international experience. Previous experience and knowledge across national borders open up possibilities for a new business. Born Global firms will often seek partners who complement their own competence because of limited resources. Factors giving rise to the emergence of Born Global companies and explaining why such companies can successfully enter an international market are the increased role of niche markets; advances in technological process and production; the flexibility and adaptability of small companies; the global network and advances in information technology (Hollensen, 2001).
Hidden Champions
Discussion about born global firms leads to other types of companies known as the “Hidden Champions”. These companies enjoy high global market shares of 70 - 90%, which no more than a few multinational companies can match, and many of the Hidden Champions were global long before the term global was coined, yet they strongly prefer to remain hidden (Hermann, 2005). Companies like the Hidden Champions profit from tough conditions such as rigorous cost cutting, restructuring, and transplanting jobs from high wage locations. The essential characteristics of Hidden Champions relate to the personality of the leader, level of sophistication, and corporate culture. Another measure of success is market share, particularly popular among Japanese companies. It is important to mention that the hidden champions are not above the market game; they are exposed to competition, market problems and management oversight the same as other companies and some of them will fail in the future. Hidden Champions define marketing based on technology, and in a wider sense on competencies. From a competitive perspective the substitute product is not a popular approach with the Hidden Champion, because they try to make their product as dissimilar as possible from those of their competitors. Hidden Champions often objected to their competitors’ market definition; instead they see the market definition as part of their strategy. They recognise that over 50% of their profit comes from overseas markets and if they include their exporting activities the figure will rises to more than 70%.
For example, some of these Hidden Champion companies are:
Hauni: the main producer of cigarette machines (nearly 90% global market share). Baader: largest producer of fish processing equipment. (90% global share). Brita: manufacturer of point-of-use water filters. (85% global market share). Gerriets: neutral light and cloths for stage theatrical scrims (100% global share).
Bottom of the Pyramid (BOP)
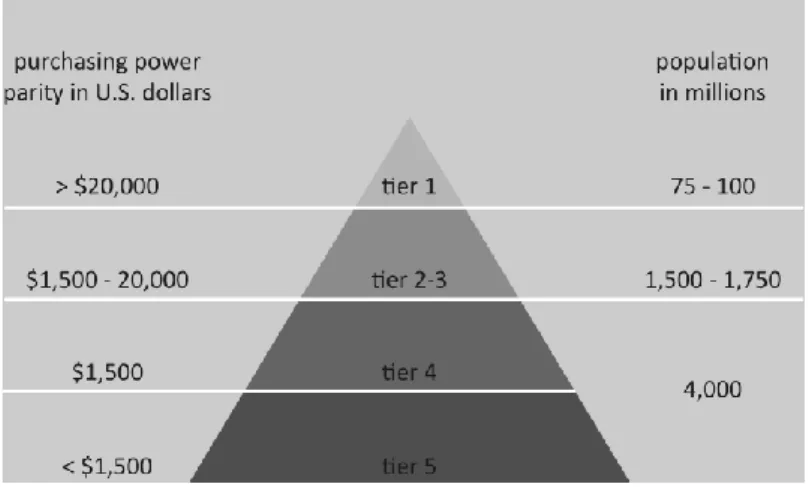
The Bottom of the Pyramid global economic system as defined by Prahalad and Hart (2006) refers to the enormous untapped potential of emerging markets previously thought of as unreachable or difficult to reach. More than 4 billion people, nearly 70% of the total world, are in the Bottom Of the Pyramid (see figure 1). These markets are often unlinked to the global supply chain and global marketing channels. The lack of development of marketing infrastructure such as communications channels for advertising, distribution channels to supply the market, and the low income of this target market made it difficult and many times unprofitable to penetrate this market. However, the bottom of the pyramid market is perhaps the world’s largest and the accessibility of this market is becoming easier.
Fig. 1: Bottom Of the Pyramid (Prahalad & Hart, 2006)
In pioneering this theory Prahalad has identified the following unique characteristics, (Prahalad, 2006):
1. There is money at the BOP. Nine countries (China, India, Mexico, Brazil, Russia, Indonesia, Turkey, South Africa, and Thailand) collectively are home to 3 billion people, and represent 70% of the developing world population. In terms of dollar purchasing power parity (PPP) this group’s GDP is $12.5 trillion, representing 90% of the developing world – larger than Japan, Germany, France, UK, and Italy combined.
2. Access to BOP Markets. The density of urban areas allows for intense distribution networks. Unfortunately, access to distribution in rural markets is difficult, thus being denied products and services as well as access to knowledge about availability and usage. There is no single distribution solution.
3. The BOP Markets are Brand Conscious. In particular, aspirational brands are critical. And BOP consumers are also extremely value-conscious.
4. The BOP Market is Connected. Universally, BOP consumers are rapidly exploiting the benefits of information networks, particularly wireless networks (both telecom and PCs). Concurrently, the word-of-mouth spread of good bargains / bad news is very rapid and intensifies brand / value consciousness. 5. BOP Consumers accept Advanced Technology readily, in large part due to the
fact that they have nothing to forget.
Companies operating based in emerging economies who market to the BOP and are now going global have some key advantages such as access to some of the world’s most dynamic growth markets and immense pools of low-cost resources, whether it is production workers, engineers, land, or energy. These aspiring giants are about much more than low cost. The best of the pack are proving as innovative and expertly run as any in the business, astutely absorbing global consumer trends and technologies and getting new products to market faster than their competitors. Globalisation and the internet are ushering in this “seismic change” to the competitive landscape because they can access the same managerial talent, information, and capital as Western companies. Potential customers at the BOP have annual purchasing power parity less than US $1,500. The BOP can not be tapped by just modifying current global approaches, but instead companies must create a totally new approach. A standard western marketing mix offering will not work with this group whose circumstances require a highly customized approach. Buyers at the BOP behave differently not only from their counterparts in developed country markets but also from the upper and middle-income customers in their own societies. For one thing, they are brand conscious, especially for aspirational reasons. London and Hart (2004) reveal that success in the BOP sector most often involves a new product, targeted at a new set of customers, and distributed using innovative distribution channels. Thus one or more of the marketing mix must be revamped.
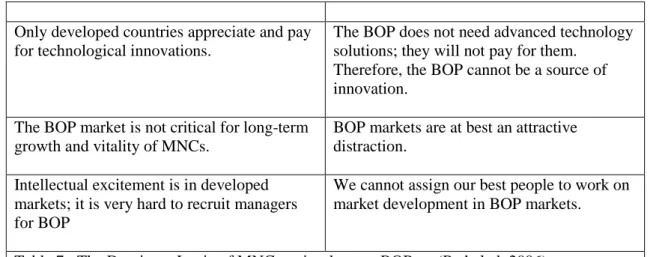
Most MNCs fail to recognise the potential at the bottom of the pyramid. They often hold assumptions similar to those listed in Table 7 below. Yet Prahalad (2006, p9) claims “… a 10 – 200 times advantage (compared to the cost structures that are oriented to the top of the pyramid markets) is possible if firms innovate from the BOP up and do not follow the traditional practice of serving the BOP markets by making minor changes to the products created for the top of the pyramid”.
Assumption Implication
The poor are not our target customers; they cannot afford our products or services
Our cost structure is a given; with our cost structure we cannot serve to BOP market. The poor do not have use for products sold in
developing countries.
We are committed to a form over functionality. The poor might need sanitation, but can’t afford detergents in formats we offer. Therefore, there is no market in the BOP.
Only developed countries appreciate and pay for technological innovations.
The BOP does not need advanced technology solutions; they will not pay for them.
Therefore, the BOP cannot be a source of innovation.
The BOP market is not critical for long-term growth and vitality of MNCs.
BOP markets are at best an attractive distraction.
Intellectual excitement is in developed markets; it is very hard to recruit managers for BOP
We cannot assign our best people to work on market development in BOP markets.
Table 7: The Dominant Logic of MNCs as it relates to BOP. (Prahalad, 2006)
According to Prahalad (2006, p14)
“BOP markets can collapse the time frames taken for products, technologies and concepts to diffuse in the system… …The result is the challenge to the “S” curve model for the diffusion of new products and services in the developed world… …Changes that played out over 15 years in the developed markets are being collapsed into a short period of just 3-5 years in many BOP markets. [Such an]“I” curve challenges the status quo”.
Traditional MNCs with product lines priced and developed for Western or Top Of the Pyramid (TOP) markets are often inaccessible to customers in BOP markets, and the feature-function set is often inappropriate. Prahalad has also identified 12 Principles of Innovation for BOP markets (Table 8 below)
BOP Principles of Innovation * Focus on Price Performance
* Develop infrastructure/technology hybrid solutions * Scalable and transportable across countries
* Focus on conserving resources * Hostile environment operation * Methods to access poor
* Deep understanding of product functionality.
* Platform should easily incorporate feature / function evolution * Recognize process innovations are as critical as product innovations. * Deskilling work is critical.
* Educate consumers on product usage. * Interfaces are critical
Table 8: BOP Principles of Innovation (Prahalad, 2006)
However, since Prahalad’s initial work there have been studies which paint a different picture regarding BOP markets. Karnani (2007) indicates caution is recommended, as the BOP market is currently generally too small to profitably attract most MNC’s; indeed the opportunity is for small to medium local companies. Crabtree (2007) also questions the profit-making proof in the BOP strategy, while acknowledging positive fundamental capabilities. Landrum (2007) finds that although Prahalad’s examples of
innovation are market-specific, and his claim of poverty eradication is not fully supported (see Bendell, 2005; Jenkins, 2005), the overall intent of Prahalad’s analysis is to “challenge corporations to be innovative and creative”.
Blue Ocean Strategy (BOS)
Kim and Mauborgne (2005) define two separate market spaces. One – the “Red Ocean” – is comprised of all the known industries in existence today. The industry boundaries are defined and accepted. Competition is focused on trying to outperform rivals and increase market share within existing demand. In contrast, “Blue Oceans” are characterised by untapped market space, demand creation, and possibilities for highly profitable growth. For example, thirty years ago many current billion-dollar Blue Ocean industries did not exist: mutual funds, cell phones, discount retail, express package delivery, minivans, and coffee bars. The driving forces behind Blue Oceans include:
1. Accelerated technological advances which substantially improve industrial productivity and resulted in a huge array of products and services.
2. Trend toward globalisation.
3. Global competition increasing supply without a similar increase in global demand.
These forces accelerate commoditization, increase the frequency and severity of price wars, and put pressure on profit margins. As offerings (Brands) become more alike, consumers make their selections based more often on price. The key to a Blue Ocean strategy is Value Innovation (figure 2 below), which is created at the intersection where a company’s actions profitably affect both its cost structure and its value proposition to buyers.
Fig. 2 Blue Ocean Strategy (Kim & Mauborgne, 2005)
Buyer value is increased by creating and raising elements the industry has never offered to the market, and in that sense they are similar to Hidden Champions. Costs are reduced initially by eliminating and reducing the factors an industry competes on, and later as economy of scale savings due to increased volume materialize. The problems that arise with this approach are, firstly, can you find new offerings and secondly, can you do it in a way that can't be copied easily so that a sustainable, long-term business can be created. Value Innovation requires companies to orient the whole system toward achieving a leap in value for both buyers and themselves. As noted by Kim and Mauborgne (2005 p 18), the key defining features of this strategy (table 9) involve:
BOS Value Innovation * Break the value-cost trade-off
* Make competition irrelevant
* Align all firm activities in pursuit of differentiation. * Create and capture new demand
Table 9: BOS Value Innovation (Kim & Mauborgne, 2005)
BOS develops a four actions framework, which incorporates four key questions to challenge an industry’s strategic/business model, and breaks the trade-off between differentiation and low cost, thereby creating a new value curve:
Which of the factors that the industry takes for granted should be eliminated?
Which factors should be reduced well below the industry’s standard?
Which factors should be raised well above the industry’s standard?
Which factors should be created that the industry has never offered? The Value Flame at the Bottom of the Pyramid
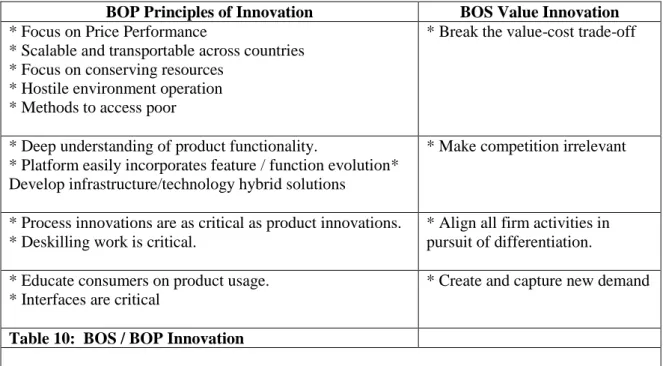
The analysis of BOP and BOS strategies undertaken in this paper suggests that there may be a “Blue Ocean” opportunity at the “Bottom of the Pyramid”, which we refer to as the Value Flame at the Bottom of the Pyramid (VFBOP). It is useful to overlap and compare the BOS and BOP strategies. We suggest that indeed the BOS Value Innovation targets the BOP, in part because of the BOS characteristics of untapped market spaces, demand creation, and possibilities for highly profitable growth (fig. 3). The key defining features of BOS involves the creation of uncontested space; irrelevance of competition; creation and capture of new demand; and value-cost trade-off disconnection. Perhaps most importantly it requires the alignment of the whole firm in pursuit of differentiation. This is likely to lead an organization away from the “Top of the Pyramid” Red Ocean markets where most emerging market strategy is focused, and towards the BOP. We can compare BOS Value Innovations and the BOP Principles of Innovation. (table 10)
BOP Principles of Innovation BOS Value Innovation * Focus on Price Performance
* Scalable and transportable across countries * Focus on conserving resources
* Hostile environment operation * Methods to access poor
* Break the value-cost trade-off
* Deep understanding of product functionality.
* Platform easily incorporates feature / function evolution* Develop infrastructure/technology hybrid solutions
* Make competition irrelevant
* Process innovations are as critical as product innovations. * Deskilling work is critical.
* Align all firm activities in pursuit of differentiation. * Educate consumers on product usage.
* Interfaces are critical
* Create and capture new demand
Note that the FBOP strategy does not result in a complete BOP pyramid shape nor the BOS diamond shape (see figure 4). Given that the VFBOP strategy in this situation is employed typically by a Multi-National Corporation (MNC) entering the emerging market from a developed country, it implies enough of an existing (LDC) market and existing (LDC) competition, thus the Blue Ocean market does not linearly taper off. Local competition is likely to be to a large extent, red at the BOP.
Fig 3 BOP and BOS Fig. 4 VFBOP
The Value Innovation area in Figure 4 widens out as a company moves further lower from the Top of the Pyramid, but in deference to the existing competitive red ocean at the BOP it does not completely envelop it, and in fact if entered with unsuccessful strategies the company may not be able to compete at the bottom of the pyramid, and eventually retreat. We suggest that in fact, some of these red competitors may survive and perhaps succeed at the TOP, or even go global.
Conclusion
The opportunities that emerging economies provide to multinational corporations, within a context of a paradigm shift of international business that includes an LDC market which offers more manageable risks, higher income growth and increasing consumer purchasing power, lies in both the market available to source from (Harrison et al. 2000; Johansson, 2003; Rostow, 1960) but additionally the market to sell to (Cavusgil, 1997; Cateora et al. 2005; Prahalad and Hart, 2002). This shifting dynamic allows corporations to generate profit not solely from reducing costs by utilizing new suppliers offering low cost and high quality resources; they also offer opportunities to be able to enter new markets and generate revenues and expand global market share. Through both the Bottom Of the Pyramid and Blue Ocean Strategy theoriesit can be seen that enormous opportunities may be available in these emerging economies, in the Flame at the Bottom of the Pyramid.
References
Bartlett, C. A., and Ghoshal, S. (1990) "Managing Innovation in the Transnational
Corporation." In Managing the global firm / edited by Christopher A. Bartlett, Yves Doz, and Gunnar Hedlund. London; New York: Routledge, 1990
Bendell, J. (2005) “From responsibility to opportunity:CSR and the future of corporate contributions to world development”, Accessed November 2, 2006,
http://www/mhcinternational.com/csr%20from%20responsibility%20to%opportunity.htm Berger, S. (2006) How we Compete: What companies around the World are doing to make it
in today’s Global Economy, Currency-Doubleday: New York and London
Berger, T. (2006) “From nation-building to state-building: The geopolitics of development, the nation-state system and the changing global order”, Third World Quarterly, Volume 27(1), pp. 5 - 25
Burca, De B., Fletcher, R. and Brown, L. (2004) “International Marketing, An SME
Perspective”, Pearson Education, London.
Cateora, R. Philip and L. J. Graham, (2005), International Marketing, McGraw-Hill, 11th Edition, US, p. 52.
Cavusgil, S.T. (1997), "Measuring the potential of emerging markets: an indexing approach",
Business Horizons, Vol. 40 pp.87-91.
Cavusgil, S.T. (2009) “Market Potential Index”, accessed November12, 2009 http://globalEDGE.msu.edu/resourceDesk/mpi,
Cavusgil, S.T., Ghauri, P.N., and Agarwal, M.R. (2002), “Doing Business in Emerging Markets: Entry and Negotiation Strategies”, London: SAGE.
Crabtree, A. (2007) “Evaluating ‘The Bottom of the Pyramid’ from a Fundamental
Capabilities Perspective”, CBDS Working Paper Series, Working Paper No. 1, 2007, pp1-18
Harrison, A., Dalkiran, E, and Elsey, E (2000) “International Business”, Oxford University Press, London
Harvey, D (1989) “The condition of postmodernity: an enquiry into the origins of cultural
change”, Blackwell, Oxford
Hermann, S. (2005) “Hidden Champions: Lessons from 500 of the World's Best Unknown
Companies”, McGraw-Hill Ryerson Agency
Hirst, P and Thompson, G. (1999) “Globalization in Question, the International Economy and
the Possibilities of Governance”, Publisher: Blackwell Publishers
Hollensen, S. (2001), “Global Marketing-A Market-Responsive Approach,” London: Prentice Hall.
Holstein, W. J. (1992) “Little Companies, Big Export” Business Week, (April 13), pp 70-72
Hoskisson, R.E., Eden, L., Lau, C.M. and Wright, M. (2000) “Strategy in Emerging Economies”, The Academy of Management Journal, Vol. 43, No. 3, pp. 249-267
Howells, J. and Wood, M. (1993), The Globalization of Production and Technology, European Commission, Luxembourg
Jeannet, J. P. and Hennessey, H. D. (2004) “International Marketing Management: Strategies
and Cases” Houghton Mifflin, Boston
Jenkins, R. (2005) “Globalization, corporate social responsibility and poverty”, International Affairs, 81(3), pp525-540
Johansson, J. K. (2003) “Global Marketing Foreign Entry, Local Marketing & Global
Management” New York: McGraw-Hill.
Karnani, A. (2007), “The Mirage of Marketing to the Bottom of the Pyramid”, California Management Review, Vol. 49, No.4, Summer 2007, pp91-111
Kim, M.C. and Mauborgne, R (2005) “Blue Ocean Strategy”, Journal of Business Strategy, Vol. 26, NO. 4, Pp. 22-28.
Knight, G. A., and Cavusgil, S.T. (1996) “The Born Global Firm-A Challenge to Traditional Internationalisation Theory” Advances in International Marketing, Vol. 8, pp 11-26. Knight, G. A., and Cavusgil, S.T. (2004) “Innovation, Organizational Capabilities, and The
Born-Global Firm,” Journal of International Business Studies (2004) 35: 124-141 Landrum, N. (2007), “Advancing the ‘Base of the Pyramid’ debate”, Strategic Management
Review, Vol. 1, No. 1, 2007, pp12-16
London, T. Hart, S. L. (2004) “Reinventing strategies for emerging markets: beyond the transnational model”, Journal of International Business Studies, Vol. 35 (5), pages 350-370
McKinsey and Co. (1993) “Emerging Exporters: Australia’s high value-added manufacturing
exporters, Melbourne: Australian Manufacturing Council.
Nordstrom, K. A. (1991) “The Internationalisation Process of Firm” Doctoral Dissertation Stockholm, School of Economics
Ohmae, K. (1985) “Triad Power: The Coming Shape of Global Competition” The Free Press, New York.
Omar, M., Williams, R. (2009) “Marketing to the Bottom of the Pyramid; Opportunities in emerging Markets”, International Journal of Services, Economics and Management, Vol. 1, No. 4, pp427-446
Oviatt, B. and McDougall, P. (1994) Toward a Theory of International New Ventures” Journal of International Business Studies, Vol. 25, (1), pp 45-64.
Pearce, R.D., Singh, S. (1992), Globalizing Research and Development, Macmillan, London, Prahalad, C.K. (2006) “The Fortune at the Bottom of the Pyramid: Eradicating Poverty
Through Profits” N.J: Wharton School Publishing.
Prahalad, C.K., and Hart, Stuart L., (2002) “The Fortune at the Bottom of the Pyramid”,
Strategy+Business, 26: 54- 67, First Quarter 2002, Booz, Allen & Hamilton Inc Rostow, W. W. (1960) “The Stage of Economic Growth”, Cambridge University Press
Rostow, W. W. (1971) “Politics and the Stages of Growth”, Pp. xiii, 410. Cambridge: at the University Press
Zeller, C. (2000) “Rescaling power relations between trade unions and corporate management in a globalising pharmaceutical industry: the case of the acquisition of Boehringe Mannheim by Hoffman-La Roche,” Environment and Planning, Vol. 32, pp. 1545-1567