U N I V E R S I T Y OF D O R T M U N D
REIHE COMPUTATIONAL INTELLIGENCE
COLLABORATIVE RESEARCH CENTER 531
Design and Management of Complex Technical Processes
and Systems by means of Computational Intelligence Methods
Pareto-, Aggregation-, and Indicator-based
Methods in Many-objective Optimization
Tobias Wagner, Nicola Beume and Boris Naujoks
No. CI-217/06
Technical Report
ISSN 1433-3325
September 2006
Secretary of the SFB 531 · University of Dortmund · Dept. of Computer Science/XI 44221 Dortmund·Germany
This work is a product of the Collaborative Research Center 531, “Computational Intelligence,” at the University of Dortmund and was printed with financial support of the Deutsche Forschungsgemeinschaft.
Methods in Many-objective Optimization
Tobias Wagner1, Nicola Beume2, and Boris Naujoks2
1
Institut f¨ur Spanende Fertigung (ISF)
2Chair of Algorithm Engineering
University of Dortmund, 44221 Dortmund, Germany
[email protected],{nicola.beume,boris.naujoks}@uni-dortmund.de, WWW home page:http://ls11-www.cs.uni-dortmund.de, http://www.isf.de
Abstract. Research within the area of Evolutionary Multi-objective Optimization (EMO) focused on two- and three-dimensional objective functions, so far. Most algorithms have been developed for and tested on this limited application area. To broaden the insight in the behav-ior of EMO algorithms (EMOA) in higher dimensional objective spaces, a comprehensive benchmarking is presented, featuring several state-of-the-art EMOA, as well as an aggregative approach and a restart strategy on established scalable test problems with three to six objectives. It is demonstrated why the performance of well-established EMOA (NSGA-II, SPEA2) rapidly degradates with increasing dimension. Newer EMOA likeε-MOEA, MSOPS, IBEA and SMS-EMOA cope very well with high-dimensional objective spaces. Their specific advantages and drawbacks are illustrated, thus giving valuable hints for practitioners which EMOA to choose depending on the optimization scenario. Additionally, a new method for the generation of weight vectors usable in aggregation meth-ods is presented.
1
Introduction
In the field of evolutionary multi-objective optimization, a lot of test problems and applications with two or three objectives have been studied. Problems with more than three objectives, which have been termed many-objective problems by Farina and Amato [1], have been tackled only rarely. Many techniques that work well for only a few objectives are anticipated to have difficulties in high-dimensional objective spaces. Thus, many-objective optimization is significantly more challenging than scenarios usually being analyzed.
Within multi-objective optimization, we consider d-dimensional vectors of objective values for a problem ofdobjective functions f = (f1, . . . , fd). Among
these vectors, a partial order holds concerning the considered minimization prob-lems. An individualpwith decision vectorxdominatesanotherp0 with decision
vectorx0, if and only if for the objective vectors y=f(x) andy0=f(x0) holds:
∀i ∈ {1, . . . , d} : yi ≤ y0i and y 6= y0. Within a set of individuals, individuals
that are not dominated by other members are callednon-dominated. The mini-mal elements of the partial order of the dominance relation, which are globally
y
¦
1¦
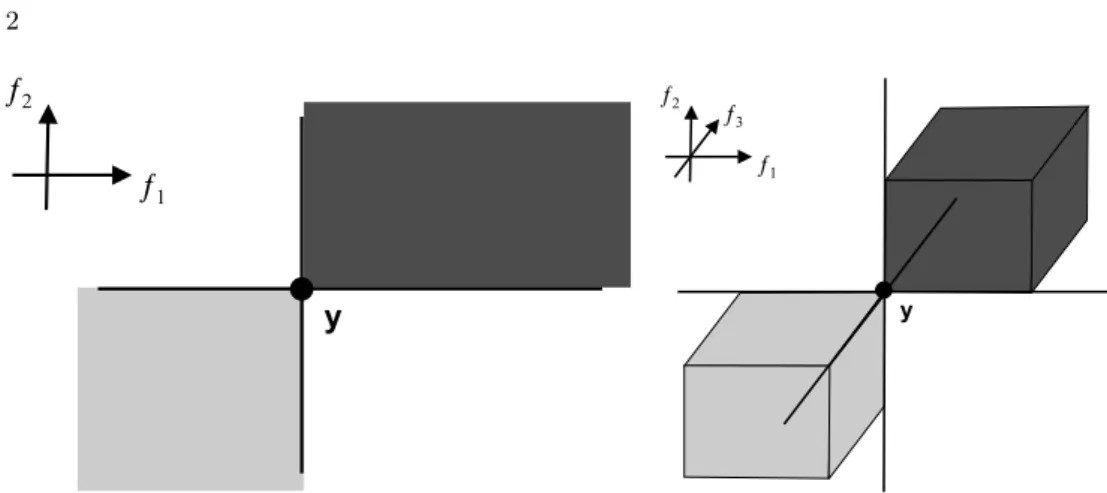
2 ¦1 ¦2 y ¦3Fig. 1: A solution’s comparable space in case of two (left) and three objectives (right). The region which is dominated by a point y is marked dark gray and the region con-sisting of points dominating y is shaded light gray. Only points in those areas are comparable toywith respect to Pareto-dominance, whereas all other points are incom-parable.
non-dominated are called Pareto optimal. The set of Pareto optimal decision vectors is called Pareto setand the corresponding set of Pareto optimal objec-tive vectors is called Pareto front. The selection module of an EMO algorithm (EMOA) requires a mapping of an objective vector to a ranking criterion to establish a complete order among individuals. Popular EMOA usually consist of two selection operators. The primary selection operator is based on Pareto dom-inance and favors non-dominated solutions over dominated ones. The secondary operator is constituted diversity preserving and rates solutions incomparable concerning the primary operator. Whenever the set of solutions being equivalent concerning the primary operator is too large to be completely taken into the following population, the secondary operator is applied.
This concept of selection already documents the insight that Pareto domi-nance may not be sufficient as a sole selection operator, due to the large amount of possibly incomparable solutions. More precisely, a d-dimensional objective vector is only comparable with a fraction of 1/2d−1 of an (infinite) objective
space, as stated by Farina and Amato [1]. This fact is depicted in Fig. 1. The importance of the secondary selection operator grows with increasing dimension of the objective space since the incomparability concerning the Pareto-based operator becomes the typical case.
Few previous studies on many-objective optimization by Purshouse and Flem-ing [2] and Hughes [3] focus to demonstrate the bad performance of NSGA-II by Deb et al. [4]. Hughes observed a simple single-objective restart strategy out-performing NSGA-II on a six-objective function in a two-dimensional decision space. Upon this, he implied a generalization to all Pareto-based techniques.
In contradiction, the work at hand includes positive results by demonstrat-ing that some modern EMOA usdemonstrat-ing Pareto-concepts cope very well with high-dimensional objective spaces. We ascribe the good performance of ε-MOEA,
IBEA, SMS-EMOA, and MSOPS to new concepts of aggregation and indicator functions and explain how and why these EMOA work successfully. A compre-hensive benchmark is presented on the established test functions of the DTLZ function family, which feature a high dimensional decision and a scalable ob-jective space. Moreover, a slight modification to NSGA-II is suggested, which causes a better performance. Our motivation is not to modify NSGA-II but to demonstrate which aspects of classic EMOA are responsible for the problems within many-objective optimization.
The aggregation method MSOPS by Hughes [3] which performs an optimiza-tion with respect to all objectives in parallel not harking back to the concept of Pareto dominance is studied more detailedly. The problems using aggregation are described and solution concepts are presented with a focus on suitable sets of weight vectors.
The insights are very interesting for practitioners who have to decide which algorithm is suitable to solve their problem effectively and efficiently. The dis-cussed aspects of parameterization simplify the successful application of EMOA. For designers of algorithms, the study gives hints to possible improvements.
The considered test functions, performance measures and basic settings of the EMOA are described in the following section. Section 3 deals with the behavior of Pareto-based EMOA, Section 4 with aggregation methods, and Section 5 with methods utilizing indicator functions for selection. In these sections, algorithms are presented and their performances are described with help of the quality measures. Section 6 summarizes the findings and gives an outlook on how to further deepen insight in many-objective optimization.
2
Benchmark Settings
All algorithms, except otherwise mentioned, have been implemented within the PISA framework1[5] since an integrative framework simplifies comparisons. The
same variation operators are used with exactly the same parameterization, which is chosen according to the studies of Deb et al. [6]. Simulated binary crossover (SBX) and polynomial mutation (PM) as described by Deb [7] are applied with mutation probability pm = 1/nper decision variable and recombination
prob-ability pc = 1 per individual. The distribution indices ηc = 15 and ηm = 20
are used. If not otherwise stated, a (µ+µ) strategy and a binary tournament for mating selection are applied. A number of 30.000 function evaluations is ac-complished and the population sizeµ= 100 is chosen. For each EMOA, besides SMS-EMOA, on each test function, 20 runs are performed. Due to the exponen-tial runtime and the small standard deviation in the observed runs, SMS-EMOA is only repeated 5 times.
1
PISA - Platform and Programming Language Independent Interface for Search Al-gorithms, ETH Z¨urich (www.tik.ee.ethz.ch/pisa/)
2.1 Test Functions
To benchmark the performance of the considered EMOA, the functions DTLZ1 and DTLZ2 of the DTLZ test function family [8] are invoked. These functions are scalable in the number of objectives and thus allow for a many-objective study. A bottom-up approach is used, which combines a parametric description of the Pareto front with a distance function. Therefore, the decision vector is divided into two subvectors. The first one of lengthd−1 contains the parameters defining the position on the given surface while the second of lengthν specifies the distance to the Pareto front. This results in dimensiond+ν−1 of the decision space. According to Deb et al. [8],ν = 5 is used in DTLZ1 andν = 10 is used in DTLZ2 respectively.
The Pareto front of DTLZ1 is a linear hyperplane (Pd
i=1fd(x) = 0.5). DTLZ2
features a Pareto front that corresponds to the positive part of the unit hyper-sphere (|f(x)| = 1). Here, the interaction between objectives is nonlinear. The domain of all decision variables is [0,1]. Due to different scaling constants in the distance function, the codomain of objective values for DTLZ1 is [0,1 + 225ν] and [0,1 + 0.25ν] for DTLZ2, respectively. The Pareto set of both test functions corresponds toxd, . . . , xn= 0.5 with arbitrary values forx1, . . . , xd−1.
2.2 Performance Assessment
For performance assessment, the S-metric by Zitzler and Thiele [9] and the convergence measure [6] are considered. TheS-metric determines the size of the dominated hypervolume in objective space bounded by a reference point r. In EMO research it is of outstanding importance due to its theoretical properties. The values depend on proximity to the Pareto front as well as on distribution of points. The maximalS-metric value is reached by the Pareto front. The reference points r = 0.7d for DTLZ1 and r = 1.1d for DTLZ2 were used in previous
studies [6, 10] and are close to the Pareto front in order to emphasize on the distribution of optimal solutions. Points that do not dominate the reference point are discarded for metric calculation. The metric values are normalized by calculating the fraction of the analytical optimal value. Note that exactly 100% are unreachable with a finite number of points.
The convergence measure describes the average distance of the approximation to the Pareto front in objective space. In contrast to the study of Deb et al. [6], the euclidean distance to the nearest optimal solution is determined analytically without using a reference set.
In analytic geometry, the distance of a point to a hyperplane can be cal-culated using the Hesse normal form. Given a parametric surface S defined by
n1x1+. . .+ndxd=a, the distancedS of a point (r1, . . . , rd)T to S is
dS = n1x1+. . .+ndxd−a p n2 1+. . .+n2d .
The DTLZ1 hyperplane possesses the normal vector (n1, . . . , n2)T = (1, . . . ,1)T
resulting in the distance
dDT LZ1(x) =|f1(x) +. . .+fd(x)−0.5|
of a solutionxto the Pareto front.
On DTLZ2, the shortest way to the Pareto front is the line between the position vector of the solution and the origin of the objective coordinate system. Since the distance of the origin to each point of the Pareto front is 1, the distance of a solutionxto the Pareto front constitutes
dDT LZ2(x) =|f(x)| −1.
3
Pareto-based EMOA
As Pareto-based EMOA, we classify EMOA with selection criteria that are mainly based on the qualitative information of Pareto-dominance, Pareto-based ranking, or counting. Thus, NSGA-II, SPEA2, andε-MOEA are considered here.
NSGA-II The Elitist Non-dominated Sorting Genetic Algorithm (NSGA-II) by Deb et al. [4] applies the rank assigned to each solution by non-dominated sorting as primary selection criterion. Non-dominated individuals are assigned rank one and the set of individuals with equal rank is called a front. Those indi-viduals that are non-dominated if the first front was removed are assigned rank two. The third front is decided within the population discarding the first and the second front and so on. Individuals with equal ranks are evaluated using a sec-ondary selection criterion called crowding distance. This subsumes the distances to the next higher and lower values in each dimension, respectively. Currently, the NSGA-II is supposed to be the best known and most frequently applied EMOA. Jensen [11] improves the non-dominated sorting algorithm, determining the overall runtime of NSGA-II, to run inO(µlogd−1µ) per generation.
SPEA-2 The Strength Pareto Evolutionary Algorithm (SPEA2) by Zitzler et al. [12] uses two ranking criteria as well. It is an elitist algorithm with an archive of constant size, which is chosen to be the population sizeµin the experiments at hand. As primary selection criterion, a strength value that gives the number of individuals in the population dominated by the current individual is assigned. Based on these values a raw fitness is computed as the sum of the strength values of every individual that dominates it. Thus, every non-dominated individual’s raw fitness equals zero. In a second step, a density estimation is performed based on the euclidean distances between all individuals. The primary fitness value is the raw fitness plus the reciprocal of the sum of the distance to the k-nearest
neighbor [13]2. To fill the archive for the next generation, the individuals with
the best fitness are copied. In case of individuals with equal fitness, the distance to the k-nearest neighbor for increasing k is used as further criterion. Given
d≥3, these methods require a runtime inO(dµ2) per generation [11].
ε-MOEA Laumanns et al. [14] proposed the ε-MOEA to combine the
con-vergence properties of an elitist MOEA like suggested by Rudolph and Agapie [15] with the need to preserve a diverse set of solutions. The objective space is divided into a grid of boxes, whose size can be adjusted by the choice ofε. Dom-inance is checked according to the boxes where the solutions are positioned. The archive E holds one solution for each non-dominated box. If the box of a new solution dominates other boxes in the archive, the associated archive members are rejected. In case of two solutions belonging to the same box, Laumanns et al. decline the new solution except it dominates the old one. Later, Deb et al. [6] propose to select the solution, which is closer to the best corner of the box. They also administrate a co-evaluated population P of constant size. If a new solu-tion is not dominated by any member of the populasolu-tion, it replaces a randomly chosen member favoring dominated solutions. They also suggest a steady-state approach, where the offspring is generated by a parent from P and a parent fromE. A binary tournament regarding the dominance relation is performed to choose the member ofPfor mating. If two non-dominated solutions are chosen, a random decision will be applied. The parent from E is chosen equiprobable. Because no further diversity measures need to be computed, the runtime of a generation ofε-MOEA isO(d|E|).
3.1 Experimental Results
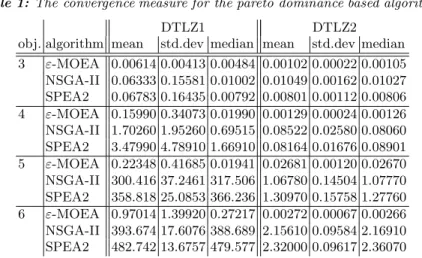
The results of the experiments are presented in Tab. 1 and Tab. 2. Like the following tables, these consist of two parts. The left part provides the information which algorithm and how many objectives were used while the results are placed in the right part. The results themselves are split in two parts regarding the concerned problem. Here, the left and the right column of each part yield the most interesting information for investigation, i.e. the mean and the median of the resulting values received by all runs performed. Next to the averaged values, the standard deviation (std.dev.) of the averaged values is stated.
NSGA-II and SPEA2 rapidly decrease in quality with increasing dimension of objective space. If more than four objectives are considered, these algorithms do not converge to the Pareto set as indicated by the high distance values (cf. Tab. 1). With dimension greater than four, no relative hypervolume is mea-sured because no point dominating the reference point is achieved (cf. Tab. 2). Further studies with these algorithms have been performed to exhibit if any convergence occurs with a higher number of function evaluations. As shown in Fig. 2, both algorithms increase the distance to the Pareto front in the first generations because the diversity based selection criteria favor higher distances
2 In PISA
Table 1:The convergence measure for the pareto dominance based algorithms.
DTLZ1 DTLZ2
obj. algorithm mean std.dev median mean std.dev median 3 ε-MOEA 0.00614 0.00413 0.00484 0.00102 0.00022 0.00105 NSGA-II 0.06333 0.15581 0.01002 0.01049 0.00162 0.01027 SPEA2 0.06783 0.16435 0.00792 0.00801 0.00112 0.00806 4 ε-MOEA 0.15990 0.34073 0.01990 0.00129 0.00024 0.00126 NSGA-II 1.70260 1.95260 0.69515 0.08522 0.02580 0.08060 SPEA2 3.47990 4.78910 1.66910 0.08164 0.01676 0.08901 5 ε-MOEA 0.22348 0.41685 0.01941 0.02681 0.00120 0.02670 NSGA-II 300.416 37.2461 317.506 1.06780 0.14504 1.07770 SPEA2 358.818 25.0853 366.236 1.30970 0.15758 1.27760 6 ε-MOEA 0.97014 1.39920 0.27217 0.00272 0.00067 0.00266 NSGA-II 393.674 17.6076 388.689 2.15610 0.09584 2.16910 SPEA2 482.742 13.6757 479.577 2.32000 0.09617 2.36070
between solutions. Special emphasis is given to extremal solutions with values near zero in one or more objectives. These solutions remain non-dominated and the distance cannot be decreased thereafter.
0 100 200 300 400 500 600 100000 200000 300000 400000 500000 600000 700000 800000 900000 1e+006 convergence measure function evaluations NSGA-II SPEA2 NSGA-II with modified crowding distance
ε-MOEA archive ε-MOEA population Fig. 2: Convergence measure during the optimiza-tion run performing the median result on six-objective DTLZ1.
To confirm this assumptions and improve NSGA-II in the many-objective case, a slight modification of crowding distance is studied. Originally, an in-dividual without a neighbor regarding one dimension of the objective space is assigned an infinite crowding distance. Instead of that, a value of zero is used, causing that non-dominated solutions with extremal values are rejected. Al-though this variant is not able to converge to the Pareto front, an improvement of the average distance within the first 100,000 function evaluations is obvious (Fig. 2). Then, most of the decision variables have reached their optimal value.
Only one or two of them remain in a local optimum. This experiment shows that a diversity measure with emphasis on a spread of the population can misguide the MOEA to deterioration and the loss of promising non-dominated solutions.
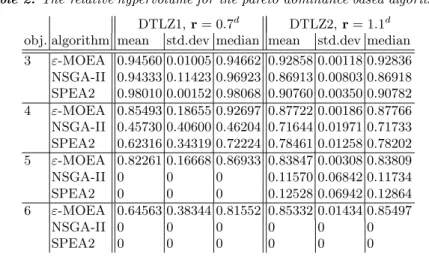
Table 2:The relative hypervolume for the pareto dominance based algorithms.
DTLZ1,r= 0.7d
DTLZ2,r= 1.1d
obj. algorithm mean std.dev median mean std.dev median 3 ε-MOEA 0.94560 0.01005 0.94662 0.92858 0.00118 0.92836 NSGA-II 0.94333 0.11423 0.96923 0.86913 0.00803 0.86918 SPEA2 0.98010 0.00152 0.98068 0.90760 0.00350 0.90782 4 ε-MOEA 0.85493 0.18655 0.92697 0.87722 0.00186 0.87766 NSGA-II 0.45730 0.40600 0.46204 0.71644 0.01971 0.71733 SPEA2 0.62316 0.34319 0.72224 0.78461 0.01258 0.78202 5 ε-MOEA 0.82261 0.16668 0.86933 0.83847 0.00308 0.83809 NSGA-II 0 0 0 0.11570 0.06842 0.11734 SPEA2 0 0 0 0.12528 0.06942 0.12864 6 ε-MOEA 0.64563 0.38344 0.81552 0.85332 0.01434 0.85497 NSGA-II 0 0 0 0 0 0 SPEA2 0 0 0 0 0 0
The performance ofε-MOEA highly depends on the choice ofε. We choose it such that E finally contains about 100 solutions3. The ε-MOEA is able to
produce optimal solutions within the allowed number of function evaluations for all considered numbers of objectives. This is shown in the lower left part of figure 2. The active dominance-preserving function of the archive, combined with an utopia point distance criterion for non-dominated individuals in the same hyperbox avoids the effects of deterioration and thus ensures convergence even for the co-evolving set P. Though, the hypergrid guarantees an uniform distribution of individuals, the obtained hypervolume values are only for DTLZ2 competitive with the best considered algorithms. This is due to the trend of the hyperbox method to avoid extremal solutions, as described by Deb et al. [6].
4
Aggregation-based EMOA
Basic aggregation methods are single-objective optimizers, which multiply the objective values with weights and accumulate them to a scalar value. The EMOA considered here, enhance aggregation concepts in order to produce a set of solu-tions. In contrast to the other EMOA considered, aggregation-based approaches require the a priori definition of relations between objective functions. This re-sults in a certain focus during the optimization.
3
d=3, DTLZ1:ε= (0.03,0.03,0.03), DTLZ2:ε= (0.058,0.058,0.058).
d=4, DTLZ1:ε= (0.047,0.047,0.047,0.047), DTLZ2:ε=(0.125, 0.125, 0.125, 0.125).
d=5, DTLZ1:ε= (0.057, . . . ,0.057), DTLZ2,ε= (0.18, . . . ,0.18).
MSOPS Multiple Single Objective Pareto Sampling (MSOPS) does not feature Pareto methods, but handles all objectives in parallel. The decision maker has to chooseT vectors of weights for every objective function to enable an aggregation. Hughes [16] recommends weightedmin-max (MSOPS 1) and a combination of this approach withVector-Angle-Distance-Scaling (VADS)calleddual optimisa-tion (MSOPS 2). Depending on the aggregation strategy, one receives a set of
T or 2T aggregated scores per solution. The scores are held in a score matrixS, where each row belongs to a solution and each column represents an aggregated score. Each column of the matrixS is ranked, giving the best performing pop-ulation member rank one. The rank values are stored in a matrix R. Each row of R is sorted ascending, allowing in a lexicographical order of the individuals. The runtime is inO(µT d) for the computation of the aggregated scores, and in
O(µTlogT) andO(T µlogµ) respectively to perform the sort of the rows and columns. Thus, the runtime of MSOPS isO(µT(d+logT+logµ) per generation. Obviously, the choice of weight vectors determines the distribution proper-ties of MSOPS. Each weight vectorw= (w1, . . . , wd) corresponds to a direction,
analytically given by a target vector starting in the origin. The aim of the aggre-gation methods is to reach the point on the corresponding direction vector which is as close as possible to the origin. To this end, weighted min-max focuses on the distance to the origin, while V ADS favors solutions whose position vector has a small intersecting angle with the target vector.
Since our comparative study aims at an approximation of the whole Pareto front in order to maximize the covered hypervolume, an aprobriate set of weights has to be chosen. In Hughes [3] benchmarking ’50 target vectors spread uniformly across the search space’ are used. The target vectorst= (t1, . . . , td) are created
by calculating an initial number of steps s=b√d
Tcand constructing each possi-ble vector containing multiples of 1/sbetween 0 and 1. Afterward, these target vectors are normalized and doubles are removed. If the number of targets is lower as desired, sis incremented and the procedure is repeated. At the end, a next neighbor technique is used to prune the set of target vectors to the desired size. Because the PISA implementation of MSOPS uses weight vectors, a transforma-tion of the target vectors into weights is necessary. The authors recommend – deviant from Hughes [3] – the following procedure for transformation, that can also be used to transform a set of utopia or reference points into weights and avoids numerically unstable calculations in many cases.
From the aggregation methods can be referred that a weight vector for a specified target fulfills the followingd−1 conditions:
w1·t1=w2·t2, w2·t2=w3·t3, . . . wd−1·td−1=wd· · ·td
The normalizing conditionw1+. . .+wd= 1 is added in order to obtain a
com-pletely defined system of equations. Thus, the components of the corresponding weight vector can be computed as follows:
wi= Q j6=itj Pd k=1 Q j6=ktj (i= 1, . . . , d) (1)
To extremal solutions with value 0 in d−1 objectives, a small ε needs to be added to allow the above calculation. Hughes [16] generally recommends to use a number of target vectors that is lower than the population size. Besides, he states that the number of target vectors has to be increased for more objectives. To cover both needs, three different sets of target vectors are used. The first contains 50 vectors, the second 100 vectors, and the third 200 vectors.
RSO A restart strategy of a conventional single-objective evolutionary opti-mizer is applied as well and abbreviated RSO (Repeated Single Objective) ac-cording to Hughes [3]. Here, a single-objective run is performed for each of the 100 weight vectors. Thus, the number of function evaluations has to be divided among them, resulting in only 300 evaluations per run. The derandomized muta-tion operator by Ostermeier et al. [17] is applied in a (1,10)-evolution strategy. This operator was a first step towards the popular Covariance Matrix Adapta-tion (CMA) operator by Hansen and Ostermeier [18], which is known to produce good results within limited function evaluations [19]. To handle multiple objec-tives in a single-objective EA, the weighted min-max approach was chosen like in MSOPS.
4.1 Experimental Results
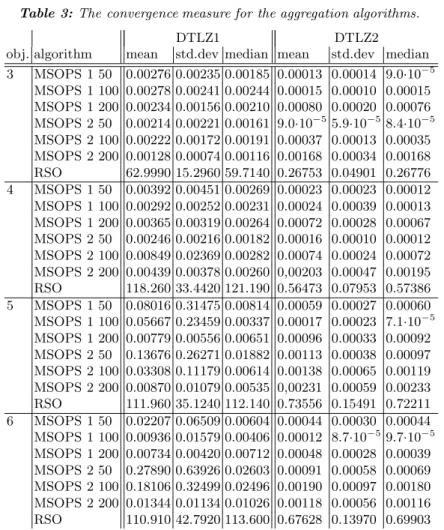
The methods using aggregation show an obvious convergence in all scenarios considered because they benefit from the property of the min-max method to minimize all objectives at once. While MSOPS obtains very promising results, RSO does not succeed in reaching the Pareto front. This is due to a too small number of function evaluations per run and the loss of information with every restart. Confirming the observations of Hughes [3], RSO outperforms NSGA-II and SPEA2 in case of five and six objectives.
Almost all variants of MSOPS attain very low average distances indicating that only optimal solutions have been found. Only for five or six objectives, variants using a lower number of target vectors fail to converge to the Pareto front in some of the runs. In the table, this behavior can be inferred from a high standard deviation and high differences between the mean and the median value. From the obtained hypervolume can be concluded that the distribution prop-erties can be slightly improved by the supporting use of VADS. Hughes assump-tion that the number of target vectors should be increased if more objectives are concerned is confirmed. For three objectives, the variants of MSOPS using 50 target vectors obtain the maximal hypervolume among the aggregation methods. With increasing objectives, the best values can be obtained with a higher num-ber of target vectors. In general, the results show that the method used to design the target vectors is able to generate well distributed Pareto front approxima-tions. Even for three objectives, NSGA-II and ε-MOEA (DTLZ1), respectively NSGA-II and SPEA2 (DTLZ2) can be outperformed regarding the S-metric. Note that the given method to generate the target vectors only performs well on continuous Pareto fronts. As observed by Hughes [16], a refinement of the
Table 3: The convergence measure for the aggregation algorithms.
DTLZ1 DTLZ2
obj. algorithm mean std.dev median mean std.dev median 3 MSOPS 1 50 0.00276 0.00235 0.00185 0.00013 0.00014 9.0·10−5 MSOPS 1 100 0.00278 0.00241 0.00244 0.00015 0.00010 0.00015 MSOPS 1 200 0.00234 0.00156 0.00210 0.00080 0.00020 0.00076 MSOPS 2 50 0.00214 0.00221 0.00161 9.0·10−55.9·10−58.4·10−5 MSOPS 2 100 0.00222 0.00172 0.00191 0.00037 0.00013 0.00035 MSOPS 2 200 0.00128 0.00074 0.00116 0.00168 0.00034 0.00168 RSO 62.9990 15.2960 59.7140 0.26753 0.04901 0.26776 4 MSOPS 1 50 0.00392 0.00451 0.00269 0.00023 0.00023 0.00012 MSOPS 1 100 0.00292 0.00252 0.00231 0.00024 0.00039 0.00013 MSOPS 1 200 0.00365 0.00319 0.00264 0.00072 0.00028 0.00067 MSOPS 2 50 0.00246 0.00216 0.00182 0.00016 0.00010 0.00012 MSOPS 2 100 0.00849 0.02369 0.00282 0.00074 0.00024 0.00072 MSOPS 2 200 0.00439 0.00378 0.00260 0,00203 0.00047 0.00195 RSO 118.260 33.4420 121.190 0.56473 0.07953 0.57386 5 MSOPS 1 50 0.08016 0.31475 0.00814 0.00059 0.00027 0.00060 MSOPS 1 100 0.05667 0.23459 0.00337 0.00017 0.00023 7.1·10−5 MSOPS 1 200 0.00779 0.00556 0.00651 0.00096 0.00033 0.00092 MSOPS 2 50 0.13676 0.26271 0.01882 0.00113 0.00038 0.00097 MSOPS 2 100 0.03308 0.11179 0.00614 0.00138 0.00065 0.00119 MSOPS 2 200 0.00870 0.01079 0.00535 0,00231 0.00059 0.00233 RSO 111.960 35.1240 112.140 0.73556 0.15491 0.72211 6 MSOPS 1 50 0.02207 0.06509 0.00604 0.00044 0.00030 0.00044 MSOPS 1 100 0.00936 0.01579 0.00406 0.00012 8.7·10−59.7·10−5 MSOPS 1 200 0.00734 0.00420 0.00712 0.00048 0.00028 0.00039 MSOPS 2 50 0.27890 0.63926 0.02603 0.00091 0.00058 0.00069 MSOPS 2 100 0.18106 0.32499 0.02496 0.00190 0.00097 0.00180 MSOPS 2 200 0.01344 0.01134 0.01026 0.00118 0.00056 0.00116 RSO 110.910 42.7920 113.600 0.67628 0.13970 0.69903
targets is necessary for more complicated problems. Discontinuous Pareto fronts lead to an approximation of the ’objective front’[16], i.e. the intersection of the target vectors with the domain of objectives. Thus, the approximation reached with wide spread target vectors can obtain solutions that are not optimal in sense of Pareto optimality. An evaluation of the aggregated values reached by the individuals in the final population is necessary to identify target vectors that support these solutions and accordingly refine the set of target vectors4.
4
In real-world applications with unknown Pareto fronts, the above approach can be helpful to find discontinuities and other informations about the shape of the Pareto front. But, it has to be kept in mind that a refinement is necessary to find optimal trade-offs.
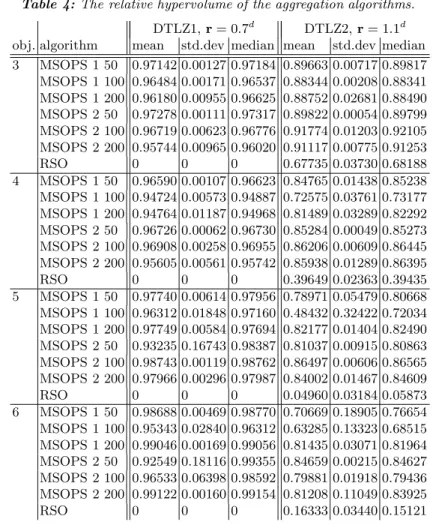
Table 4:The relative hypervolume of the aggregation algorithms.
DTLZ1,r= 0.7d
DTLZ2,r= 1.1d
obj. algorithm mean std.dev median mean std.dev median 3 MSOPS 1 50 0.97142 0.00127 0.97184 0.89663 0.00717 0.89817 MSOPS 1 100 0.96484 0.00171 0.96537 0.88344 0.00208 0.88341 MSOPS 1 200 0.96180 0.00955 0.96625 0.88752 0.02681 0.88490 MSOPS 2 50 0.97278 0.00111 0.97317 0.89822 0.00054 0.89799 MSOPS 2 100 0.96719 0.00623 0.96776 0.91774 0.01203 0.92105 MSOPS 2 200 0.95744 0.00965 0.96020 0.91117 0.00775 0.91253 RSO 0 0 0 0.67735 0.03730 0.68188 4 MSOPS 1 50 0.96590 0.00107 0.96623 0.84765 0.01438 0.85238 MSOPS 1 100 0.94724 0.00573 0.94887 0.72575 0.03761 0.73177 MSOPS 1 200 0.94764 0.01187 0.94968 0.81489 0.03289 0.82292 MSOPS 2 50 0.96726 0.00062 0.96730 0.85284 0.00049 0.85273 MSOPS 2 100 0.96908 0.00258 0.96955 0.86206 0.00609 0.86445 MSOPS 2 200 0.95605 0.00561 0.95742 0.85938 0.01289 0.86395 RSO 0 0 0 0.39649 0.02363 0.39435 5 MSOPS 1 50 0.97740 0.00614 0.97956 0.78971 0.05479 0.80668 MSOPS 1 100 0.96312 0.01848 0.97160 0.48432 0.32422 0.72034 MSOPS 1 200 0.97749 0.00584 0.97694 0.82177 0.01404 0.82490 MSOPS 2 50 0.93235 0.16743 0.98387 0.81037 0.00915 0.80863 MSOPS 2 100 0.98743 0.00119 0.98762 0.86497 0.00606 0.86565 MSOPS 2 200 0.97966 0.00296 0.97987 0.84002 0.01467 0.84609 RSO 0 0 0 0.04960 0.03184 0.05873 6 MSOPS 1 50 0.98688 0.00469 0.98770 0.70669 0.18905 0.76654 MSOPS 1 100 0.95343 0.02840 0.96312 0.63285 0.13323 0.68515 MSOPS 1 200 0.99046 0.00169 0.99056 0.81435 0.03071 0.81964 MSOPS 2 50 0.92549 0.18116 0.99355 0.84659 0.00215 0.84627 MSOPS 2 100 0.96533 0.06398 0.98592 0.79881 0.01918 0.79436 MSOPS 2 200 0.99122 0.00160 0.99154 0.81208 0.11049 0.83925 RSO 0 0 0 0.16333 0.03440 0.15121
5
Indicator-based EMOA
The termindicator-based EA (IBEA)was introduced by Zitzler and K¨unzli [20] for EMOA guided by a general preference information. The EMOA’s selection operator uses a preference function (indicator) as a single-objective substitute for thed-dimensional objective function. In contrast to the aggregation methods, this preference information describes a general aim. No specification of weights or targets is needed. As already stated in Sec. 1, classic EMOA use two ranking criteria: one regarding the dominance relation and the other for distribution aspects. Here, a single indicator is used to optimize a desired property of the approximation set.
IBEA In Zitzler’s and K¨unzli’s [20] IBEA framework, binary performance met-rics that map an ordered pair of individuals to a scalar value are suggested as
indicator functions. Each individual is compared with all others, thus O(µ2)
indicator values must be calculated. A suitable indicator has to be dominance preserving[20], which sloppily means that the indicator must not evaluate a vec-tor better than another that dominates it. Two efficiently computable indicavec-tors have been suggested in [20]. The additive-indicator subsumes the translations in each dimension of objective space that are necessary to create a weakly dom-inated solution. The hypervolume indicator measures the domdom-inated hypervol-ume that is only dominated by one vector and not by the other. Both indicators can be computed in linear time regarding the dimension of the objective space. This results in a runtime O(µ2d) per generation. For both indicators, negative
values mean that the first individual of the argument pair dominates the other. For each individual, its indicator values are charged in a sum of an exponential function to get a fitness value
F(x(1)) = X
x(2)∈P\{x(1)}
−e−I(x(2),x(1))/κ. (2)
A positive scaling constant is invoked, which is chosen as κ = 0.05 as rec-ommended in [20] for the applied adaptive variant of IBEA, which works on normalized indicator values. For dominance preserving indicators holds that the fitness value of a vector is worse than the fitness value of a vector that dominates it.
SMS-EMOA The S-metric Selection-EMOA (SMS-EMOA) by Emmerich et al. [21, 10] aims at maximizing the S-metric value of the population. This op-timization aim rewards progression toward the Pareto front as well as a good distribution of individuals. The maximalS-metric value is reached by the Pareto front. Thus, optimizing theS-metric value is a very general purpose. Contrary to most other EMOA, a steady-state selection scheme and an equiprobable mating selection are applied. SMS-EMOA invokes the non-dominated sorting procedure as primary selection criterion and the selection occurs among the members of the worst ranked front. The secondary criterion applied to the last front is the hypervolume contribution, which is defined as the exclusively dominated hy-pervolume of an objective vector. The individual with the lowest hyhy-pervolume contribution is discarded. Experiments show that the non-dominated sorting can alternatively be omitted, which hardly influences the algorithms performance. The runtime of a generation of SMS-EMOA isO(µd/2+1) as described by Beume
and Rudolph [22].
5.1 Experimental Results
As can be inferred from the convergence measure, both IBEA variants reach the Pareto front of DTLZ2. On DTLZ1, only IBEA+ converges towards the Pareto
front for all dimensions. IBEAHD reaches a very good distance value on DTLZ1
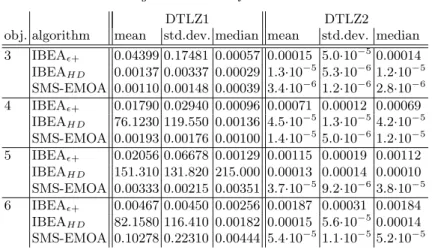
Table 5:The convergence measure of the indicator-based EMOA.
DTLZ1 DTLZ2
obj. algorithm mean std.dev. median mean std.dev. median 3 IBEA+ 0.04399 0.17481 0.00057 0.00015 5.0·10−5 0.00014 IBEAH D 0.00137 0.00337 0.00029 1.3·10−55.3·10−6 1.2·10−5 SMS-EMOA 0.00110 0.00148 0.00039 3.4·10−61.2·10−6 2.8·10−6 4 IBEA+ 0.01790 0.02940 0.00096 0.00071 0.00012 0.00069 IBEAH D 76.1230 119.550 0.00136 4.5·10−51.3·10−5 4.2·10−5 SMS-EMOA 0.00193 0.00176 0.00100 1.4·10−55.0·10−6 1.2·10−5 5 IBEA+ 0.02056 0.06678 0.00129 0.00115 0.00019 0.00112 IBEAH D 151.310 131.820 215.000 0.00013 0.00014 0.00010 SMS-EMOA 0.00333 0.00215 0.00351 3.7·10−59.2·10−6 3.8·10−5 6 IBEA+ 0.00467 0.00450 0.00256 0.00187 0.00031 0.00184 IBEAH D 82.1580 116.410 0.00182 0.00015 5.6·10−5 0.00014 SMS-EMOA 0.10278 0.22310 0.00444 5.4·10−51.1·10−5 5.2·10−5
normalization of objective values to [0,1], tending the hypervolume indicator to favor extremal solutions, which hinder the progression.
Surprisingly, the IBEA+ using the additive -indicator reaches better S
-metric values than the IBEAHD invoking the hypervolume indicator. The
con-sideration of translation lengths in the additive-indicator causes a good distri-bution of solutions. Contrary, the approximation of the hypervolume contribu-tion through the binary hypervolume indicator tends to spiral downward with increasing dimension of objective space. Both adaptive IBEA fail to produce a good distribution on DTLZ1, which we ascribe to the high-scaled co-domain and the resulting difficulties in the scaling of the fitness values.
Table 6: The relative hypervolume of the indicator-based algorithms.
DTLZ1,r= 0.7d
DTLZ2,r= 1.1d
obj. algorithm mean std.dev. median mean std.dev median 3 IBEA+ 0.77693 0.03182 0.78033 0.92991 0.00075 0.93002 IBEAH D 0.73929 0.03144 0.74208 0.92023 0.00071 0.92008 SMS-EMOA 0.98352 0.00071 0.98387 0.93870 6.3·10−5 0.93873 4 IBEA+ 0.82920 0.02445 0.83425 0.89477 0.00059 0.89484 IBEAH D 0.51417 0.35620 0.70647 0.88633 0.00090 0.88619 SMS-EMOA 0.97612 0.00034 0.97627 0.90370 6.4·10−5 0.90368 5 IBEA+ 0.87018 0.02777 0.86961 0.88571 0.00097 0.88584 IBEAH D 0.26292 0.33673 0 0.88250 0.00122 0.88259 SMS-EMOA 0.99182 0.00019 0.99182 0.89619 9.5·10−5 0.89624 6 IBEA+ 0.89146 0.03569 0.90029 0.89283 0.00130 0.89322 IBEAH D 0.40153 0.30853 0.53634 0.88431 0.02231 0.89124 SMS-EMOA 0.96688 0.06741 0.99698 0.90483 0.00014 0.90481
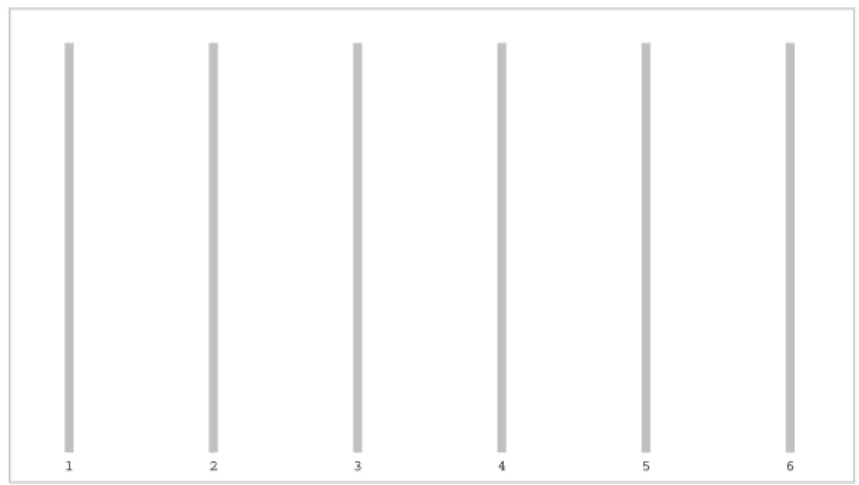
1 2 3 4 5 6 0,0 0,2 0,4 0,6 0,8 1,0
Fig. 3:Results of one run of SMS-EMOA on six-objective DTLZ2. In the parallel plot, each column corresponds to one objective.
SMS-EMOA reaches the best S-metric values of all considered algorithms. The distance values are very good as well and all runs except one reached the Pareto front. This run on six-objective DTLZ1 stagnated since one decision variable –which defines the distance– remains static at a non-optimal value due to an unusual loss of diversity in decision space in the beginning of the optimization process. Since the selector modules in PISA only decide regarding the objective values, this effect cannot be blamed to the selection properties of SMS-EMOA. Figure 3 exemplarily pictures the distribution of an usual six-objective result set of SMS-EMOA in a parallel plot. Every objective is covered and the structure of the set is almost symmetric, indicating a uniformly spread distribution of solutions over the whole Pareto front.
6
Summary and Outlook
The bad performance of early Pareto-based methods like NSGA-II and SPEA2 observed by Hughes [3] and Purshouse and Fleming [2] is confirmed. They show a rapid degradation with increasing number of objectives. Some additional studies show that they do not converge to the Pareto front at all and stagnate far away from it. The performance of ε-MOEA refutes the hypothesis of Hughes that a Pareto-based approach cannot succeed on many-objective problem instances. Instead, favoring extremal solutions has been shown to hinder the progression in many-objective spaces, which is also obviously for IBEA.
It is shown that more recent EMOA using indicators, which feature more than just distribution aspects, perform very well in many-objective optimization. Es-pecially, SMS-EMOA, which optimizes the population’s dominated hypervolume, outperforms the other algorithms on all considered test functions. Moreover, an aggregation-based EMOA, namely MSOPS, performs well with respect to con-vergence aspects. A sophisticated scheme for the generation of weight vectors
is introduced and also produces well distributed solution sets. In comparison to the simple restart strategy RSO, MSOPS benefits from structural equalities of good solutions by optimizing all weight vectors in parallel.
Future research will deepen the insights in the behavior of indicator-based al-gorithms in particular. Theoretical statements are aspired for the convergence of the MOEA showing promising results in this study. Statistically guided param-eter studies should be performed to obtain suitable parametrizations for many-objective problems. Especially, the size of the population and the offspring are to be studied. Furthermore, relations between the Pareto front and the Pareto set are studied all together resulting in new optimization techniques. These fea-ture good convergence and distribution properties in objective space as well as in decision space.
Acknowledgements
This work was supported by the Deutsche Forschungsgemeinschaft (DFG)as part of the Collaborative Research Center ’Computational Intelligence’ (SFB 531) and the
Transregional Collaborative Research Center 30as well as the research projectSCHW 361/15-1 ”Ein Verfahren zur Optimierung von aus Mehrkomponenten bestehenden Schiffsantrieben”.
References
1. Farina, M., Amato, P.: On the optimal solution definition for many-criteria opti-mization problems. In Keller, J., Nasraoui, O., eds.: Proc. of the NAFIPS-FLINT Int’l Conf. 2002, IEEE Press, Piscataway NJ (2002) 233–238
2. Purshouse, R.C., Fleming, P.J.: Evolutionary Multi-Objective Optimisation: An Exploratory Analysis. In: Proc. of the 2003 Congress on Evolutionary Computation (CEC’2003). Volume 3., Canberra, Australia, IEEE Press (2003) 2066–2073 3. Hughes, E.J.: Evolutionary Many-Objective Optimisation: Many Once or One
Many? In: Evolutionary Computation ’Congress (CEC’05), Edinburgh, UK. Vol-ume 1., IEEE Press, Piscataway NJ (2005) 222–227
4. Deb, K., Pratap, A., Agarwal, S., Meyarivan, T.: A Fast and Elitist Multiobjective Genetic Algorithm: NSGA–II. IEEE Transactions on Evolutionary Computation
6(2) (2002) 182–197
5. Bleuler, S., Laumanns, M., Thiele, L., Zitzler, E.: PISA — a platform and pro-gramming language independent interface for search algorithms. In Fonseca, C.M., et al., eds.: Evolutionary Multi-Criterion Optimization, 2nd Int’l Conf. (EMO 2003). LNCS 2632, Springer, Berlin (2003) 494 – 508
6. Deb, K., Mohan, M., Mishra, S.: A Fast Multi-objective Evolutionary Algorithm for Finding Well-Spread Pareto-Optimal Solutions. KanGAL report 2003002, Indian Institute of Technology, Kanpur, India (2003)
7. Deb, K.: Multi-Objective Optimization using Evolutionary Algorithms. Wiley, Chichester, UK (2001)
8. Deb, K., Thiele, L., Laumanns, M., Zitzler, E.: Scalable Multi-objective Optimiza-tion Test Problems. In: Proc. of the 2002 Congress on EvoluOptimiza-tionary ComputaOptimiza-tion (CEC 2002). Volume 1., IEEE Press, Piscataway NJ (2002) 825–830
9. Zitzler, E., Thiele, L.: Multiobjective Optimization Using Evolutionary Algorithms—A Comparative Case Study. In Eiben, A.E., ed.: Parallel Problem Solving from Nature V. LNCS 1498, Springer, Berlin (1998) 292–301
10. Naujoks, B., Beume, N., Emmerich, M.: Multi-objective optimisation using S-metric selection: Application to three-dimensional solution spaces. In: Evolution-ary Computation Congress (CEC’05), Edinburgh, UK. Volume 2., Piscataway NJ, IEEE Press (2005) 1282–1289
11. Jensen, M.T.: Reducing the run-time complexity of multiobjective EAs: The NSGA-II and other algorithms. IEEE Transactions On Evolutionary Computa-tion7(5) (2003) 503–515
12. Zitzler, E., Laumanns, M., Thiele, L.: SPEA2: Improving the Strength Pareto Evo-lutionary Algorithm. Technical Report 103, Computer Engineering and Networks Laboratory (TIK), Swiss Federal Institute of Technology (ETH) Z¨urich, Switzer-land (2001)
13. Silverman, B.W.: Density estimation for statistics and data analysis. Chapman and Hall, London (1986)
14. Laumanns, M., Thiele, L., Deb, K., Zitzler, E.: Combining convergence and di-versity in evolutionary multi-objective optimization. Evolutionary Computation
10(3) (2002) 263–282
15. Rudolph, G., Agapie, A.: Convergence properties of some multi-objective evolu-tionary algorithms. In Zalzala, A., Eberhart, R., eds.: Congress on Evoluevolu-tionary Computation (CEC2000). Volume 2., Piscataway NJ, IEEE Press (2000) 1010– 1016
16. Hughes, E.J.: Multiple Single Objective Pareto Sampling. In: Congress on Evolu-tionary Computation (CEC’03), IEEE Press, Piscataway NJ (2003)
17. Ostermeier, A., Gawelczyk, A., Hansen, N.: Step-size adaptation based on non-local use of selection information. In Davidor, Y., et al., eds.: Parallel Problem Solving from Nature (PPSN 1994). LNCS 866, Springer, Berlin (1994) 189–198 18. Hansen, N., Ostermeier, A.: Completely Derandomized Self-Adaptation in
Evolu-tion Strategies. IEEE ComputaEvolu-tional Intelligence Magazine9(2) (2001) 159–195 19. Naujoks, B., Willmes, L., Haase, W., B¨ack, T., Sch¨utz, M.: Multi-point airfoil
optimization using evolution strategies. In: European Congress on Computa-tional Methods in Applied Sciences and Engineering (ECCOMAS’00) (CD-Rom and Book of Abstracts), Center for Numerical Methods in Engineering (CIMNE), Barcelona, Spain (2000) 948
20. Zitzler, E., K¨unzli, S.: Indicator-based selection in multiobjective search. In Yao, X., et al., eds.: 8th Int’l Conf. on Parallel Problem Solving from Nature (PPSN VIII), UK, Springer (2004) 832–842
21. Emmerich, M., Beume, N., Naujoks, B.: An EMO algorithm using the hypervolume measure as selection criterion. In Coello, C.A.C., et al., eds.: Evolutionary Multi-Criterion Optimization: 3rd Int’l Conf. (EMO 2005), Springer, Berlin (2005) 62–76 22. Beume, N., Rudolph, G.: Faster S-Metric Calculation by Considering Dominated Hypervolume as Klee’s Measure Problem. In: International Conference on Com-putational Intelligence (CI 2006). (2006) (in print).