On Traffic Types and Service Classes in the Internet
Mansour J. Karam, Fouad A. Tobagi
Abstract—In today’s Internet, various traffic types having different
char-acteristics and requirements (e.g., voice, video, best effort) share the same resources. In order to provide services that are appropriate to each, both the IETF and IEEE 802 have proposed a support for traffic differentiation. In both cases, service classes corresponding to separate queues are identi-fied, and packets are marked according to their class, which in turn defines the treatment they will get at each hop in the network. Using realistic mod-els to represent each of the various traffic types, we identify those that can be mixed in the same queue without bearing a significant loss in through-put; correspondingly, we make recommendations on how to map different traffic types to the available service classes.
I. INTRODUCTION
The majority of Internet traffic today is generated by tradi-tional data applications; such traffic is for the most part bursty, and is well served by the best-effort service that the Internet pro-vides. With the growth and ubiquity of the Internet witnessed in recent years, new applications are being contemplated, intro-ducing new traffic types and new requirements, which in turn re-quire new services from the network which cater to these charac-teristics and requirements. Furthermore, as the Internet becomes a network on which many businesses rely, it becomes crucial for the network response time to be unaffected by increases in the load on the network.
Both the IEEE 802 committee and the Internet Engineering Task Force (IETF) have proposed protocols and mechanisms that would allow the Internet to provide the services needed by the new applications. Within the IETF, the relevant activities are those of the Integrated Services (Intserv [17]) and Differ-entiated Services (Diffserv [19]). Given Intserv’s well known scalability issues, we focus in this study on the more promising Diffserv architecture. In this context, the DS-field of different packets are marked with DSCPs (DS Code Points) correspond-ing to the treatment they will get at each hop in the network, re-ferred to as Per Hop Behavior (PHB). Two PHBs have been pro-posed: Expedited Forwarding (EF [20]), designed for real-time applications that have stringent delay constraints (such as voice and video applications), and Assured Forwarding (AF [21]), de-signed to provide a predictable service for business applications. In the IEEE 802 committee, the relevant activity resulted in a revision of the IEEE bridging standard 802.1D [16] which in-cludes support for expedited traffic capabilities - i.e., priority functions - in the switches; as in Diffserv, different packets are marked with a field specifying the class of service they belong to, corresponding to a specific treatment they get at each hop in the network. More specifically, seven types of traffic are identi-fied and differentiated, given the potential applications and their requirements; these are, in order of priority: (1) Network con-trol, which includes packets that support network infrastructure and that must be delivered as quickly as possible; (2) Voice and (3) Video, which principal requirement is bounded delay and The authors are with the Computer Systems Laboratory, Stanford University, Stanford CA 94305 USA (e-mail: {mans, tobagi}@stanford.edu). This work was supported in part by 3Com corporation.
TABLE I
SUGGESTED MAPPING OF THE TRAFFIC TYPES TO THE AVAILABLE PRIORITY LEVELS INIEEE 802.1D.
Number of Priority Classes 7 6 5 4 3 2 1 Traffic Types Network Control NC VO VO VO VO Voice (10ms) VO VO Video (100ms) VI VI VI CL CL Controlled Load CL CL CL BE Excellent Effort EE EE BE BE Best Effort BE BE BE BE Background BK BK BK BK
loss; (4) Controlled load, which (similarly to AF) includes traf-fic from important business applications, (5) Excellent and (6) Best Effort, which consists of LAN and Internet traffic as we know it today1. Finally, (7) Background traffic pertains activities
which should not impact the use of the network by other users (e.g. backups). Accordingly, the standard specifies up to eight levels of priority (also referred to as traffic classes), and recom-mends an appropriate mapping between the seven traffic types and the available traffic classes, that is function of the number of available traffic classes (see Table I2).
Note that a similar packet marking technique and per-hop treatment concept are used in IEEE 802.1D and Diffserv. Also, both architectures consider that each traffic class corresponds conceptually to a separate queue. In both cases, the adequacy of a mapping between traffic types and traffic classes is primor-dial. Indeed, if dissimilar traffic types (in terms of character-istics and requirements) are assigned to the same queue, then an excessively low limit may have to be placed on the amount of aggregate traffic so that all traffic types meet their respective requirements. Even though the areas of traffic characterization and traffic mix optimization have been actively researched in the past, (e.g., [1]-[15]) the work on mixing traffic of different types has often been characterized by the limited setting for the investigation (e.g. shared Ethernet LANs in [1] and [2], ring LAN in [3]). Also, models used for data and video traffic were not always in concordance with their actual characteristics, as revealed by a number of measurements studies conducted for video (e.g., [8]-[10]) and data traffic (e.g. [11]-[15]).
Accordingly, the main goal of this study is to identify which traffic types can be mixed together in the same queue without incurring a significant loss in throughput; based on this identifi-cation, an appropriate mapping of traffic types to service classes
When enough classes are provided, then relative priority can be given to Excellent Effort traffic.
When several traffic types are grouped together into a single priority level, one of them is identified as the defining type indicating that it is this traffic type’s requirements that are to be satisfied in that particular traffic class.
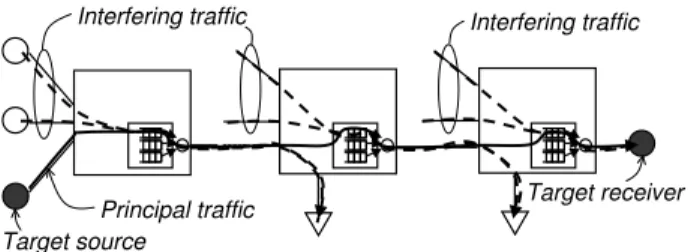
Fig. 1. Multi-hop, multiple class-of-service scenario.
is recommended, as a function of the network resources (band-width, buffer sizes). By the same token, it is possible to deter-mine the minimum number of classes needed in order to support a certain load of traffic and the traffic mix involved. To insure the relevance of our results, we use in our experiments realistic traffic types. It is hoped that the results will help (1) understand how traffic types should be mapped to different traffic classes and PHBs in LANs and WANs respectively and (2) in the defi-nition of appropriate admission control policies.
In Section II, we describe the approach used in this study. In Section III, we discuss the simulation results obtained. Fi-nally, we summarize the results of this paper in Section IV. A longer version of this paper can be found at http://www-mmnetworks.stanford.edu/.
II. APPROACHUSEDIN THISSTUDY
This study is performed by means of computer simulation, with each simulation experiment consisting of a network sce-nario and a traffic scesce-nario.
A. Network scenarios related aspects
Given the recent advances in LAN and WAN technologies, it is only useful to consider network structures consisting of full-duplex links interconnecting high performance switches. We consider service rates that correspond to widely deployed links: T1 (1.5 Mb/s), 10Base-T (10 Mb/s), T3 (45 Mb/s) and 100Base-T (100 Mb/s). We consider network scenarios with multiple classes-of-service (CoS), whereby each class-of-service is rep-resented by a separate output queue in the switch. Even though Strict Priority is used in our simulations, the results are essen-tially independent of the scheduling mechanism implemented in the switches3.
We consider first single traffic types and then various mixes of different traffic types, in network topologies with single and multiple classes of services. The multi-hop network scenario consists of a linear succession of switches. We identify one traf-fic source (generating traftraf-fic of a given type) as the target source and consider all other traffic to be interfering traffic (See Figure 1.) To be conservative, we consider the pessimistic scenario in which the interfering traffic is generated and injected at each hop, independently of the other hops in the path. In so doing, the delay components incurred at the various hops become to-tally independent of each other, and we are able to derive the A given service rate considered here corresponds to the total link bandwidth in the context of Strict Priority scheduling, and to the appropriate portion of total link bandwidth assigned to that particular queue in the context of Weighted Fair Queuing.
end-to-end delay over the entire path simply by taking the con-volution of single hop delay results.
B. Traffic generation aspects
In order to produce meaningful results, we pay particular at-tention to the model(s) used in generating each type of traffic. In this study we limit ourselves to voice, video and data traffic (the latter receiving both best-effort and “better than” best effort service, which we denote by assured service).
Voice. There are various ways to encode voice signals, e.g. Pulse Code Modulation (PCM) for G.711, Adaptive and Differ-ential Pulse Code Modulation (ADPCM) for G.726, and Code Excited Linear Prediction (CELP) techniques for encoders such as G.729A and G.723.1. Given the goal in this study, and given the low bit rate and low degree of traffic variation exhibited in a voice stream as compared to the other traffic types with which it might have to be mixed (e.g., video), the results are essentially independent of the specific voice encoding scheme. We thus consider voice to be encoded using ADPCM at a rate equal to 32 Kb/s and the encoded bit stream to be packetized in con-stant packets of 32 bytes payload each generated once every 8ms; adding the protocol overhead at the various layers of pro-tocols (RTP, UDP, IP and MAC layers), we end up with packets of about 90 bytes, and a bit stream of 90 Kb/s.
Video. The characteristics of encoded video (data rates and variability in time) vary tremendously according to the content (talking heads, motion pictures, commercials, etc.), the video compression scheme (H.261, MPEG-1, MPEG-2, H.263, etc.) and the video encoding control scheme (constant bit rate (CBR), open-loop variable bit rate (OL-VBR), constant quality vari-able bit rate (CQ-VBR, [7])). For a given content and a given compression scheme, the encoding control scheme determines the characteristics of the traffic. In particular, CBR produces a stream which has a relatively small degree of variation while CQ-VBR produces a stream with a much higher degree of varia-tion4. In accordance to the goal of this study, we consider video
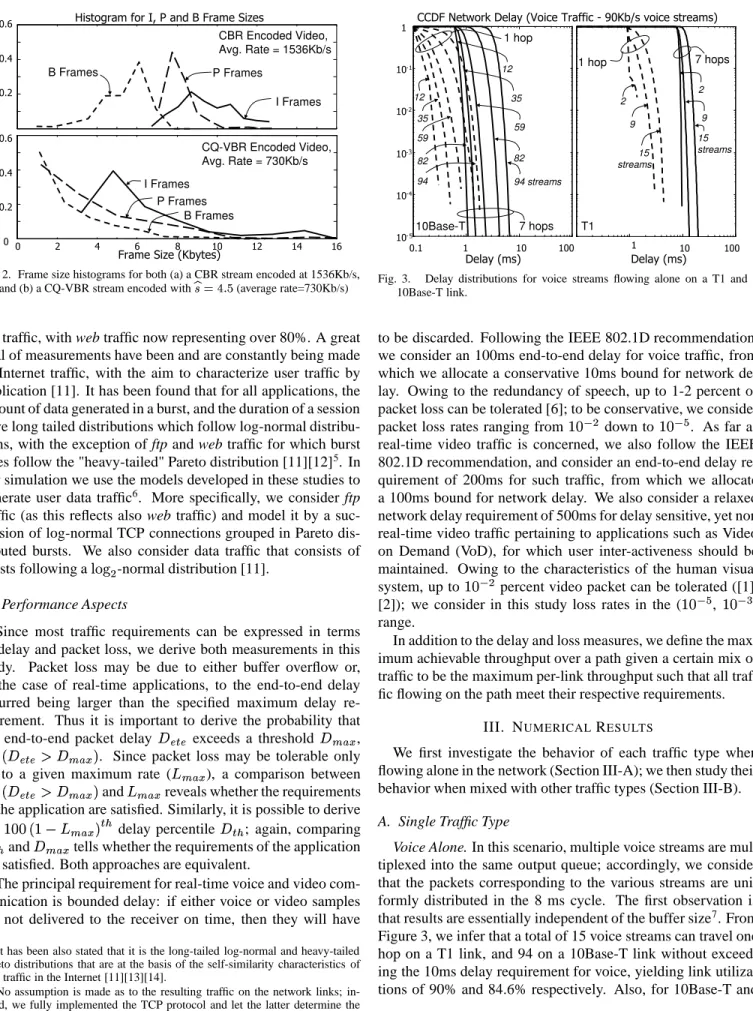
streams of both the CBR and the VBR types, and study their ef-fects on themselves and on other traffic types. More specifically, we select the third minute of Star Trek VI (characterized by a large degree of motion, abrupt camera movements, and numer-ous scene changes), encoded using MPEG-1, and generate dif-ferent bit streams by controlling the encoder according to both CBR, OL-VBR and CQ-VBR. There is sufficient variation in the encoded bit stream so that streams longer than one minute in duration are obtained by cycling through the same sequence over and over, and multiple streams are obtained by using the same sequence started at different points in time. (For more de-tails concerning the video encoding process, refer to [1].) As seen from Figure 2 (in which we plot the frame size histograms for video sequences generated using either CBR or VBR encod-ing control) the difference in traffic burstiness between the two sequences is clear.
Data Applications Traffic. Data application traffic (telnet, nntp, smtp, ftp, web) constitutes the majority of today’s
On the other hand, with CBR, unless the target rate and rate control buffer are chosen large enough, the quality of the encoded video may exhibit significant variations over time, while with CQ-VBR, the quality remains constant at the specified target level at all times.
Fig. 2. Frame size histograms for both (a) a CBR stream encoded at 1536Kb/s, and (b) a CQ-VBR stream encoded with
(average rate=730Kb/s)
net traffic, with web traffic now representing over 80%. A great deal of measurements have been and are constantly being made of Internet traffic, with the aim to characterize user traffic by application [11]. It has been found that for all applications, the amount of data generated in a burst, and the duration of a session have long tailed distributions which follow log-normal distribu-tions, with the exception of ftp and web traffic for which burst sizes follow the "heavy-tailed" Pareto distribution [11][12]5. In
our simulation we use the models developed in these studies to generate user data traffic6. More specifically, we consider ftp
traffic (as this reflects also web traffic) and model it by a suc-cession of log-normal TCP connections grouped in Pareto dis-tributed bursts. We also consider data traffic that consists of bursts following a -normal distribution [11].
C. Performance Aspects
Since most traffic requirements can be expressed in terms of delay and packet loss, we derive both measurements in this study. Packet loss may be due to either buffer overflow or, in the case of real-time applications, to the end-to-end delay incurred being larger than the specified maximum delay re-quirement. Thus it is important to derive the probability that the end-to-end packet delay exceeds a threshold ,
"!#$%. Since packet loss may be tolerable only
up to a given maximum rate (& ), a comparison between
!# % and& reveals whether the requirements
of the application are satisfied. Similarly, it is possible to derive the ')((
'+*,&-% .
delay percentile $. ; again, comparing . and tells whether the requirements of the application
are satisfied. Both approaches are equivalent.
The principal requirement for real-time voice and video com-munication is bounded delay: if either voice or video samples are not delivered to the receiver on time, then they will have
/
It has been also stated that it is the long-tailed log-normal and heavy-tailed Pareto distributions that are at the basis of the self-similarity characteristics of data traffic in the Internet [11][13][14].
0
No assumption is made as to the resulting traffic on the network links; in-stead, we fully implemented the TCP protocol and let the latter determine the burstiness in the link traffic, as this may be different in different network and traffic scenarios, and different depending on whether priority functions are in effect or not.
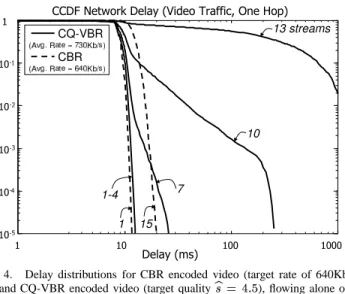
Fig. 3. Delay distributions for voice streams flowing alone on a T1 and a 10Base-T link.
to be discarded. Following the IEEE 802.1D recommendation, we consider an 100ms end-to-end delay for voice traffic, from which we allocate a conservative 10ms bound for network de-lay. Owing to the redundancy of speech, up to 1-2 percent of packet loss can be tolerated [6]; to be conservative, we consider packet loss rates ranging from'1(32
down to ')(3254 . As far as
real-time video traffic is concerned, we also follow the IEEE 802.1D recommendation, and consider an end-to-end delay re-quirement of 200ms for such traffic, from which we allocate a 100ms bound for network delay. We also consider a relaxed network delay requirement of 500ms for delay sensitive, yet non real-time video traffic pertaining to applications such as Video on Demand (VoD), for which user inter-activeness should be maintained. Owing to the characteristics of the human visual system, up to'1(32
percent video packet can be tolerated ([1], [2]); we consider in this study loss rates in the ('1( 254 , ')( 256 )
range.
In addition to the delay and loss measures, we define the max-imum achievable throughput over a path given a certain mix of traffic to be the maximum per-link throughput such that all traf-fic flowing on the path meet their respective requirements.
III. NUMERICALRESULTS
We first investigate the behavior of each traffic type when flowing alone in the network (Section III-A); we then study their behavior when mixed with other traffic types (Section III-B). A. Single Traffic Type
Voice Alone. In this scenario, multiple voice streams are mul-tiplexed into the same output queue; accordingly, we consider that the packets corresponding to the various streams are uni-formly distributed in the 8 ms cycle. The first observation is that results are essentially independent of the buffer size7. From Figure 3, we infer that a total of 15 voice streams can travel one hop on a T1 link, and 94 on a 10Base-T link without exceed-ing the 10ms delay requirement for voice, yieldexceed-ing link utiliza-tions of 90% and 84.6% respectively. Also, for 10Base-T and
7
We have observed that an increase in the buffer size increases the loss re-sulting from packets exceeding their delay bound, and reduces the loss rere-sulting from buffer overflow; however, the sum of these two components does not vary.
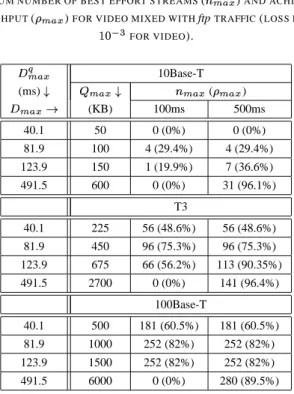
Fig. 4. Delay distributions for CBR encoded video (target rate of 640Kb/s) and CQ-VBR encoded video (target quality
), flowing alone on a 10Base-T link.
higher bandwidth links, the utilization does not decrease as the number of hops is increased to 7 (that is, the network delay in-curred remains below 10ms). Conversely, in the case of T1 links, the longer transmission times over 7 hops forbid more than 4 streams to be transmitted, limiting the throughput to 24%. In summary, owing to the characteristics of voice traffic, only for sub-T1 links must a limit be placed on the number of streams flowing alone in the network.
Video Alone. The same experiment is now repeated for video streams. As expected, the resulting delay behavior is mostly influenced by the encoding control scheme. In case of CBR video, owing to the steady nature of the generated traffic, the behavior is similar to voice: for links of bandwidth equal to or greater than 10Mb/s, most of the link bandwidth can be filled with CBR streams, and delays will remain below 100ms even for seven hops paths. (See Figure 4.)
However, in the case of VBR links, due to the variability of the generated traffic, the tail of the delay distribution sharply widens as the number of video streams is increased. In the sce-nario shown in Figure 4, network delay exceeds 100ms as soon as the number of video streams on the link exceeds 9, achieving a low 65% link utilization. In general, the results are affected by the burstiness of a particular stream (which increases with the quality metric and decreases with the quantization scale
for CQ-VBR and OL-VBR, respectively), and its rate relative to the link speed. (See Tables II and III.) In many cases, a limit must be set on the number of real-time VBR streams that can be multiplexed on the link. However, if we relax the maximum de-lay bound to 500ms, then significantly higher utilizations can be achieved for T1 and 10Base-T. (See Table II.) This suggests that video traffic pertaining to applications that have different delay requirements (e.g. 100ms versus 500ms) should be separated in different queues, specially on sub-10Base-T links.
B. Effect of Mixing Traffic Types
In this section, we look into the mixture of different traffic types, and their effect on each other. Our starting point is the mapping in Table I. Omitting excellent effort, background and network control traffic types, the appropriate mixes that emerge
TABLE II
MAXIMAL NUMBER OF STREAMS AND CORRESPONDING ACHIEVABLE THROUGHPUT(VBRVIDEO, T1AND10BASE-T).
Link T1 10Base-T Video Stream 100ms 500ms 100ms 500ms
VBR, 6
, 311Kb/s
(link BW/stream rate ratio) 4.8 32.1 Maximum number of streams 3 4 29 30
Achievable throughput 62.2% 82.9% 90.2% 93.3% CQ-VBR, 4 , 730 Kb/s
(link BW/stream rate ratio) 2.1 13.7 Maximum number of streams 0 1 9 12
Achievable throughput 0% 48.6% 65.7% 87.6%
TABLE III
MAXIMAL NUMBER OF STREAMS AND CORRESPONDING ACHIEVABLE THROUGHPUT(VBRVIDEO, T3AND100BASE-T).
Link T3 100Base-T Video Stream 100ms 500ms 100ms 500ms VBR, 6 , 311Kb/s
(link BW/stream rate ratio) 144.7 321.5 Maximum number of streams ~145 ~145 ~320 ~320
Achievable throughput ~100% ~100% ~100% ~100% CQ-VBR, 4 , 730 Kb/s
(link BW/stream rate ratio) 61.6 137.0 Maximum number of streams 54 58 ~125 ~125
Achievable throughput 87.6% 98% ~100% ~100%
are: data traffic with either voice or video traffic (Section III-B.1) and video with voice traffic (Section III-B.2).
B.1 Effect of Data Traffic on Voice and Video Traffic
In this section, the target and interfering traffic consists of either voice or video, and data traffic, respectively. We start with investigating the effect of data traffic on voice. For that, we mix 1Mb/s of voice traffic (11 streams) with TCP data traffic. Table IV (which shows the maximum number of data sources and the achievable throughput obtained if voice packets were still to satisfy their delay requirements) reveals that mixing voice and data traffic is impossible for T1 links. In the case of 10Base-T links, it is only possible for smtp-type flows, at the expense of a significant throughput reduction. Mixing ftp traffic with voice is only possible on 100Base-T links, in which case the link utilization must be kept below 20%. This result shows that data traffic, if neither policed nor shaped is incompatible with voice
TABLE IV
MAXIMUM NUMBER OF DATA SOURCES MIXED WITH VOICE TRAFFIC. Data source T1 10Base-T T3 100Base-T ( , )=( , 3) 0 80 (38.8%) >500 500 ( , )=( , 5) 0 0 213 (25.5%) 500 ftp 0 0 0 64 (20%)
TABLE V
MAXIMUM NUMBER OF BEST EFFORT STREAMS(
)AND ACHIEVABLE
THROUGHPUT(
)FOR VIDEO MIXED WITHftpTRAFFIC(LOSS RATE OF
FOR VIDEO). 10Base-T (ms) ( ) (KB) 100ms 500ms 40.1 50 0 (0%) 0 (0%) 81.9 100 4 (29.4%) 4 (29.4%) 123.9 150 1 (19.9%) 7 (36.6%) 491.5 600 0 (0%) 31 (96.1%) T3 40.1 225 56 (48.6%) 56 (48.6%) 81.9 450 96 (75.3%) 96 (75.3%) 123.9 675 66 (56.2%) 113 (90.35%) 491.5 2700 0 (0%) 141 (96.4%) 100Base-T 40.1 500 181 (60.5%) 181 (60.5%) 81.9 1000 252 (82%) 252 (82%) 123.9 1500 252 (82%) 252 (82%) 491.5 6000 0 (0%) 280 (89.5%)
traffic and should be separated from it. Hence, in the context of IEEE 802.1D, both traffic types should correspond to different traffic classes. In the context of Differentiated Services, in case voice and TCP data both use the Expected Forwarding PHB, we suspect that the much larger volume and burstiness of data traffic will be detrimental on voice traffic.
Replacing voice with real-time video8, the mixture becomes
possible owing to the relaxed delay requirement (100 instead of 10ms). Considering the large dependence of the results on the buffer size, we experiment with a range of buffer sizes cor-responding to the link speeds considered. Table V shows that the optimum buffer size is one that incurs a maximum buffer-ing delay slightly lower than the end-to-end delay bound (either 100ms or 500ms): the reason is that ftp sources need large buffer sizes, which they often fill, delaying video packets beyond their acceptable bound. Conversely, the provision of a buffer size that is too small increases the amount of buffer losses for both video and best effort traffic, in turn limiting the achievable throughput that could be obtained on the link; for instance, Figure 5 shows that for '1( ( ms, using a 450KBytes buffer minimizes
the total video loss when mixed with best effort traffic on a T3 link. Still, because of the reduction in the optimal buffer size, the total achievable throughput is reduced significantly by the addition of real-time video. If the end-to-end delay bound is relaxed to 500ms, then the appropriate buffer size increases pro-portionally, which results in a spectacular increase in throughput (to values that are close to 1). Hence, VoD video can potentially be mixed with Best Effort traffic on links of speed higher than 10Mb/s; note that throughput remains high for a wide range of buffer sizes below the optimal for T3 and 100Base-T links,
We consider both CBR and VBR streams. Since the volume of video is much lower than that of data, the results are largely independent of the specifics of the encoding control method.
Fig. 5. Buffer and Delay losses for VBR video traffic when mixed with best effort traffic on either a T3 link for various buffer sizes (225, 450 and 675KBytes) and a delay requirement of 100ms or a 10Base-T link for two buffer sizes (150K, 600K) and two delay requirements (100 and 500ms).
while it decreases very quickly around the optimal point for 10Base-T links. Hence, it only seems recommendable to mix VoD and best effort traffic on links of speed at least equal to 45Mb/s.
B.2 Mixing Voice and Video Traffic
We now assume the provision of separate low priority class(es) for data traffic, and investigate into the mixture of voice and video traffic in the high priority class. Accordingly, the tar-get and interfering streams consist of voice and video traffic, respectively. We experiment with a number of CBR and VBR streams, with a range of buffer sizes9and with all combinations
of voice and video mixes on the link. We present results for both a CBR stream encoded at 640Kb/s and a CQ-VBR stream en-coded with a target quality flowing on 10Base-T links.
Comments are then made on how to extend these results to other encoding schemes and link speeds.
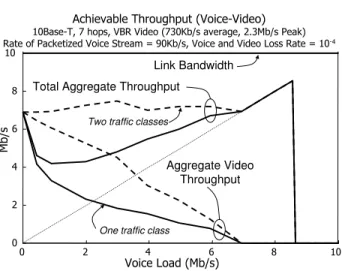
Voice mixed with CBR video. In case voice and video are sep-arated in two different classes, then the effect of video on voice traffic is very slight, resulting merely from the lack of preemp-tion. (See Figure 6.) If one traffic class is used instead, then the increase in voice delay remains contained, owing to the slow increase of CBR video delay as the number of such streams mul-tiplexed on the link increases. Consequently, voice delay only exceeds 10ms when the link becomes almost fully utilized. Re-peating the experiment for all voice and video mixtures, we plot in Figure 7.a the achievable throughput as a function of the voice traffic load. For all mixes, video traffic delay remains below the acceptable 100ms bound, and the observed decrease in achiev-able throughput only results from voice delay exceeding 10ms; this occurs when the link is heavily utilized, and so mixing voice and video barely affects the achievable throughput (the decrease is less than 9%).
For other link speeds and encoding schemes, similar behavior is observed except if the rate of the video stream is too large rela-tive to the link bandwidth, in which case the achievable through-put could decrease by as much as 50%. (For instance, we
Fig. 6. Delay distributions for voice and CBR video.
(a)
(b)
Fig. 7. Achievable throughput versus voice load for (a) CBR video and (b) VBR video.
Fig. 8. Delay distributions for voice and VBR video. TABLE VI
ACHIEVABLE THROUGHPUT FOR VOICE MIXED WITH VIDEO. T1 10Base-T T3 100Base-T VBR, , 311Kb/s 68% 88% >90% >90% CQ-VBR, , 730Kb/s 0% 50% 77% 83%
serve that only one video stream and two voice streams can be admitted on a T1 link, achieving a utilization as low as 55%.)
Voice mixed with VBR video. In line with the properties of VBR traffic discussed in Section II-B, the results obtained when voice and VBR video traffic are mixed in the same queue are fundamentally different: as the number of multiplexed video streams increases, the tail of the distribution shoots up notice-ably because of the long bursts that get injected into the queue. (See Figure 8.) As a result, for the scenario described in Figure 7.b, 10ms delay is incurred by voice packets as soon as five VBR streams are multiplexed on the channel, limiting the achievable throughput to 50%. In general, the achievable throughput de-pends on the voice/video mix and decreases down to 45% as we increase the portion of video in the mix. (See Figure 7.b.)
Similar results are observed for different encoding and com-pression schemes. For CQ-VBR, increasing yields burstier video traffic and hence lower utilizations, while for OL-VBR, the same effect is seen by reducing . The results are also
depen-dent on the rate of the stream relative to the link speed (see Table VI). Moreover, since the decrease in throughput results from voice traffic failing to meet its delay requirements, the results are unaffected by an increase in the end-to-end delay bound on VBR video, e.g., if real-time video is replaced with VoD video. In the context of IEEE 802.1D, the results suggest that CBR and VBR video should be differentiated. On the other hand, in the context of Differentiated Services, the results suggest that real-time VBR video using the EF PHB could have a detrimental effect on voice traffic using the same PHB.
IV. CONCLUSION
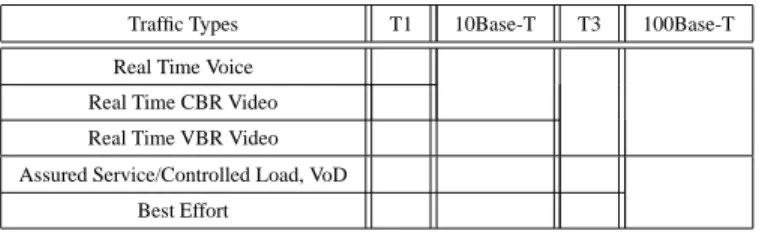
We present in Table VII our recommendation with respect to providing an appropriate mapping of traffic types to traffic classes. Clearly, the recommended number of traffic classes de-creases as the link speed inde-creases. For 100Base-T links, it is
TABLE VII
RECOMMENDED MAPPING OF TRAFFIC TYPES TO TRAFFIC CLASSES IN CASE OFT1, 10BASE-T, T3AND100BASE-TLINKS.
Traffic Types T1 10Base-T T3 100Base-T Real Time Voice
Real Time CBR Video Real Time VBR Video Assured Service/Controlled Load, VoD
Best Effort
only required to separate voice traffic from TCP data traffic; if voice were given its own class, then real-time video could still be accommodated in the best effort class if buffers are reason-ably sized and average utilization remains below 80%. However, mixing real-time video traffic with voice proves to be more ap-propriate since, in this case assured service and best effort traffic can together utilize more than 95% of the link bandwidth. For T3 links, the combination of VBR, CBR and voice only limits the achievable throughput to 75%. However, for 10Base-T, VBR video traffic should be separated from CBR and voice, as well as assured service traffic which should also be separated from best effort traffic. Finally, in the case of T1 links, a significantly higher throughput could be achieved when each traffic type is mapped to its own traffic class. In all cases, owing to their sim-ilar requirements, it seems most appropriate to mix VoD traffic with Assured Service traffic.
It is interesting to compare the findings of this study to the mappings recommended in the context of IEEE 802.1D and IETF Diffserv. In an attempt to retain the inherent simplicity in LANs, the mapping standardized by IEEE 802.1D associates the available traffic classes to individual applications, hence ig-noring the differences between variable and constant bit rate video; as can be seen by the results of this paper, such an over-simplification could, in some cases incur a loss of throughput. However, with the tremendous increase of bandwidth in LANs (100Mb/s, 1Gb/s and 10Gb/s soon), and the relatively low num-ber of individual flows in the network, one could argue that such a simplification will rarely affect performance. Conversely, by providing a flexible architecture, Diffserv allows a large number of applications to share the EF class. Consequently, voice traffic can share its queue with other, potentially bursty video and TCP traffic. The results of this study suggest that such an approach could be detrimental to voice performance.
REFERENCES
[1] F. Tobagi and I. Dalgic, "Performance Evaluation of 10Base-T and 100Base-T Ethernets Carrying Multimedia Traffic," IEEE Journal of Se-lected Areas in Communications, Vol. 14, No.7, Sept. 1996.
[2] I. Dalgic, W. Chien, and F. Tobagi, "Evaluation of 10Base-T and 100Base-T Ethernets Carrying Video, Audio and Data 100Base-Traffic," Proceedings of IEEE INFOCOM’ 94, Toronto, Canada, June 1994, pp 1094-1102. [3] J. Mark and B.-J. Lee, “A Dual-Ring LAN for Integrated Voice/Video/Data
Services,” Proceedings of IEEE INFOCOM’90, June 1990.
[4] M. Kadoch, A. K. Elhakeem, “A Distributed Queue Metropolitan Area Network for Combined Video, Voice, Wideband Data and Narrow-band Data,” Proceedings of IEEE GLOBECOM’89, Nov. 1989.
[5] R.-F. Chang and Victor O.K. Li, “Analysis of Packet Delay for an Inte-grated Voice-Data System,” Proceedings of IEEE GLOBECOM’88, Nov. 1988.
[6] J. G. Gruber and N. H. Le, "Performance Requirements for Integrated
Voice/Data Networks", IEEE Journal of Selected Areas in Communica-tions, Vol. SAC-1, pp.981-1005, Dec. 1983.
[7] I. Dalgic and F. Tobagi, "Constant Quality Video Encoding," Proceedings of IEEE ICC’95, Seattle, WA, June 1995.
[8] M. Garret, W. Willinger, “Analysis and Generation of Self-Similar VBR Video Traffic,” Proceedings of SIGCOMM’94, Sept. 94.
[9] C. Huang, M. Devetsikiotis, I. Lambadaris, and A. R. Kaye, “Modeling and Simulation of Self-Similar Variable Bit Rate Compressed Video: A Unified Approach”, Proceedings of SIGCOMM’95, Sept. 95.
[10] E. Mellaney and L. Orozco-Barbosa, “Experimental Study of MPEG-2 Video Traffic Over a Metropolitan ATM Network Supporting Multimedia Traffic,” Proceedings of ITC-15, June 1997.
[11] V. Paxson, "Empirically-Derived Analytic Models of Wide-Area TCP Connections", IEEE/ACM Transactions on Networking, Vol. 2, No. 4, pp. 316-336, Aug. 1994.
[12] M. E. Crovella, A. Bestavros, "Self-Similarity in World Wide Web Traffic: Evidence and Possible Causes," IEEE/ACM Transactions on Networking, Vol. 5, No. 6, pp.835-846, December 1997.
[13] W. Willinger, M. S. Taqqu, R. Sherman, and D. V. Wilson, "Self-Similarity Through High-Variability: Statistical Analysis of Ethernet LAN Traffic at the Source Level," IEEE/ACM Transactions on Networking, Vol. 5, No. 1, February 1997.
[14] V. Paxson and S. Floyd, "Wide-Area Traffic: the Failure of Poisson Mod-eling", IEEE/ACM Transactions on Networking, Vol.3, pp.226-244, 1995. [15] A. Erramilli, J. Gordon, and W. Willinger, “Application of Fractals in En-gineering for Realistic Traffic Processes,” Proceedings of ITC-14, June 1994.
[16] IEEE, 802.1D, Standard for Local and Metropolitan Area Networks: Me-dia Access Control (MAC) Bridges, 1997.
[17] S. Shenker and J. Wroclawski, “General Characterization Parameters for Integrated Service Network Elements,” RFC 2215, September 1997. [18] R. Braden, L. Zhang, S. Bersib, S. Herzog, S. Jamin, “Resource
Reser-vation Protocol (RSVP) - Version 1 Functional Specification,” RFC 2205, September 1997.
[19] Y. Bernet, J. Binder, S. Blake, M. Carlson, B. Carpenter, S. Keshav, E. Davies, B. Ohman, D. Verma, Z. Wang, and W. Weiss, “A Frame-work for Differentiated Services,” IETF Frame-working draft <draft-ietf-diffserv-framework-02.txt>, February 1999.
[20] V. Jacobson, K. Nichols, and K. Poduri, “Expedited Forwarding PHB,” RFC 2598, June 1999.
[21] J. Heinanen, F. Baker, W. Weiss, J. Wroclawski, “Assured Forwarding PHB Group,” RFC 2597, June 1999.