A NEW TRAFFIC MODEL FOR CURRENT USER WEB BROWSING
BEHAVIOR
Jeongeun Julie Lee Maruti Gupta
Communications Technology Lab, Intel Corp. Communications Technology Lab, Intel Corp.
Hillsboro, Oregon Hillsboro, Oregon
ABSTRACT
Given the wide use of HTTP traffic models to model user web browsing behaviour, it is important that the model be
representative of a large variety of traffic and be continually updated to reflect the constantly evolving nature of web content and the exponential growth in number of users. In this paper, we analyzed an extensive set of proxy web server logs to understand changes in network traffic patterns. We found significant gaps in the methods previously proposed, specifically the major one being that it is almost impossible to detect a web request generated from a user click from one generated from various embedded scripts and frames. As a result, we modified the definition of a web request boundary. Due to the presence of large numbers of embedded objects from several different off-site sources, which cannot be traced back to the original request through following TCP/IP headers source addresses alone, newer heuristics need to be devised. We present our methodology for analyzing the squid proxy log in a way that preserves user privacy, and propose a new HTTP traffic model and traffic generator to represent current user web browsing behaviour. Comparison of independent statistics from the trace and the model shows a fair match.
I. INTRODUCTION
Web traffic is the largest consumer of internet resources and is thus subject to much study for various research purposes. There have been several studies done in the past to characterize user behaviour on web traffic [1,2,3]. One of the most widely used models of user web browsing behaviour proposed in [1] was based upon trace collected in late 90s. One of the drawbacks of that study is that the trace was collected only for an hour in a single campus. In addition, significant time has elapsed since the study was performed and there may be gaps in our understanding due to the steadily changing nature of web traffic and perhaps user behaviour.
In this paper, we present the results of analysis of traces obtained from a set of proxy servers and we thus believe them to be more representative of average user traffic patterns. Due to privacy and security concerns, obtaining access to a large set of samples of actual packet traces including the HTTP headers and/or body is difficult. Our methodology enables analysis of web logs in a non-invasive manner so as to prevent anyone from correlating individuals and browsing activity, thus facilitating constant update of model parameters in the future.
The major contributions in this work are a) proposing a new model and web traffic generator and b) proposing modeling methodologies to adapt to changes in web traffic to enable further research on other sets of data without compromising user privacy. We note here that similar to previous models, the model proposed here generates traffic at layers above TCP/IP since the actual packet inter-arrival time (IAT) is governed by specific conditions that existed in the internet when the trace was collected and are unique in that context.
The rest of the paper is organized as follows. The next section covers the major related work in this area. Section III gives an overview of HTTP traffic modeling and then introduces our model. Section IV describes modeling methodology and the observed differences in the traces that cannot be explained from the existing models. Section V discusses the modifications to the existing model and analysis result. Section VI presents model validation, and section VII outlines the assumptions and limitations in formulating the model.
II. RELATED WORKS
An empirical model of HTTP network traffic that defined HTTP-level parameters using statistical distributions was presented in [2]. A Web Page was defined as the boundary of interest. A new model was proposed in [1] that defined a different boundary, user initiated Web Requests, which is widely being used in various simulation platforms.
In [4], the authors performed analysis based only on TCP/IP headers, which showed the impact of persistent connections, load balancing and content distribution, but cannot account for some limitations such as ambiguity in distinguishing top level versus embedded objects. In [5], the authors presented heuristics that detects user clicks in order to distinguish web pages generated by users from pages generated automatically from scripts.
III. HTTPTRAFFIC MODELING OVERVIEW
Currently, HTTP 1.0 and HTTP 1.1 are the two primary versions of the HTTP protocol. HTTP 1.0 has features such as multiple connections and keep-alive connection that allows multiple requests to be sent on the same connection. HTTP 1.1 uses persistent connections and pipelining.
HTTP protocol is a request/response protocol. An HTTP response is displayed in the user browser as a web page. A web page is primarily an html document whose content type is text/html with links to other objects embedded in it. We define the web page itself as the HTML object and the objects in it as embedded objects. A web page is generated either in response to a direct user request or due to embedded scripts, e.g., php and javascript, running within the web page that automatically generate web pages.
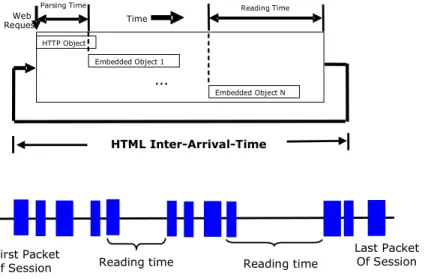
Typically, HTTP traffic is modeled as an ON/OFF source with the ON state corresponding to the request and download of the objects and the OFF state corresponding to the inactive time. The new model shown in Fig. 1 also follows this basic ON/OFF model.
Figure 1: New HTTP Traffic Model Diagram
It is possible that the ON state lasts over multiple Web-Request periods when the downloading of the last embedded object and the next HTML object overlaps. For example, this can happen when the user requests a new object in the middle of the object download. The OFF state can mean machine processing time (when gap is very small), user viewing time or time that the user is away from the system. Also note that downloading of the HTML object and the consecutive object may overlap which is the departure from the existing model.
In previous models, the traffic was modeled as a series of user generated Web-Requests where a user-generated request was distinguished from an automatically generated request by the following means:
• Heuristics based on time separation of 1second [2,4,5]: It is assumed that request by scripts is sent in time less than a second: This doesn’t work since user requests can follow in less than a second, e.g., users’ click on the interested link during the download of the HTML object.
• Identifying user action [1]: This doesn’t work since there is no way to make certain whether the request was generated automatically by the scripts or in response to a user click.
• Referer field: It is not a definite measure since it is an optional field and can be used for both cases.
Thus, we used a Web-Request as our boundary as explained in section IV. In addition to this major difference, the second major difference in our model is that the traffic generated in our model reflects the effect of use of multiple web browsers and represents user interaction better. It is impractical to assume that all the embedded objects are always downloaded before having reading time and moves to the next page. Current users tend to move around web pages before one whole page finishes download its embedded objects.
IV. MODELING METHODOLOGY
In this section, we discuss the details of our methodology to analyze squid proxy logs in which the information is stored in a different form than packet-level traces. Thus, several new steps were introduced in order to interpolate response arrival times and obtain an upper bound for HTTP session and embedded object IAT.
A. Traffic Parsing
The data used for analysis in this paper was collected for three days in July, 2007 from 10 web proxy nodes with requests generated by more than 62000 clients. We note that the effect of local browser caches is not captured since proxy is unaware of
Web Request HTTP Object Embedded Object 1
…
Embedded Object N TimeParsing Time Reading Time
HTML Inter-Arrival-Time
First Packet of Session
Last Packet Of Session Reading time Reading time
web browser level cache hit. However, since cache hit in web browser does not generate network traffic, it should not make a difference.
Each proxy node logs one entry for each pair of HTTP request and its corresponding response in a native Squid log format [6]. Logs were preprocessed to delete URL, leaving only file extension, and Referer to preserve user privacy. Each entry is logged with timestamp and elapsed time which is the service time from when the proxy receives the HTTP request to when it finishes sending the last byte of the response back to the user. Since the entry is created after the last byte of the response is sent out, the timestamp is the end time of the transaction. Response arrival time, which is missing in the log but essential in getting HTTP model parameters, was derived using the algorithm discussed in section B and added to the logs.
Then, proxy logs are separated into distinct files by client IP. Once files are separated by client IP, each client IP file is sorted by response arrival time. HTTP model parameters are computed from each HTTP session (HTTP session is explained in Section C), and then each parameter was fitted with standard distributions (Lognormal, Weibull, Exponential, Gamma, and Generalized Pareto) using Matlab dfittool. We selected the best fit distribution by the one (1) that maximizes log likelihood and (2) whose estimated mean and variance are not infinite values.
Figure 2: Response Arrival Time B. Response Arrival Time
Response arrival time was interpolated using timestamp, elapsed time, and content length as shown in Fig. 2. Let us assume that timestamp is Ts, elapsed time Te, and content length L. Thus, HTTP request arrival time at the proxy node is Treq = Ts – Te. The response arrives between Treq and Te. Response arrival time is determined from data rate R obtained from the following algorithm:
where SREQ is request size, MTU size = 1500 Bytes. Then, response arrival time,TRSP, is calculated as follows:
TRSP = L/R
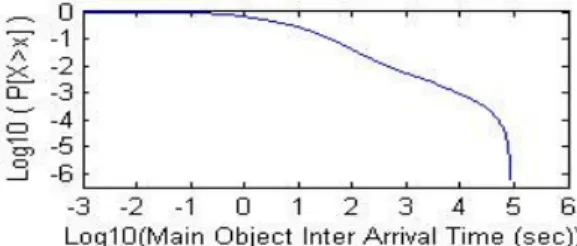
Figure 3: LLCD plot to assess HTTP session time
TREQ TRSP Ts Request Response Last Byte of Sent Arrival Response Sent
SREQ L if L <= MTU R = 2*L/ TE elseif L >= 10*MTU R = L/ TE else R = (L+ SREQ)/ TE
0 200000 400000 600000 800000 F re q u e n c y 34.1% 3.0%1.8%5.5% 4.9% 12.3%13.6% 24.9% / a s p a s p x c g i h tm h tm l o th e rs p h p
Figure 4: File extensions of HTML documents C. HTTP Session
An HTTP session is a single browsing session where the maximum OFF time is restricted to a certain value. To determine the maximum OFF time, we used log-log complementary distribution (LLCD) plot [7] of HTML object IAT. In Fig. 3, we observe linear behavior over a certain range of time. The sharp slope change at around 10,000 seconds can be safely assumed as a bound for a session.
D. Web-Request
An HTTP session consists of series of Web--Requests. A Web-Request consists of one HTML object and zero or more embedded objects that arrive before the next HTML object. Since it is difficult to distinguish user initiated HTML objects from automatically generated HTML objects, any HTML objects, regardless of how they were generated, become the start boundary of the Web-Request.
When a new HTML object is requested from a new web browser while the other browser is still downloading, objects requested from the two web browsers are interleaved. Since any HTML object seen by the user can be the boundary of the Web-Request, our definition is user-platform-wide and encompasses pages generated from multiple web browsers. Note that embedded objects that arrive within the Web-Request don’t always belong to the same HTML object.
For entries that don’t contain content type value, the file extension is checked if it is one of html/htm, cgi, asp, sml, stm, php, and “/”. Fig. 4 shows the percentage of file extensions of HTML pages as seen from our traces.
Parsing time and IAT are bounded by TCP session. TCP session ends either when maximum number of data retransmission efforts fails and reset is sent or when FIN is sent. TCP maximum retransmission interval on most implementation is less than 5 minutes, and 2*Maximum Segment Lifetime (MSL) that measures how long the session is in TIME_WAIT state is also less than 5 minutes [8,9]. So, they were bounded by 5 minutes to reduce noise.
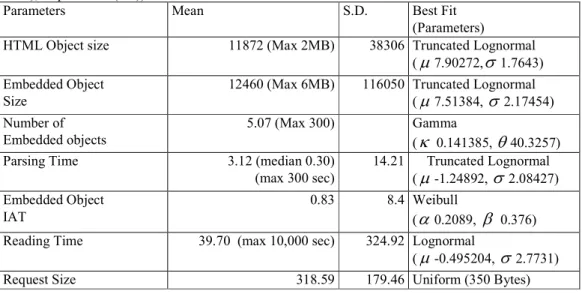
Table 2: Analysis Result of HTTP Model Parameters
(Fitting Parameters: Weibull (scale(a), shape(b)), Lognormal (mu, sigma), Gamma (shape(a), scale(b)), Gen. Pareto (k, sigma, theta), Exponential (mu))
Parameters Mean S.D. Best Fit
(Parameters)
HTML Object size 11872 (Max 2MB) 38306 Truncated Lognormal (
µ
7.90272,σ
1.7643) Embedded ObjectSize
12460 (Max 6MB) 116050 Truncated Lognormal (
µ
7.51384,σ
2.17454) Number ofEmbedded objects
5.07 (Max 300) Gamma
(
κ
0.141385,θ
40.3257)Parsing Time 3.12 (median 0.30)
(max 300 sec) 14.21 Truncated Lognormal (
µ
-1.24892,σ
2.08427) Embedded Object IAT 0.83 8.4 Weibull (α
0.2089,β
0.376) Reading Time 39.70 (max 10,000 sec) 324.92 Lognormal(
µ
-0.495204,σ
2.7731)V. MODEL AND ANALYSIS RESULT A. Model Parameters
In this section, we delve into the details of each of the HTTP parameters defined in our model. Modeled HTTP parameters are listed in Table 2 with statistical analysis of those parameters in terms of mean, variance and best fit distribution. Table 2 also provides estimated parameters used for the corresponding best fit distribution in the parenthesis.
• HTML object size and Embedded object size are both best fitted by Lognormal distribution. Fig. 5 shows the CDF comparison of model and trace of embedded object size. Embedded object size is larger than HTML object size contrary to previous results in [1].
Number of embedded objects is the number of embedded objects that show up in-between two HTML objects. The reason that we see similar mean value to that of [1], even though it’s perhaps reasonable to assume that the number of embedded objects would have increased corresponding to the increased complexity in current content, might be that (1) the current Web page contains more frames and scripts that generate HTML objects, so the total number of embedded objects in the web document got averaged out among them, and (2) because proxies make use of cache, the number of objects that are actually downloaded might be less than what it might be in older networks.
Figure 5: CDF of Embedded Object Size
• Parsing time is the time difference of HTML object arrival and the first embedded object arrival within the same Web-Request. Embedded object IAT is the time between the arrival of one embedded object and the arrival of the consecutive embedded object.
Mean of embedded object IAT is shorter than that of Parsing time. It may be explained by that once the route to the server is identified to fetch the first embedded object, the next fetches take less time. When considered that the size of the embedded objects has increased significantly (140% more than in [1]), the relatively slight increase of embedded object IAT may be attributed to the high speed network and use of cache.
• Reading time is the time between the arrival of the last object (this can be the HTML object when there is zero number of embedded objects) of the current Web-Request and the arrival of the new HTML object.
• HTML object IAT is the time difference between the two adjacent HTML object arrivals. This parameter is not used directly in generating traffic in simulation, but is used to validate the model.
• Request Size is the size of the HTTP requests and was derived independently from a different much smaller set of traces since the squid logs did not have those values.
Table 4: Analysis Result of Caching Model Parameters Mean S.D. Best Fit
(Parameters) Cached object size 190.38 68.83 Gamma (7.78674, 24.4486) Consecutive # of cached objects Consecutive # of non-cached objects B. Caching Model
responses. Caching model affects the networks systems in terms of less bandwidth requirement - 304 responses don’t include HTTP response body but only include HTTP response header. Mean cached object size is only 190 bytes, which is less than 1.5% of the non-cached HTML object size and non-cached embedded object size.
We model caching by counting the number of consecutive cached objects and the number of consecutive non-cached objects within a HTTP session. When we generate traffic using simulation, we alternate between non-cached and cached objects as a 2-state model in that once we have generated a number of consecutive non-cached objects, we switch to generating cached objects the number of which is indicated by the distribution of cached objects. The distribution of non-cached objects for both main and embedded objects is given in Table 2, and for cached objects is given in Table 4.
Figure 8: Flowchart for Simulation Traffic Generation
VI. VALIDATION
The model generated synthetic traces using the flowchart shown in Fig. 8. Since the model parameters were generated using trace data, we needed parameters that were independent of the trace-derived parameters to compare the model generated synthetic trace with the original trace. To do so, we selected the IAT between 2 HTML objects as the parameter for
comparison. We assume here, that the model parameters are independent and have little or no correlation with each other. The IAT between 2 HTML objects is dependent upon several parameters which were independently derived and include the following: HTML object size, number of embedded objects, embedded object IAT and the inactive time between last Parsing time and the next Reading time. Fig. 9 shows the CDF of the main IAT generated by the simulation run using our model and the trace. The mean and standard deviation values as well as the LN fit parameters from the model and trace for the IAT are shown in Table 5 and we found them fairly well matched.
Table 5: HTML object IAT Statistics Comparison Mean SD LN Dist. Parameters Trace 44.5228 334.52
µ
0.221149,σ
2.64962 Model 41.5626 639.76µ
0.281044,σ
2.7142Figure 9: CDF comparison of Trace and Model for Model Validation
VII.CONCLUSIONS
We presented a new HTTP traffic model that captures recent user browsing behavior. We find that web traffic has evolved some new trends such as the widespread presence of online sites offering video streaming applications. This trend has directly contributed to the increase in size of embedded objects. Our model shows a decrease in mean IAT for Reading times, which can be attributed to the increased use of web caching and proxy servers or greater availability of high speed data networks.
Requests are not sent to original server when cache-hit at the proxy and thus the number of cached objects observed here may be larger. It may affect other parameter values in terms of IAT as well. We do not take into account the effect of local browser caches in the trace log; in any case they don’t generate network traffic.
Since HTTP session or TCP session information is not directly available because we don’t have packet level captures, we assume some fixed values throughout the analysis. Since we don’t have packet arrival time and it is interpolated with the algorithm presented in Section III, the time related parameters are approximations, although we believe they are fair.
VIII. ACKNOWLEDGEMENTS
We are immensely thankful to our colleagues at Intel, Belal Hamzeh and Chunmei Liu, for their feedback and guidance, Brian King at Intel IT who provided us with the proxy server logs and helped us understand them, and Jeff Sedayao and Mic Bowman from Intel. We would also like to thank Jaideep Chandrashekhar for providing another set of traces.
REFERENCES
[1] H. Choi and J. Limb, “A Behavioral Model of Web Traffic,” in International Conference of Networking Protocol’99 (ICNP 99), September 1999. [2] B. A. Mah, “An Empirical Model of HTTP Network Traffic”, in Proceedings of INFOCOM’97, April 7-11, Kobe, Japan.
[3] C. Zhu, Y. Wang, Y. Zhang and W. Wu, “Different Behavioral Characteristics of Web Traffic between Wireless and Wire IP Network”, in Proceedings of ICCT’2003.
[4] F. Doneson Smith, F. H. Campos, K. Jeffay and D. Ott, “What TCP/IP Protocol Headers Can Tell Us About the Web,” in ACM SIGMETRICS 2001, Cambridge, MA, 2001.
[5] H. Abrahamson, B. Ahlgren, “Using Empirical Distributions to Characterize Client Web Traffic and to Generate Synthetic Traffic,” in IEEE Globecomm'00, San Francisco, Nov. 2000.
[6] [Online]. Available: HTTP://wiki.squid-cache.org/SquidFaq/SquidLogs
[7] M. E. Crovella and A. Bestavros, “Self-similarity in World Wide Web traffic: evidence and possible causes,” in IEEE/ACM Transactions on Networking Volume 5 , Issue 6 (December 1997)
[8] [Online]. Available: HTTP://support.microsoft.com/kb/170359