1234567890
ICCSCM 2017 IOP Publishing
IOP Conf. Series: Journal of Physics: Conf. Series 892 (2017) 012009 doi :10.1088/1742-6596/892/1/012009
Replacing missing values using trustworthy data values from
web data sources
M.Izham Jaya1, Fatimah Sidi1, Sharmila Mat Yusof 1,2, Lilly Suriani Affendey1,
Iskandar Ishak1 and Marzanah A. Jabar1
1Faculty of Computer Science and Information Technology, Universiti Putra Malaysia, Serdang, Selangor, Malaysia.
2School of Computing, College of Arts and Sciences, Universiti Utara Malaysia, Sintok, Kedah, Malaysia.
fatimah@upm.edu.my
Abstract. In practice, collected data usually are incomplete and contains missing value. Existing approaches in managing missing values overlook the importance of trustworthy data values in replacing missing values. In view that trusted completed data is very important in data analysis, we proposed a framework of missing value replacement using trustworthy data values from web data sources. The proposed framework adopted ontology to map data values from web data sources to the incomplete dataset. As data from web is conflicting with each other, we proposed a trust score measurement based on data accuracy and data reliability. Trust score is then used to select trustworthy data values from web data sources for missing values replacement. We successfully implemented the proposed framework using financial dataset and presented the findings in this paper. From our experiment, we manage to show that replacing missing values with trustworthy data values is important especially in a case of conflicting data to solve missing values problem.
1. Introduction
Data is a very important substance in making analysis. However, collected data is usually incomplete and contains missing values. In practice, missing values can happen due to several reasons such as human errors, equipment malfunction, manual data entry process and incorrect measurement [1,2]. As missing values is a common problem in collected data, adopting suitable approach in managing missing values is crucial to minimize bias in the resulted analysis [3].
In data quality research, the occurrence or absence of missing values in which data records has the undesirable null values determined the completeness of data [4–6]. Due to this definition, we can consider that data is complete when all necessary values pertaining to the data exist and contained no missing values [7–9]. The emergence of research in managing missing values problem proposed various approaches to impute missing values. Most of the approach introduced a new value to replace missing value and further, make the data complete. A common example is to replace missing values with the observed mean. More robust statistical methods such as regression analysis have also been used to impute missing values efficiently.
Introduction of new values after missing values imputation using statistical methods brought several problems such as data duplication, data outliers and data distortion if it is not done by the
1234567890
ICCSCM 2017 IOP Publishing
IOP Conf. Series: Journal of Physics: Conf. Series 892 (2017) 012009 doi :10.1088/1742-6596/892/1/012009
statistical expert [10,11]. Consequently, the resulted analysis of the imputed data is deteriorate. The other way to find suitable values to replace missing values is to look for the data values that described about the same data in the other data sources such as web. However, as the missing values being replaced with data values from web, question on the level of trust that we have towards the data value retrieved from web need to be address. Obviously, replacing missing values with data values from other data source without knowing how much we can trust that data values risk the resulted analysis and worst, lead to a wrong decision.
Web contained large collection of potential data candidates to replace missing values. For example, in financial domain, web data from Yahoo! Financial and Google Finance can be used to replace missing values in financial statements dataset. However, heterogeneity in web data sources poses challenges to integrate and use web data to replace missing values. Furthermore, various schemas is used to define data in web. Thus, problems such as conceptual inaccuracies and terminological ambiguity is inevitable [12]. Ontology is used in [12] to solve the problems mentioned before.
In web, values of the same data from various web data sources can be different and conflicting with each other [13]. Replacing missing values with data value from web raised concern about the level of trust that we have towards the web data. Essentially, the selection of trustworthy web data to replace missing values derived a trusted completed dataset [6,14]. Moreover, by knowing the trust level of the selected data, users have more confident in the analysis result. The question of trust as mention before motivates us in doing this research.
Any replacement of missing values with data values from web required the calculation of trust score beforehand. Data candidate with highest trust score is then use to replace missing values. In this paper, we proposed a framework to manage missing values by replacing it with a trustworthy data values from web data sources. Therefore, we also introduced a trust measure to calculate trust score of each data candidates. The proposed trust measure is based on the available observed data in the dataset. In this paper, we use data candidate as a term that refer to the data values from web data sources and has potential to replace missing values.
This paper is structured as follows: in Section 2, we review related works in missing values mechanism, missing values imputation, ontology adoption in data quality, data accuracy and data reliability in measuring trust. In Section 3, we proposed a framework to manage missing values by replacing it with a trustworthy data values from web data sources. Then, we show illustrative example of the proposed framework in Section 4 and we conclude our findings in Section 5.
2. Related Works
2.1. Missing values mechanism
Missing values occurrence can be categorized into three categories, which are Missing Completely at Random (MCAR), Missing at Random (MAR) and Missing Not at Random (MNAR) [15]. Missing values are considered as MCAR when its’ occurrence is independent to any other observed values or the data of interest itself. For example, if the interviewer only asked 60 percent of the questions randomly, then 40 percent of data resulted from the interview is missing. As the missing values occurred in random and not dependent to any observed value, 40 percent of missing values from the interview session can be consider as MCAR. Any imputation methods used to impute missing values with MCAR type will not lead to bias during the analysis [2]. However, the assumption of MCAR should be done with cautious as MCAR type is rarely occur in the dataset. For this reason, Little MCAR test [16] should be conducted in order to confirm the assumption.
On the contrary, missing values is considered as MAR if the occurrence of missing values is dependable to the other observed values but not to the missing value itself. Additionally, Acock [17] explained that missing values can be explain by other observed values in the case of MAR since the missing value is dependent to other observed values which are not missing. As an example, during the interview, students with age 15 to 17 years old tend not to answer the question of smoking status. This lead to the assumption that chances of missing values in smoking status of the student with age 15 to
1234567890
ICCSCM 2017 IOP Publishing
IOP Conf. Series: Journal of Physics: Conf. Series 892 (2017) 012009 doi :10.1088/1742-6596/892/1/012009
17 years old is higher compared to the students with younger age. The resulted missing values from the interview can be consider as MAR since the missing value in smoking status is related to the observed variable, students’ age. In MAR, missing values can be imputed by using the values of other observed values [3].
MNAR occurs when the possibility of missing values in the dataset is related to the unobserved values. Due to this, missing values in MNAR cannot be imputed by using other observed values [3]. Therefore, advance statistical knowledge is important in order to analyze data with MNAR [18]. In summary, it is important to make a clear distinction between MCAR, MAR and MNAR occurrence in the dataset as it will determined the best approach to deal with missing values.
2.2. Approaches in missing values imputation
Previous research in improving data completeness proposed various approaches to deal and to impute missing values. The most common approach is list-wise deletion by omitting instances with missing values from the analysis which then reduced size of instances. The list-wise deletion is simple. Yet, as the sample size decrease, the statistical power of the analysis will drop as well which then arise difficulties to detect small effect or relationship between variables [18]. It became worst in a case of MCAR data type, as it increase the standard errors and decrease the level of significance due to a smaller sample size [17]. Conversely, pair-wise deletion gives more statistical power without threaten the sample size. In pair-wise deletion, data with missing values is not included in the analysis, but the case will not be omit as it is used to analyze other observed data with non-missing values. Either list-wise or pair-list-wise deletion, the execution of the deletion approach is highly suggested only in MCAR and in some MAR cases where missing values only comprises of a small part of data [17, 19, 20].
Another approach to deal with missing values is to replace missing values with the value of observed mean [21]. In this approach, the mean value of the observed variables in dataset is computed and used to replace missing values. This approach is easy to use and more assertive compared to the deletion approach as it estimates the missing values based on the non-missing values without reducing the sample size and disturbing the mean variable of dataset [18]. However, using constant mean value to replace missing values in dataset distort the statistical distribution of data and will further risk the result of data analysis [22]. Besides, using the constant value of mean to replace missing values altered the randomness of data. Escaping the data randomness led to invalid statistical inference [18, 23].
In contrast to the abovementioned methods, Batista and Monard [24] proposed an approach based on the KNN algorithm to impute missing values. In order to find the nearest neighbor, several distance function such as Euclidean, Manhattan and Pearson is used. KNN suggested a set of k-nearest neighbor of the missing value which then being used to replace the missing value. Thus, the optimal value of k is important to ensure high imputation performance. Selection of the replacement techniques to replace missing values is depending on the type of data being analyzed. The most common techniques are mean estimation, median, mode and weighted average of the values [25]. As opposed to the mean imputation method, KNN can be used to predict missing values in both qualitative and quantitative data type [26]. However, finding the most similar instances in a large dataset is a time consuming process as the approach will search throughout the dataset [24].
Another approach to impute missing values is the MissForest method and it is found to be more robust compared to KNN [27,28] and mean imputation [28,29]. MissForest method imputes missing values based on the random forest algorithm which been trained on the non-missing values of the dataset [27]. Missing values imputation in MissForest is done in a repeated iteration which started by initial guess of the missing value, X by using mean imputation or other imputation methods. A random forest model is then created for each value of X to impute the missing value. The iteration is then stopped after the stopping criteria is met. Stopping criteria is met when a large differences between previous and the new imputed data matrix occur. The performances of MissForest is assessed by the Normalize Root Mean Squared Error (NRMSE) and Proportion of Falsely Classified Entries (PFC) for categorical variable which scaled from 0 to 1. Value of NRMSE and PFC that closest to 0 shows a good performance of MissForest. The ability of MissForest to handle any type of data with small
1234567890
ICCSCM 2017 IOP Publishing
IOP Conf. Series: Journal of Physics: Conf. Series 892 (2017) 012009 doi :10.1088/1742-6596/892/1/012009
tuning and produced better imputation result were the main advantage of this approach compared to others [28].
Further advancement in computing has resulted new approaches in improving data completeness and missing values including constraint based method [30] and replacing missing values with data from online data sources [12]. Prediction model for asset valuation has been used in [12] to evaluate the proposed framework. Various imputation approaches such as mean of available observation, ignore missing values and fuzzy concept is used to impute the dataset and later, being compared with the proposed framework in the evaluation. The result proved that replacing missing values with data from online data sources produced higher accuracy in the prediction model compared to other imputation approaches.
2.3. Ontology adoption in data quality
Data from various web data sources were usually found conflicting with each other [13]. The most common example is the difference of terms used to describe about the same data. Moreover, conflicting data from various web data sources can be resulted from the lack of precision in concept definitions. Du and Zhou [12] described both problems as terminological ambiguity and conceptual inaccuracy. Ontology adoption is important to solve both problems and to provide inference before data from web data sources is use to replace missing values.
Ontology has been used in previous research to solve data quality and data completeness problem. Several reasons strengthen the needs to adopt ontology in data quality such as the ability to embed domain knowledge and user’s data quality requirement [31]. Data quality requirements explained how the assessment will be carried out including details about data quality metrics and the assessment method in used. Furthermore, the adoption of ontology in data quality management reduces extensive involvement of domain expert and data users during data quality assessment and improvement process. Additionally, previous researchers adopted ontology in data quality assessment because its ability to infer and to represent data from heterogeneous data source or data schema [12, 14], [31–35]. The adoption of ontology also allowed data quality assessment of large data to be conducted without expert involvement [12, 30], [32–34].
Ontology is an explicit specifications of concepts and it showed the relationship among concepts and their attributes in a specific domain [36]. In ontology, class is used to explain concepts in the interested domain. Each classes contained instances that specifically described the object. For example, a class of cars represents all cars and specific car model is the instances. Ontology can be built manually, semi-automated or fully automated. However, the process involved in building the ontology itself is complicated and time consuming. Thus, existing ontology that described interested domain can be used to safe time. In some cases, small modification or mapping of existing ontology is needed to suit the needs.
2.4. Measuring trust: data accuracy and data reliability
Dimensions of data accuracy and data reliability can be categorized into two perspective of trust which are: trust of data value and trust of data source. Trust of data value explained the dimensions that are important in measuring trust of the data value itself. The later described the measurement of trust in the data source that the value being retrieved. In this paper, focus is given on data accuracy and data reliability dimensions to measure trust score as our literature review suggested that data accuracy and data reliability is important in measuring trust and has been discussed in most research articles that emphasis trust [6, 32], [37–40].
Data accuracy is defined as the closeness of data value to the real world or the value of reference [41, 42]. However, in most cases it is difficult for us to know the value of data in real world. Thus, research in data quality categorized data accuracy into two categories which are: syntactic and semantic accuracy [6, 40]. In syntactic accuracy, the real value in real world data is not important in measuring accuracy. However, the semantic accuracy measures the closeness of data value to its real value. We can relate syntactic accuracy to the definition of accuracy by Redman [43] that data
1234567890
ICCSCM 2017 IOP Publishing
IOP Conf. Series: Journal of Physics: Conf. Series 892 (2017) 012009 doi :10.1088/1742-6596/892/1/012009
accuracy measure the proximity of data value from the value of reference that is considered correct. Data accuracy can be measure using distance function [6] where the closest distance between data value, v and value of reference v’ reflected high data accuracy. In determining the accuracy of data source, the ratio of number of values that accurate and the number of total data values is used [40].
Data accuracy is related to the reliability of data source. If the data value is accurate, data accuracy is equal to 1 and its’ data source is considered as highly reliable [39]. Thus, data source with lowest data accuracy rate, has low data reliability score. From data source perspective, data reliability is defined as the ability of data source to provide rightful data [6]. Instead, data reliability from data value perspective can be define as a measure of data ability to be trusted and conveys right information [6, 44]. Obviously, both definitions relate data reliability with trust and rightful data.
Reliability can be measure using several approaches such as Cronbach alpha and composite reliability score [37], trust measure [38] and truth discovery [39]. In discovering truth and determining data reliability, data which claimed by majority of data sources is considered as truthful data [39]. However, the proposed approach does not distinguish the reliability of data sources that claimed the same data value. It is important to expose the reliability of data sources as the majority claim can be wrong especially in the event that data being shared among data sources. Li et. al [39] measure source reliability and the confidence interval of the invariance to discover truth.
3. Framework of Missing Values Replacement Using Trustworthy Data Values from Web Data Sources
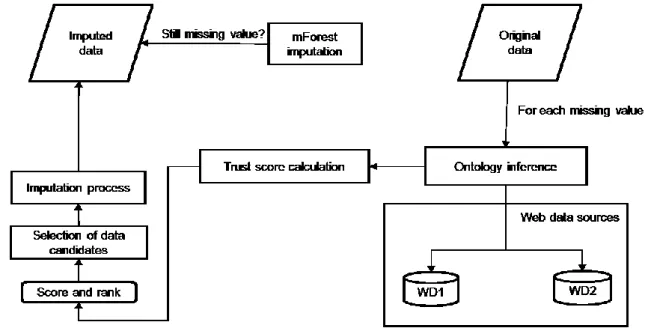
In this paper, we are interested in finding trustworthy data values from web data sources to replace missing values in dataset. We propose a framework to manage missing values by replacing it with a trustworthy data values from web data sources. Hence, we illustrated the proposed framework in figure 1.
The web contained a lot of data related to the domain of interest. For instance, in financial domain, Yahoo! Finance and Google Financial stored companies’ financial data such as the income statement, balance sheet and share prices. However, making used of these data to replace missing values required the adoption of ontology to map the data from web data sources to the original dataset.
Figure 1. A framework to replace missing values with a trustworthy data values from web data sources.
For example, if a value of sales from company A is found missing, the ontology is then used to map related data from the web to the original dataset. In some cases, the term sales is not used to
1234567890
ICCSCM 2017 IOP Publishing
IOP Conf. Series: Journal of Physics: Conf. Series 892 (2017) 012009 doi :10.1088/1742-6596/892/1/012009
represent data about sales. Instead, revenue is used to represent sales data. Conflicting terminology in web data sources is the example of terminological ambiguity [12]. The ontology is also use to infer data from web data sources and suggested suitable data candidates to replace missing values. As shown in figure 1, for each missing values found in the original data, the ontology is used to infer data from web data source 1 (WD1) and web data source 2 (WD2). Trust score is then calculated for data candidates from each web data sources. Data candidate with highest trust score is then selected to replace the missing values. If there is no values being retrieved from WD1 and WD2, then the missing values will be impute using MissForest [27]. The details of how to calculate the trust score is explained in the next section.
3.1. Trust score calculation
Data values retrieved from web data sources is usually conflicting with each other [13]. Importantly, only one data value is required to replace the missing value in the dataset at one time. It is impossible for us to know what are the real value that missing. Therefore, in order to select which data values should be used to replace missing value, we calculated the trust score. We define the following measure to calculate the trust score.
Assume that we have a financial dataset of twenty rows and four column. Each rows described financial data of the company (entity) and each column is the related variables. The dataset has five missing values. We retrieved data candidate from web data source (i) to replace missing value (x,j) in the dataset. The calculation of trust score for data candidate from web data source (i) is defined as:
100
Acc
wd(i)
Rel
wd(i)
D
variableRelwd(i) (1) Where,Accwd(i) = Accuracy score of data value from web data source (i) Relwd(i) = Reliability score of data value from web data source (i)
Dvariable = Average distance between 3 available variable in web data source (i) and the corresponding variables in original data
The calculation of trust score relied on the accuracy and reliability score of data candidate from web data source (i). As trust score measure the trustworthy of data candidates from web data source (i), high accuracy and reliability score of data candidate resulted high trust score. Dvariablecalculated the average distance between data values of three available variables in web data source (i) and its corresponding variables in original dataset. Importantly, these three available data values belongs to the same entity that have the missing value. Thus, high discrepancies between values resulted high Dvariable values. We defined Dvariable measure as:
2 1 3 ) ( ) ( ) ( ) ( ) ( ) ( 2 2 2
Ai Aori Bi B ori C i C ori(2)
Where,
A(i), B(i), C(i) = Variable A, B, C from Source (j) which belongs to the same entity that have the missing value (x,j)
A(ori), B(ori), C(ori) = Variable A, B, C from original data which belongs to the same entity that have the missing value (x,j)
1234567890
ICCSCM 2017 IOP Publishing
IOP Conf. Series: Journal of Physics: Conf. Series 892 (2017) 012009 doi :10.1088/1742-6596/892/1/012009
3.1.1. Calculation of accuracy score. The calculation of accuracy score is based on the similarity between values from three nearest variables in the original dataset and the values of corresponding variables retrieved from web data source (i). The value A from web data source (i) is considered as accurate if it similar with the corresponding value in the original data. Thus,
Aweb data source (i) - Aoriginal = 0 (3) The following measure defined how we calculate the accuracy score.
Assume that we want to replace a missing value Original(x,j) in our original dataset. The dataset comprises of twenty companies (entity) and four columns (variables). The nearest available variables to the missing value in the original dataset is A(x,k), B(x,l) and C(x,m). We retrieved data values of variables A, B and C from web data source (i) to measure the accuracy of its data values. The calculation of accuracy score is defined as:
3 / | ) ( | | ) ( | | ) ( | n i C n i B n i A (4) Where,
|A(i)|, |B(i)|, |C(i)| = Number of entity from Variable A, B, C of Source (j) which the similarity is 0 n = Number of entity in dataset
3.1.2. Calculation of reliability score. A particular web data source is considered unreliable if it has too many data values that is different from the available observed data in the original dataset. In such cases, the variance of the error distribution in the particular web data source is big [39]. In this paper, a data that is retrieved from a web data source that has lower reliability score is considered as less reliable compared to the data from a web data source with higher reliability score.
Assume that we want to replace a missing value Original(x,j) in our original dataset. The dataset comprises of twenty companies (entity) and four columns (variables). The nearest available variables to the missing value in the original dataset is A(x,k), B(x,l) and C(x,m). We retrieved data values of variables A, B and C from web data source (i) to measure the reliability of its data values. The calculation of reliability score is defined as:
Ni n ori C i C ori B i B ori A i A x 2 ) ( ) ( 2 ) ( ) ( 2 ) ( ) ( 2 / 1 (5) Where, x2 = Chi-square (0.025, df=20) n = entity nNi = Set of entity provided in web data source (i)
A(i), B(i), C(i) = Variable A, B, C from web data source (i) A(ori), B(ori), C(ori) = Variable A, B, C from original dataset
4. Illustrative Example
We present the example of our proposed framework using financial dataset obtained from Standard & Poor’s Compustat North America dataset. The data were extracted for the first quarter 2009. The dataset comprises of twenty companies randomly selected with four variables which are: selling, sales,
1234567890
ICCSCM 2017 IOP Publishing
IOP Conf. Series: Journal of Physics: Conf. Series 892 (2017) 012009 doi :10.1088/1742-6596/892/1/012009
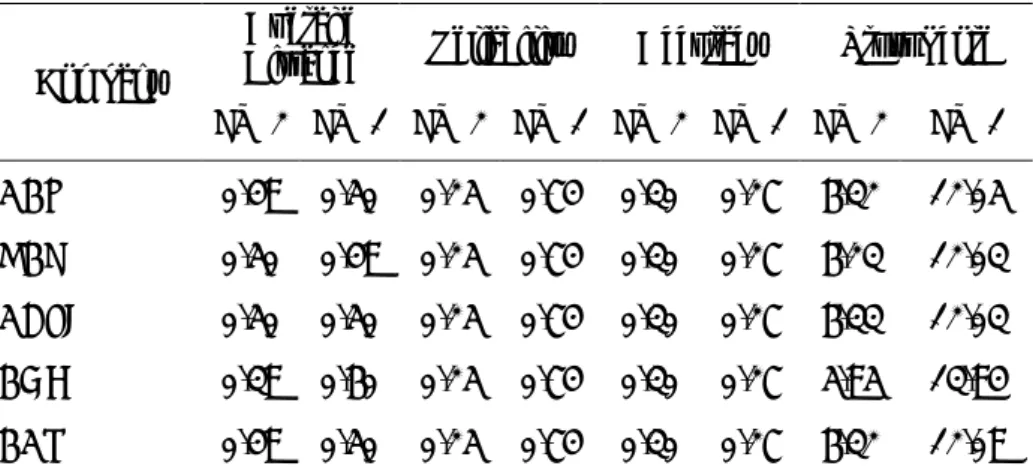
net income and gross profit. Data values in each variables explained total in million dollars for the respective company in the first quarter of 2009. Among the selected variables, sales, net income and gross profit has no missing values. Whereas, five companies has missing values in the selling variable. We build the ontology in Protégé 4.3 which used to map data values from the web data sources to the data values in the original dataset. All the measurement discussed before is coded in R environment. In this example, two financial website is used to retrieve candidates to replace missing data. It is noted from table 1 that the retrieved data from both financial website exhibited conflicting values in selling variable. Thus, it justified the needs to measure the trust score before any replacement of missing values being made.
Table 1. Conflicting values in selling variables.
Company Original dataset Financial website 1 Financial website 2
ABT Missing 2230 2225
NBR Missing 69.28 69.30
ADSK Missing 283.4 47.1
BHI Missing 283 283
BAX Missing 788 788
The resulted study showed that all data values retrieved from financial website 1 is given highest trust score compared to data values from financial website 2. It is shown in table 2 that the accuracy score and Dvariable in data values from both financial websites is not much different, but as the reliability score between both financial website has a wide gap, we can see a large different between their trust score.
Table 2. Resulted trust score for each missing values.
Company
Average
Distance Reliability Accuracy Trust Score FW 2 FW 1 FW 2 FW 1 FW 2 FW 1 FW 2 FW 1 ABT 0.49 0.50 0.25 0.74 0.30 0.27 6.32 12.05 NBR 0.50 0.49 0.25 0.74 0.30 0.27 6.23 12.03 ADSK 0.50 0.50 0.25 0.74 0.30 0.27 6.33 12.03 BHI 0.39 0.60 0.25 0.74 0.30 0.27 5.95 13.94 BAX 0.49 0.50 0.25 0.74 0.30 0.27 6.32 12.09
In comparisons to the original data, financial website 1 has a total of sixteen similar data values and total errors of 8735.23 in sales, net income and gross profit. In order to calculate the total errors, we measured the discrepancies between each data values of sales, net income and gross profit from web data source and the original data. On the other hand, a total of eighteen data values from financial website 2 has been identified as similar to the original data, but higher total errors of 11279.33 is recorded. As shown in table 2, the accuracy of data values retrieved from financial website 2 is higher than financial website 1. The high number of similar data values retrieved from financial website 2 compared to financial website 1 explained the findings. However, the reliability score of data values from financial website 2 is much lower as higher total errors is recorded in data values retrieved from financial website 2.
1234567890
ICCSCM 2017 IOP Publishing
IOP Conf. Series: Journal of Physics: Conf. Series 892 (2017) 012009 doi :10.1088/1742-6596/892/1/012009
We ranked the trust score of each data values retrieved from financial website 1 and financial website 2 in table 3. Based on the ranking, we then selected data values with highest trust score to replace missing values in the original dataset. In this example, all the missing values have been replace with data values retrieved from financial website 1.
Table 3. Ranking of data values from web data source according to trust score.
Ranking Selected
data value
First Second
Missing value 1 financial website 1 financial website 2 2230
Missing value 2 financial website 1 financial website 2 69.28
Missing value 3 financial website 1 financial website 2 283.4
Missing value 4 financial website 1 financial website 2 283
Missing value 5 financial website 1 financial website 2 788
5. Conclusion
In this paper, we propose a framework to manage missing values by replacing it with a trustworthy data values from web data sources. The framework address the problem of replacing missing values with conflicting values from web data sources by providing trust score measurement before any replacement being made. Furthermore, the trust score provided in this framework facilitate user to gain confidence in using the completed dataset for data analysis.
The proposed framework is our initial work towards trusted missing values management approach. Way forward, evaluation of the proposed approach should be carry out by analyzing the usability of the proposed approach in MCAR, MAR and MNAR mechanism. In view that reliability and accuracy played important role in determining the trust score, further study can be done to analyze any correlation between reliability, accuracy and trust score.
References
[1] R. Deb and A. W.-C. Liew Missing value imputation for the analysis of incomplete traffic accident data 2016 Information Sciences339 pp 274–289
[2] C.-F. Tsai and F.-Y. Chang Combining instance selection for better missing value imputation 2016 Journal of Systems and Software122, pp 63–71
[3] G. Baio and B. Leurent An Introduction to Handling Missing Data in Health Economic Evaluations 2016 Care at the End of Life39 Cham: Springer International Publishing pp 73–85 [4] Y. Liu, J. Li, and Z. Zou Determining the Real Data Completeness of a Relational Dataset 2016
Journal of Computer Science and Technology31 no. 4 pp 720–740
[5] A. Wechsler and A. Even Assessing Accuracy Degradation Over Time With a Markov-Chain Model 2012 Proceedings of the 17th International Conference on Information Quality (ICIQ-12) pp 99–110
[6] C. Batini and M. Scannapieca 2006 Data Quality (Springer Berlin Heidelberg)
[7] V. Jayawardene, S. Sadiq, and M. Indulska An Analysis of Data Quality Dimensions 2013
ITEE Technical Report No. 2013-011 pp 1–32
[8] M. Bovee, R. P. Srivastava, and B. Mak A conceptual framework and belief-function approach to assessing overall information quality 2003 International Journal of Intelligent Systems 18
no. 1 pp 51–74
[9] B. K. Kahn, D. M. Strong, and R. Y. Wang Information quality benchmarks: product and service performance 2002 Communications of the ACM45 no. 4 pp 184–192
1234567890
ICCSCM 2017 IOP Publishing
IOP Conf. Series: Journal of Physics: Conf. Series 892 (2017) 012009 doi :10.1088/1742-6596/892/1/012009
[10] S. Sadiq 2013 Handbook of Data Quality (Berlin, Heidelberg: Springer Berlin Heidelberg) [11] T. Dasu and J. M. Loh Statistical Distortion: Consequences of Data Cleaning 2012 Proceeding
of the VLDB Endowment5 no. 11 pp 1674–1683
[12] J. Du and L. Zhou Improving financial data quality using ontologies 2012 Decision Support Systems54 no. 1 pp 76–86
[13] X. Yin, J. Han, and P. S. Yu Truth discovery with multiple conflicting information providers on the Web 2008 IEEE Transactions on Knowledge and Data Engineering20 no. 6 pp 796–808 [14] X. Chu, J. Morcos, I. F. Ilyas, M. Ouzzani, P. Papotti, N. Tang, and Y. Ye KATARA: A Data
Cleaning System Powered by Knowledge Bases and Crowdsourcing 2015 Proceedings of the 2015 ACM SIGMOD International Conference on Management of Data - SIGMOD ’15 pp 1247–1261
[15] R. J. A. Little and D. B. Rubin 1987 Statistical Analysis with Missing Data2 1987
[16] R. J. A. Little A Test of Missing Completely at Random for Multivariate Data with Missing Values 1988 Journal of the American Statistical Association83 p.p 1198
[17] A. C. Acock Working With Missing Values 2005 Journal of Marriage and Family 67 no. 4 pp 1012–1028
[18] B. E. Cox, K. McIntosh, R. D. Reason, and P. T. Terenzini Working with Missing Data in Higher Education Research: A Primer and Real-World Example 2014 The Review of Higher Education37 no. 3 pp 377–402
[19] J. L. Schafer and J. W. Graham Missing data: Our view of the state of the art 2002
Psychological Methods7 no. 2 pp 147–177
[20] C. Paul, W. M. Mason, D. McCaffrey, and S. A. Fox A cautionary case study of approaches to the treatment of missing data 2008 Statistical Methods and Applications17 no. 3 pp 351–372 [21] D. Michie, D. J. Spiegelhalter, C. C. Taylor, E. D. Michie, D. J. Spiegelhalter, and C. C. Taylor
Machine Learning, Neural and Statistical Classification 1994 Ellis Horwood series in artificial intelligence37 no. 4 p.p, 289
[22] J. Cao, X. Diao, N. Zhang, and T. Wang An Approach Using Hidden Markov Model for Estimating and Replacing Missing Categorical Data 2011 Proceedings of the 16th International Conference on Information Quality (ICIQ-11) no. 427 pp 427–434
[23] P. Royston Multiple imputation of missing values 2004 The Stata journal4 no. 3 pp 227–241 [24] G. E. A. P. A. Batista and M. C. Monard A study of k-nearest neighbour as an imputation
method 2002 Frontiers in Artificial Intelligence and Applications87 pp 251–260 [25] L. Torgo, Data Mining with R 2010 20105341 (Chapman and Hall/CRC)
[26] E. Acuña and C. Rodriguez The Treatment of Missing Values and its Effect on Classifier Accuracy 2004 Classification, Clustering, and Data Mining Applications Berlin, Heidelberg: Springer pp. 639–647
[27] D. J. Stekhoven and P. Bühlmann Missforest-Non-parametric missing value imputation for mixed-type data 2012 Bioinformatics28 pp 112–118
[28] A. K. Waljee, A. Mukherjee, A. G. Singal, Y. Zhang, J. Warren, U. Balis, J. Marrero, J. Zhu, and P. D. Higgins Comparison of imputation methods for missing laboratory data in medicine 2013 BMJ Open3 no. 8
[29] M. Misztal Some remarks on the data imputation ‘MissForest’ Method 2013 pp 169–179 [30] O. Curé Improving the Data Quality of Drug Databases using Conditional Dependencies and
Ontologies 2012 Journal of Data and Information Quality4 no. 1 pp 1–21
[31] N. Martin, A. Poulovassilis, and J. Wang A Methodology and Architecture Embedding Quality Assessment in Data Integration 2014 Journal of Data and Information Quality4 no. 4 pp 1–40 [32] S. Destercke, P. Buche, and B. Charnomordic Evaluating Data Reliability: An Evidential
Answer with Application to a Web-Enabled Data Warehouse 2013 IEEE Transactions on
Knowledge and Data Engineering25 no. 1 pp 92–105
[33] S. Geisler, S. Weber, and C. Quix Ontology-Based Data Quality Framework for Data Stream Applications 2011 Proceedings of the 16th International Conference on Information Quality
1234567890
ICCSCM 2017 IOP Publishing
IOP Conf. Series: Journal of Physics: Conf. Series 892 (2017) 012009 doi :10.1088/1742-6596/892/1/012009
(ICIQ-11) pp 145–159
[34] L. Gao, M. Bruenig, and J. Hunter Semantic-based Detection of Segment Outliers and Unusual Events for Wireless Sensor Networks 2013 Proceedings of the 18th International Conference on Information Quality (ICIQ-13) pp 102–119
[35] C. Baillie, P. Edwards, and E. Pignotti QUAL: A Provenance-Aware Quality Model 2015
Journal of Data and Information Quality5 no. 3 pp 1–22
[36] T. R. Gruber A translation approach to portable ontology specifications 1993 Knowledge Acquisition5 no. 2 pp 199–220
[37] Y. Lu and D. Yang Information exchange in virtual communities under extreme disaster conditions 2011 Decision Support Systems50 no. 2 pp. 529–538
[38] R. M. Rodríguez, D. Ruan, J. Liu, A. Calzada, and L. Martínez Imputing Missing Values in Nuclear Safeguards Evaluation by a 2-Tuple Computational Model 2010 Artificial Intelligence
and Soft Computing pp 202–209
[39] Q. Li, Y. Li, J. Gao, L. Su, B. Zhao, M. Demirbas, W. Fan, and J. Han A confidence-aware approach for truth discovery on long-tail data 2014 Proceedings of the VLDB Endowment8 no. 4 pp 425–436
[40] C. Batini, C. Cappiello, C. Francalanci, and A. Maurino Methodologies for data quality assessment and improvement 2009 ACM Computing Surveys41 no. 3 pp 1–52
[41] R. Wang and D. Strong Beyond accuracy: What data quality means to data consumers 1996
Journal of management information systems12 no. 4 pp 5–33
[42] D. P. Ballou and H. L. Pazer Modeling Data and Process Quality in Multi-Input, Multi-Output Information Systems 1985 Management Science31 pp 150–163
[43] T. C. Redman 1996 Data quality for the information age (Boston: Artech House)
[44] Y. Wand and R. Y. Wang Anchoring data quality dimensions in ontological foundations 1996