FEDERAL AID AND STATE ECONOMIES:
EVALUATING THE OBAMA STIMULUS
Gerald Carlino
Federal Reserve Bank, Philadelphia
Robert Inman
Wharton School, University of Pennsylvania
OVERVIEW
I. U.S. States as “Agents” for Federal Policy
C
What Do US States Do for the Federal Government?
II. The Obama Stimulus: A
Bailout
?
C
Stimulus and State Assistance
C
A Reward for Past Fiscal “Indiscretions”?
III. How Will the States (As Agents) Spend the Stimulus?
C
Evidence from Past (1975-2005)Agents’ Behavior
C
Is the Past a Valid Guide for this Event?
IV. Will the Stimulus Work?
C
Macro Impact on National GDP and UE
0 .2 .4 .6 .8 1 % S ha re 1940 1960 1980 2000 2020 Year
Fed Share of All Gov't Service Provision (Non-Defense)
0 .2 .4 .6 .8 1 % S h a re 1940 1960 1980 2000 2020 Year
0 .2 .4 .6 .8 1 % S ha re 1940 1960 1980 2000 2020 Year
Fed Aid as Share of State/Local Revenue
0 20 0 40 0 60 0 $/ P er s o n 1940 1960 1980 2000 2020 Year
TOTAL Non Welfare Aid
I. U.S. States as “Agents” for Federal Policy
L
U.S. States as
Primary Providers
of Non-Defense Services
C
Education, Transportation, Health Care, Welfare, Protection,
Recreation, Environment, UE Insurance.
(FIGURE 1)
L
Federal Government as
Primary Financier
of Redistribution
C
Federal Administered
: Income Support for Elderly, Health
Insurance for Elderly.
C
State Administered
: Income Support for Poor, Health
Insurance for Poor, Low-Income Housing.
(FIGURE 2)
L
Federal Government as an
Important Financier
of Services
C
Service Aid as a Marginal Dollar: The Flypaper Effect
C
Service Aid as a Fraction of State Revenues:
.06
C
Service Aid as a Fraction of State Incomes:
.02
(FIGURES 3 AND 4)
L
The Agents in Trouble: 2009
C
States Budgets Reveal a Serious Fiscal Gap
TABLE 1:
STATE BUDGETS in 2009
(Working Through an Example for An Average State)
NORMAL TIMES
OWN CURRENT REV. OWN CURRENT EXP. OWN SURPLUS/DEFICIT NON-WELFARE AID FINAL SURPLUS
$3000/person $3516/person -$516/person $544/person $28/person
THIS RECESSION
OWN CURRENT REV. OWN CURRENT EXP. OWN SURPLUS/DEFICIT NON-WELFARE AID FINAL SURPLUS
$2800/person $3679/person -$879/person $544/person -$335/person*
EXHIBIT: California’s 2009 Budget Gap per Person = $997/person
IT’S EASY TO SEE W HY THE STATES CALLED FOR:
HELP
(!)
II. The Obama Stimulus: A Bailout?
L
How Much Federal Money for the States?
The American
Recovery
and
Reinvestment
Act:
3 YEAR (TOTAL) = $223.2 Billion
3 YEAR (
Recovery =
Stabilization + Welfare) = $101.4 Billion
3 YEAR (
Reinvestment =
Program + Projects) = $121.8 Billion
Approximate Annual Dollars Per Capita
TOTAL = $240/person
Recovery = $109/person
Reinvestment = $131/person
(Table 2)
L
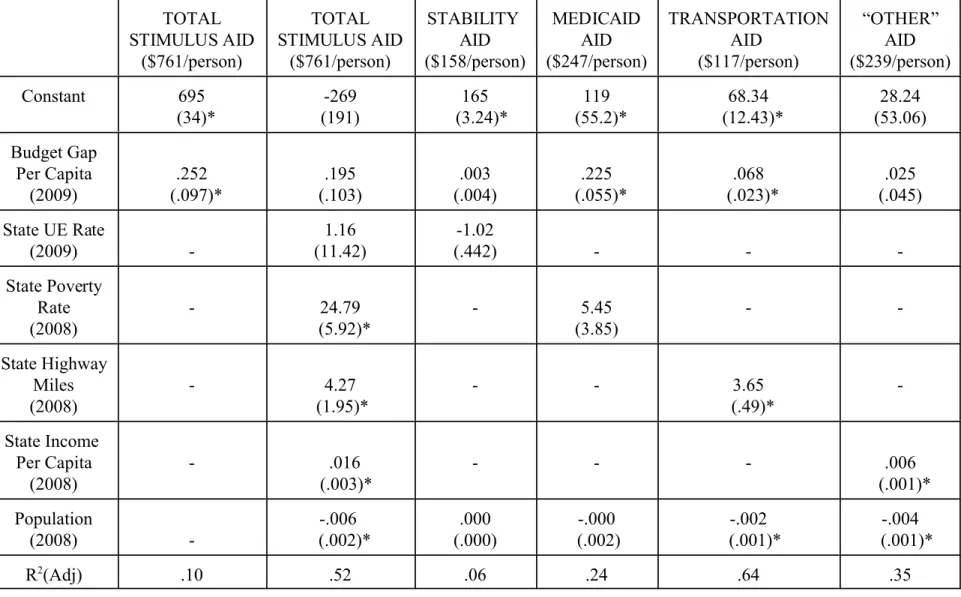
Does ARRA State Assistance “Look Like” a Bailout?
C
Recovery Aid
Correlated with
Budget Gap
and
Poverty
C
Reinvestment Aid
Correlated with
Budget Gap
and
Politics
(Table 3)
C
Budget Gap
Correlated with
2009 UE Only
(Table 4)
TABLE 2
:
AMERICAN RECOVERY AND REINVESTMENT ACT
(Billions of 2009 Dollars)
PROGRAM 3 Year Allocation (Billions)
TOTAL ARRA ASSISTANCE $787 Billion
TOTAL STATE ASSISTANCE $223.2 Billion
NON-WELFARE ASSISTANCE
Stabilization Fund: General Purpose $8.8
Stabilization Fund: Education $39.7
State Fiscal Relief: Title I (Education) $12.9
State Fiscal Relief: Special Education $12.1
Transportation $34.3
Miscellaneous $14.9
SUB-TOTAL: Non-Welfare Assistance $122.7 Billion
EXHIBIT: Per Capita Non-Welfare Assistance $396/person
WELFARE ASSISTANCE
TANF $5.0
Unemployment $7.0
Health Insurance: MEDICAID $80.6
Public Housing $7.8
SUB-TOTAL: Welfare Assistance $100.4
EXHIBIT: Per Capita Welfare Assistance $324/person
AVERAGE ANNUAL NEW FEDERAL AID:
NON-WELFARE: $132/person
WELFARE: $108/person
TABLE 3: CORRELATES OF OBAM A STIMULUS AID
TOTAL STIMULUS AID ($761/person) TOTAL STIMULUS AID ($761/person) STABILITY AID ($158/person) MEDICAID AID ($247/person) TRANSPORTATION AID ($117/person) “OTHER” AID ($239/person) Constant 695 (34)* -269 (191) 165 (3.24)* 119 (55.2)* 68.34 (12.43)* 28.24 (53.06) Budget Gap Per Capita (2009) .252 (.097)* .195 (.103) .003 (.004) .225 (.055)* .068 (.023)* .025 (.045) State UE Rate (2009) -1.16 (11.42) -1.02 (.442) - - -State Poverty Rate (2008) - 24.79 (5.92)* - 5.45 (3.85) - -State Highway Miles (2008) - 4.27 (1.95)* - - 3.65 (.49)* -State Income Per Capita (2008) - .016 (.003)* - - - .006 (.001)* Population (2008) --.006 (.002)* .000 (.000) -.000 (.002) -.002 (.001)* -.004 (.001)* R2 (Adj) .10 .52 .06 .24 .64 .35 *TABLE 4: CORRELATES OF THE 2009 “BUDGET GAP”
BUDGET GAP ($257) BUDGET GAP ($257) BUDGET GAP ($257) BUDGET GAP ($257) Constant -124 (123) -145 (157) -400 (244) -375 (231) State UE Rate (2009) 47.76 (14.96)* 44.57 (16.51)* 43.46 (16.38)* 47.63 (15.70)*State Own Surplus Per Capita (2005) - -.03 (.23) - -State “Cash” Per Capita (2005) - .01 (.03) -.01 (.03) -.02 (.03) State Expenditure Per Capita (2005) - - .109 (.239) .274 (.256)
State Own Revenue Per Capita (2005) - - .044 (.240) .027 (.255) Exp SD/Income (2005) - - --29520 (18022) Rev SD/Income (2005) - - -3045 (18181) R2 (Adj) .16 .10 .12 .22 *
III. How W ill the States (As Agents) Spend the Stimulus?
L
AGENT: GOVERNOR AS AGENDA-SETTER TO HOUSEHOLDS/LEGISLATURE
Maximize:
V =
"
[U(g, t) + (1-
N
)
C
*
rCU
(a, k
#
C
0, D
0, K
0)] + (1 -
"
)[P(g) +
N
C
*
pCU
(a, k
#
C
0, D
0, K
0)]
Subject to:
AID + t = g + k + a, where a = (c - d)
Yields a Demand System for Services (g), income (-t), investment (k), future income (d and c).
L
Estimated over 1976-2005 with Year and State Fixed Effects:
C
How Will $132 of Stimulus Aid be Allocated by the States?
)OWN SURPLUS )s = t - g - T )CURRENT RE V. (-t) )CURRENT EXP . (g) )OWN WELFARE EX P. (T) )CAPITAL OU TL AY S: k )DEBT INC UR RE D: d )CASH AN D S EC UR ITIES : c -$69/person -$59/person $10/person(Imposed*)
- $0 $8/person - $4/person
(Imp osed *)
$51/person
* Adding-up requires: )s + AID = [ t - g - T] + $132 = current accounts surplus = allocation to capital accounts = k + c - d.
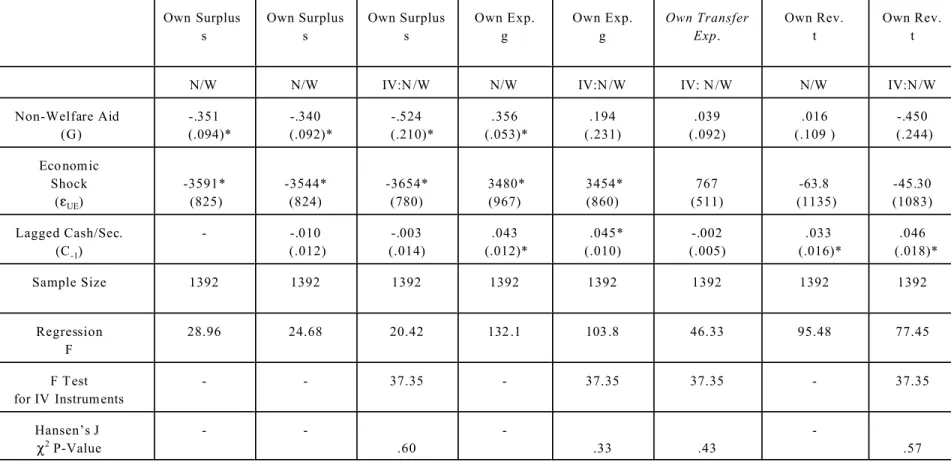
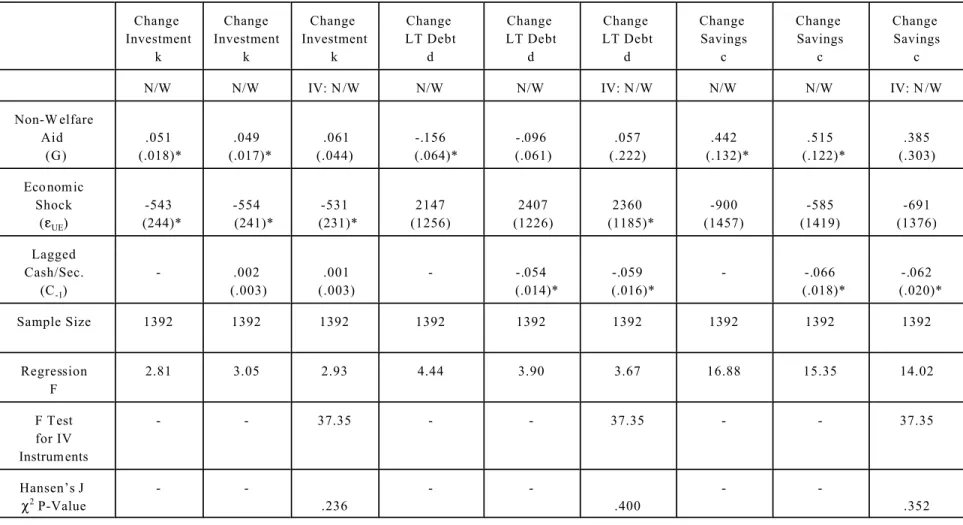
C
Unexpected UE shocks Reduce Own Surplus, Lower Own Investment, and Increase LT Debt
TABLE 5: Federal Aid and State Budgeting: Current Accounts
(1976-2005)† Own Surplus s Own Surplus s Own Surplus s Own Exp. g Own Exp. g Own Transfer Exp. Own Rev. t Own Rev. tN/W N/W IV:N /W N/W IV:N /W IV: N /W N/W IV:N /W
Non-Welfare Aid (G) -.351 (.094)* -.340 (.092)* -.524 (.210)* .356 (.053)* .194 (.231) .039 (.092) .016 (.109 ) -.450 (.244) Eco nom ic Shock (gUE) -3591* (825) -3544* (824) -3654* (780) 3480* (967) 3454* (860) 767 (511) -63.8 (1135) -45.30 (1083) Lagged Cash/Sec. (C-1) - -.010 (.012) -.003 (.014) .043 (.012)* .045* (.010) -.002 (.005) .033 (.016)* .046 (.018)* Sample Size 1392 1392 1392 1392 1392 1392 1392 1392 Regression F 28.96 24.68 20.42 132 .1 103 .8 46.33 95.48 77.45 F T est for IV Instrum ents
- - 37.35 - 37.35 37.35 - 37.35 Hansen’s J P2 P-Value - -.60 -.33 .43 -.57 †
All regressions include year and state fixed effects. Estimation uses the Newey-West (N/W) estimator for standard errors robust to heteroskedasticity and autocorrelation.
TABLE 6: Federal Aid and State Budgeting: Capital Accounts
(1976-2005)† Change Investment k Change Investment k Change Investment k Change LT Debt d Change LT Debt d Change LT Debt d Change Savings c Change Savings c Change Savings cN/W N/W IV: N /W N/W N/W IV: N /W N/W N/W IV: N /W
Non-W elfare Aid (G) .051 (.018)* .049 (.017)* .061 (.044) -.156 (.064)* -.096 (.061) .057 (.222) .442 (.132)* .515 (.122)* .385 (.303) Eco nom ic Shock (gUE) -543 (244)* -554 (241)* -531 (231)* 2147 (1256) 2407 (1226) 2360 (1185)* -900 (1457) -585 (1419) -691 (1376) Lagged Cash/Sec. (C-1) - .002 (.003) .001 (.003) - -.054 (.014)* -.059 (.016)* - -.066 (.018)* -.062 (.020)* Sample Size 1392 1392 1392 1392 1392 1392 1392 1392 1392 Regression F 2.81 3.05 2.93 4.44 3.90 3.67 16.88 15.35 14.02 F T est for IV Instrum ents - - 37.35 - - 37.35 - - 37.35 Hansen’s J P2 P-Value - -.236 - -.400 - -.352 †
All regressions include year and state fixed effects. Estimation uses the Newey-West (N/W) estimator for standard errors robust to heteroskedasticity and autocorrelation.
IV. Will the Stimulus Work?
L
Macro Impact on UE
and GDP
C
No Impact of State Deficits on State UE
(Table 7)
BEWARE
: FALLACY OF COMPOSITION
C
Estimate of Federal Deficit Financed Aid on GDP & UE
(Work In Progress: Estimation of Structural VAR)
Y
t= {g
fed, t
fed, aid
fed, g
s/R, t
s/R, gdp}
B(L)
C
Y
t=
g
tor
Y
t= B(L)
-1C
g
tor
Y
t= D(L)
C
g
twhere D(L) is the structural impulse response function of Y
tw.r.t.
g
tC
”Back of the Envelope” Estimates Based on Blanchard-Perotti
July 1, 2009:
)
GDP = $17.2 B
July 1, 2010:
)
GDP = $50.7 B
July 1, 2011:
)
GDP = $87.1 B
July 1, 2012:
)
GDP = $69.8 B
INCREASE OVER 3 YEARS OF $220 B STIMULUS = $225 B
TABLE 7:
FEDERAL AID AND STATE (UN)EMPLOYMENT RATES
1. STATE EMPLOYMENT
Employment Rate = (year effects, state effects) + 1.059CEmpRate-1 -.159CEmpRate-2 - .141CEmpRate-3 (.028)* (.041)* (.027)*
R2
(Adj.) = .94
2. IS THERE A KEYNESIAN IMPACT OF STATE DEFICITS AT THE STATE LEVEL?
Employment Rate = (year effects, state effects) + 32-tCEmpRate-t + .000003Cs-1 - .0000008Cs-2 (.000002) (.0000010)
R2
(Adj.) = .94
3. WILL THE OBAMA STIMULUS HELP STATE EMPLOYMENT RATES?
Employment Rate = (year effects, state effects) + 32-tCEmpRate-t + .0000011C (.0000039)
R2(Adj.) = .94
F Test for IV Instruments = 49.99; Hansen’s J P2
TABLE 8A: “Back of the Envelope” Estimates of Impact of $1 of Stimulus Aid on GDP
)GDP QUARTER 1 )GDP QUARTER 4 )GDP QUARTER 8 )GDP QUARTER 12 )TAX = -$.45 -.69(-.45) = .31 -.74(-.45) = .33 -.72(-.45) = .32 -.22(-.45) = .10 )SPENDING = $.14 .84(.14) = .12 .45(.14) = .06 .54(.14) = .08 1.13(.14) = .16 TOTAL IMPACT $.43 $.39 $.40 $.26TABLE 8B: “Back of the Envelope” Estimates of Impact of Aggregate Stimulus Aid on GDP
Aggregate Impact by July 1, 2009 Aggregate Impact by July 1, 2010 Aggregate Impact by July 1, 2011 Aggregate Impact by July 1, 2012 $40 Billion March, 2009 $17.2 B $15.6 B $16 B $10.4 B $90 Billion July 1, 2009 - $35.1 B $36 B $23.4 B $90 Billion July 1, 2010 - - $35.1 B $36 B TOTAL AGGREGATE IMPACT $17.2 B $50.7 $87.1 B $69.8 B
IV. Will the Stimulus Work?
L
Micro Impact on State Economies
C
Micro Economic Impact of
Differentially
Good State Fiscal Policies
t
Households Move In, Rents Rise, Wages Fall
t
Firms Move In, Jobs Increase, Rents Rise, Wages Rise
OVERALL EFFECTS:
Population Increases, Jobs Increase, Rents Rise, Wages Uncertain
C
DIFFERENTIAL FEDERAL AID THE STATE’S REAL
ECONOMY
Ann ual Ra te of Net In-Migration
Annual Rate of New Job Creation
Annual Rate of W age G rowth Annual Rate of House Price Appreciation M ean V alue: .002 .021 .013 .014 CONTRIBUTION OF: s - 0 - 0 - 0 - 0 )k .00035 .00029 - 0 .001 )d - 0 - 0 - 0 - 0 )c .0011 .00081 - 0 .002 TOTAL EFFECT .0015 .0011 - 0 .003 % IMPROVEMENT 75% 5.2% 0% 21%
BEWARE, AGAIN
: FALLACY OF COMPOSITION
(Table 9)
TABLE 9: State Budgeting and the State Economy
(1972-2005)† Ne t In-migration n Ne t In-migration n Labor Force Gro wth R Labor Force Gro wth R W age Gro wth w W age Gro wth w Hom e Value Appreciation r Hom e Value Appreciation rN/W IV: N /W N/W IV: N /W N/W IV: N /W N/W IV: N /W
Lagged Change Investm ent: k .000025 (.000008)* - .000021 (.000009)* - -.000003 (.00001) - .000074 (.000023)* -Lagged Change LT Debt: d -.000018 (.000004)* - -.000016 (.000004)* - -.000006 (.000004) - -.000039 (.000013)* -Lagged Change Savin gs: c .000014 (.000003)* - .000010 (.000003)* - .000003 (.000004) - .000025 (.000009)* -Contempo raneous Ln(Prod. Shock) -.002 (.003) -.007 (.003)* .002 (.003) .002 (.004) .013 (.004)* .013 (.005)* .017 (.009) .008 (.011) Non-W elfare Aid G -.000021 (.000019) -.000014 (.000018) -.000027 (.000020) -.00005 (.00004) Sample Size 1632 1440 1632 1536 1632 1536 1632 1440 Regression F 19.81 11.07 44.84 32.53 43.43 35.83 17.78 13.77 F Test for IV In strume nts - 38.29 - 41.27 - 41.27 - 38.29 Hansen’s J P2 P-Value - .83 - .13 - .01 - .93 †
All regressions include year and state fixed effects. Estimation uses the Newey-West (MN/W) estimator for standard errors robust to heteroskedasticity and autocorrelation.