A N N U A L R E P O R T
3 0 J U N E 2 0 1 5
Page 1
CONTENTS
PAGE
CORPORATE DIRECTORY 2 CEO'S REPORT 3 DIRECTORS' REPORT 4AUDITOR'S INDEPENDENCE DECLARATION 20
CONSOLIDATED STATEMENT OF PROFIT OR LOSS AND COMPREHENSIVE INCOME 21
CONSOLIDATED STATEMENT OF FINANCIAL POSITION 22
CONSOLIDATED STATEMENT OF CASH FLOWS 23
CONSOLIDATED STATEMENT OF CHANGES IN EQUITY 24
NOTES TO AND FORMING PART OF THE FINANCIAL STATEMENTS 26
DIRECTORS' DECLARATION 55
INDEPENDENT AUDIT REPORT 56
Page 2 Directors
Mr Peter Chambers – Non-Executive Chairman Mr Darryl Harris – Non-Executive Director Mr Darjoto Setyawan – Non-Executive Director Mr Hendra Surya – Non-Executive Director Chief Executive Officer
Mr Arran Marshall
Company Secretary Mr Richard Edwards
Registered and Principal Office Level 2, 66 Hunter Street
Sydney, NSW, 2000 Australia
Telephone: +61 2 9300 3377 Facsimile: +61 2 9221 6333
Share Register
Computershare Investor Services Pty Ltd Level 4 60 Carrington Street Sydney NSW 2000 Telephone: 1300 787 272 International: +61 3 9415 4000 Facsimile: +61 3 9473 2500
Stock Exchange Listing
Australian Securities Exchange Limited Home Branch – Perth
2 The Esplanade Perth WA 6000
ASX Code
IDO – Fully paid ordinary shares Solicitors
Herbert Smith Freehills QV.1 Building
250 St Georges Terrace Perth WA 6845
Hadiputranto, Hadinoto & Partners The Jakarta Stock Exchange Building Tower II, 21st Floor
Sudirman Central Business District Jl. Jendral Sudirman Kav 52-53 Jakarta 12190 Auditor PricewaterhouseCoopers Brookfield Place 125 St Georges Terrace Perth WA 6000 Bankers
National Australia Bank Westpac Banking Corporation
Page 3
Against the backdrop of the weakening global economic conditions and lower commodity prices the company has faced numerous challenges this year in the development of the Kulon Progo iron sands/pig iron project. However restructuring of the Company’s operations and focus on operating cost optimisation has placed the Company in a strong position to positively progress the development of its flagship project at Kulon Progo.
An unprecedented drop in the value of both iron ore and finished steel product has been driven by the Chinese to drive export growth in the sector to counter weaker internal demand. In many cases Chinese producers are so desperate for cash on balance sheet, they are selling finished product cheaper than pig iron. This has seen consolidation in the Chinese market take longer than anticipated and the impact on pricing has been significant, seeing almost a 30% drop since December 2014. In addition Chinese, South Korean and Taiwanese producers are putting significant pressure on Western and Japanese steel producers as they operate in much lower cost environments.
This influx of cheap Chinese imports has filtered through to Indonesian domestic sales – the Indonesian Government has applied tariffs to finished product imports such as rebar, but will have to be more aggressive if they wish to protect and nurture development of a domestic steel industry as stated in the 2011 Economic Masterplan.
In 2014, Indonesia experienced a 6 percent increase in steel sales to 15.1 million tonnes, while domestic capacity is only approximately 7 million tonnes. This significant deficit is the reason foreign steel producers such as Mitsubishi Steel Manufacturing and Nippon Steel and Sumitomo Metal Corporation invested US$450 million for the acquisition of Jatim Steel and the establishment of steel facilities with Indonesia’s Krakatau Steel. Additionally, Indonesia’s new Government’s drive to attract significant foreign investment in infrastructure, makes Indonesia an attractive proposition to long product manufacturers.
However Indonesian steel mills have suffered from high operating costs and a reliance on EAF steelmaking from primarily scrap – this raw material limitation on steel makers has made them uncompetitive with Chinese imports. This reliance on scrap as a raw material is driven by the fact domestic iron ore tends to be poor quality and coking coal deposits suitable for steel making are virtually non-existent in Indonesia.
Indo Mines’ strategy to develop an RKEF plant in central Java utilises low cost iron sand concentrate and low rank coal. All raw materials are sourced locally and produce a high quality pig iron that is suitable for either steel billet or upgrading to foundry pig iron with ferro-manganese. Vanadium concentrate (16.5% V2O5) is a by-product of the process, as is power generation from volatile gases produced from charring coal. The Company’s ultimate goal is to align itself with one of the large foreign steel producers already committed to developing a steel mill in Indonesia.
However as with all junior developers in the resource space, the key focus has been to retain as much cash as possible while maintaining progress. A significant focus has been cutting operational expenses at the local company level while progressing the project through to feasibility. The first phase of the definitive feasibility study has been completed. This included basic engineering design of the beneficiation plant, GAP analysis for Equator Principle standard studies and SL/RN test work on both the iron sand and coal raw material.
It is anticipated that the next year will see completion of the bankable feasibility study, a continued focus on cost reduction and alignment of the Company with a significant strategic partner. In closing I would like to take this opportunity to thank all of the project team for their application and hard work over the past year and look forward to making positive progress in the coming year.
Arran Marshall
30 JUNE 2015
Page 4
The Directors of Indo Mines Limited present their report on the Consolidated Entity consisting of Indo Mines Limited (“the Company” or “Indo Mines” or “Parent Entity”) and the entities it controlled at the end of, or during, the year ended 30 June 2015 (“Consolidated Entity” or “Group”).
DIRECTORS
The names of Directors in office at any time during the financial year or since the end of the financial year are: Mr Peter Chambers Non-Executive Chairman
Mr Christopher Catlow Non-Executive Director (resigned 30 September 2014) Mr Darryl Harris Non-Executive Director
Mr Darjoto Setyawan Non-Executive Director Mr Hendra Surya Non-Executive Director
Ms Stacey Apostolou Executive Director (resigned 30 September 2014)
Unless otherwise disclosed, Directors held their office from 1 July 2014 until the date of this report. CURRENT DIRECTORS AND OFFICERS
Peter Chambers – Non-Executive Chairman
Qualifications – B Bus.
Mr Peter Chambers most recently held the position of Managing Director - Strategy and Governance with the Rajawali Group which he retired from at the end of June 2014. He served as a member of the Board of Directors of PT. Rajawali Corpora since 2005. Mr Chambers is a member of the Board of Commissioners and Chairman of the Audit Committee of Excelcomindo, Indonesia's third largest mobile telephone operator. He was one of the key persons when Rajawali established Excelcomindo in the late 1990s.
He has more than 20 years' experience in the finance and telecommunications industries having been the Head of the South East Asia Communication Practice of Coopers and Lybrand (Hong Kong based). Mr Chambers has also held executive roles with various international companies over the years.
Mr Chambers graduated from the Royal Melbourne Institute of Technology in Melbourne, Australia, with a degree in Finance and Accounting.
Mr Chambers was appointed a Director of Indo Mines on 26 November 2012 and has not held a directorship in any other listed company in the past three years.
Darryl Harris – Non-Executive Director
Qualifications - B.Sc. MAusIMM
Mr Harris is an engineering metallurgist with over 35 years’ experience in the design and commissioning of mineral processing plants, across a range of different commodities. Mr Harris has had a long association with engineering companies including Nedpac, Signet Engineering, Lurgi and Outotec. He was involved in the development of various projects, including project coordinator for the An Feng-Kingstream Steel Project and other Australian ferrous projects as well a several projects in Indonesia.
Mr Harris was appointed a Director of Indo Mines on 16 June 1987 and during the three year period to the end of the financial year, Mr Harris also held a directorship in Consolidated Tin Mines Limited (October 2010 – present).
30 JUNE 2015
Page 5 CURRENT DIRECTORS AND OFFICERS (continued) Darjoto Setyawan – Non-Executive Director
Qualifications – BSc, Masters of Management
Mr Darojoto Setyawan has been employed with the Rajawali Group since 1996 and has held the role of Managing Director - Mining & Resources since 2005. He was the President Director of the Bentoel Group, a subsidiary of Rajawali, from 1996 to 2006 and continued from 2006 - 2009 as the President Commissioner. Under his leadership, the Bentoel Group successfully negotiated with a syndicate of international banks as well as two leading State-Owned banks and restructured its loans. During the same period Bentoel underwent some structural changes including organization restructuring. The loan and organizational restructuring have paved the way for Bentoel to regain its position as one of the biggest cigarette manufacturers in Indonesia.
In addition to being in charge of mining and resources, Mr Setyawan handles all matters related to external relations including those related to Government officials and agencies. He has also served as a member of the board on a number of companies where the Rajawali Group has an interest, including PT. Nusantara Infrastructure and the Semen Gresik Group.
Mr Setyawan was appointed a Director of Indo Mines on 26 November 2012 and has not held a directorship in any other listed company in the past three years.
Hendra Surya – Non-Executive Director
Qualifications – BSc, Masters of International Management
Mr Surya joined the Rajawali Group in 2005 and is currently the Deputy Managing Director - Mining and Resources. Since he joined with the Rajawali Group, Mr Surya has played a significant role in the on-going success of Rajawali’s business in Mining and Resources. His main contributions and deliverables include M&A, Corporate Finance, Project Development and Operation of Rajawali’s mining assets. He currently holds executive management positions in the several subsidiaries and affiliates of Rajawali Group and is President Director of PT Jogja Magasa Iron.
Prior to his role with the Rajawali Group, Mr Surya spent eight years with PricewaterhouseCoopers where he was involved with a number of government related projects and a wide number of privatisations and major project financings. He holds a Masters Degree in International Business from the American Graduate School of International Management in Arizona.
Mr Surya was appointed a Director of Indo Mines on 6 February 2012 and has not held a directorship in any other listed company in the past three years.
Chief Executive Officer Arran Marshall – BA, MBA
Mr Marshall most recently held the role of Country Head for AWR Lloyd in Indonesia. AWR Lloyd is a specialist mining and energy advisor in South East Asia. He holds an MBA from the Auckland University of Technology and his core competencies are in the areas of business development, project management/development, financial analysis, strategy, investor relations and capital markets.
Mr Marshall was appointed Chief Executive Officer of Indo Mines on 25 February 2014. Company Secretary
Richard Edwards – B Comm., CPA, SA Fin
Richard graduated with a Bachelor of Commerce degree from the University of New South Wales and is a member of CPA Australia and FINSIA. Following eight years as an owner/manager of his own business, Mr Edwards has worked for over ten years providing financial reporting and company secretarial services to a range of publicly listed companies in Australia with a focus on the mining sector. He was Company Secretary and Chief Financial Officer for Sumatra Copper & Gold plc for three years and Company Secretary and Chief Financial Officer of Callabonna Uranium Limited for two years. He is also Company Secretary of ASX listed Augur Resources Ltd and unlisted public companies Nickel Mines Limited and Prospech Limited. Mr Edwards was appointed Company Secretary of Indo Mines on 31 October 2014.
30 JUNE 2015
Page 6 MEETINGS OF DIRECTORS
The following table sets out the number of meetings of the Company's Directors held during the year ended 30 June 2015, and the number of meetings attended by each Director.
Board Meetings Number eligible to attend Board Meetings Number Attended Peter Chambers 4 4 Christopher Catlow (1) 1 1 Darryl Harris 4 4 Darjoto Setyawan 4 4 Hendra Surya 4 4 Stacey Apostolou (2) 1 1 (1)
Reflects the meetings held and Mr Catlow’s attendance up until the date of his resignation. (2) Reflects the meetings held and Ms Apostolou’s attendance up until the date of her resignation.
The membership of the audit committee was reconstituted during the year and consequently did not meet until the following the end of the financial year.
PRINCIPAL ACTIVITIES
The principal activities of the Consolidated Entity during the year consisted of mineral exploration and development activities and there has been no change in the nature of those activities.
DIVIDENDS
No dividends have been declared, provided for or paid in respect of the financial year ended 30 June 2015 (2014: nil).
EARNINGS PER SHARE
2015 Cents
2014 Cents
Basic earnings/(loss) per share (0.36) (9.1)
30 JUNE 2015
Page 7 CORPORATE STRUCTURE
Indo Mines is a company limited by shares that is incorporated and domiciled in Australia. The Company has prepared a consolidated financial report including the entities it incorporated and controlled during the financial year. CONSOLIDATED RESULTS 2015 $ 2014 $ Loss of the Consolidated Entity before income tax expense (3,142,244) (56,761,163)
Income tax expense - -
Net loss (3,142,244) (56,761,163)
Net loss attributable to minority interest (1,182,371) (7,828,990) Net loss attributable to members of Indo Mines Limited (1,959,873) (48,932,173)
OPERATING AND FINANCIAL REVIEW Operating Review
PT Jogja Magasa Iron (‘PT JMI’) is a joint venture between Indo Mines, which holds 70% of the issued capital and PT. Jogja Magasa Mining (‘PT JMM’) which holds the remaining 30%. PT JMM is a consortium of individuals, including the Sultan of Yogyakarta. Indo Mines and PT JMI are currently going through a restructuring process, from a mining company to a development organisation.
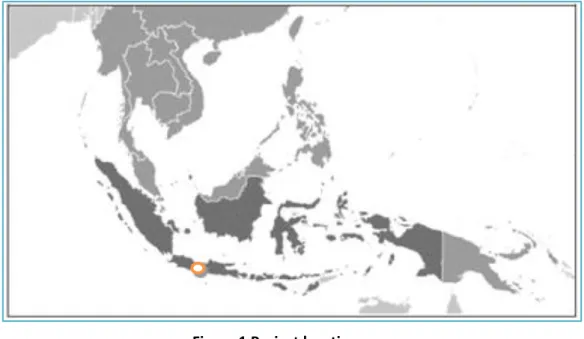
Figure 1 Project location map
PT JMI holds a Contract of Work (‘CoW’) concession in the Kulon Progo region, ~30 kilometres from the Javanese city of Yogyakarta. The CoW holds a production license to mine iron sands and produce pig iron within a 2,977 hectare area. The area covered by the license is approximately a 22 kilometre long by 1.8 kilometre wide stretch of beach, between the Kulon Progo and Serang Rivers. On 30 September 2015 the Company announced a 2012 JORC compliant resource update. For a summary of this report please see the Mineral Resources and Reserves Statement on page 59.
30 JUNE 2015
Page 8 Technical strategy
Indo Mines have reviewed over 30 alternative technologies to process the low average grade Kulon Progo iron sands – the key aspects technically was a process that accommodated 100% titano-magnetite iron sands and was able to accept elevated titania and domestic low rank coal. The chosen process also had to be low risk, proven and warrantable (for financing purposes). Both Hismelt and Ausiron were assessed including pilot plant trials, but there were issues in vanadium recovery (a key revenue line) and sourcing appropriate coal in Indonesia. Hismelt in particular is a complicated process and deemed un-warrantable, with no vanadium recovery available. In addition to restricted local coal sources appropriate as a reductant, there was no cost effective access to natural gas in the region.
Figure 1 Outotec SL/RN-Xtra process
After completing a techno-economic review on technology with Hatch Consultants during 2014, it became clear from both a technical and financial risk perspective, to replicate as close to the New Zealand Steel (NZS) iron making process as possible. The ‘bottle neck’ in the process is the capacity of the rotary kilns – but the hot direct reduced iron introduced to the submerged arc furnace allowed for consistent vanadium recovery and, more importantly, reliable operation with highly capricious slags.
The Hatch ‘mass and energy balance model’ for the rotary kiln and smelter has been utilised to assess the concentrate and other raw material consumptions, energy usage and product chemistry for 55% Fe at 105 micron, 58% Fe at 45 micron and 59% Fe at 38 micron feed. A premium pig iron product is produced from both 58% and 59% Fe concentrate feed, unfortunately not with 55% Fe feed which can only be utilised for blast furnace feed. The reason is very simple – the beneficiation process required to increase Fe content liberates significant gangue, in particular phosphorous and silica, which requires significant energy to process in furnace.
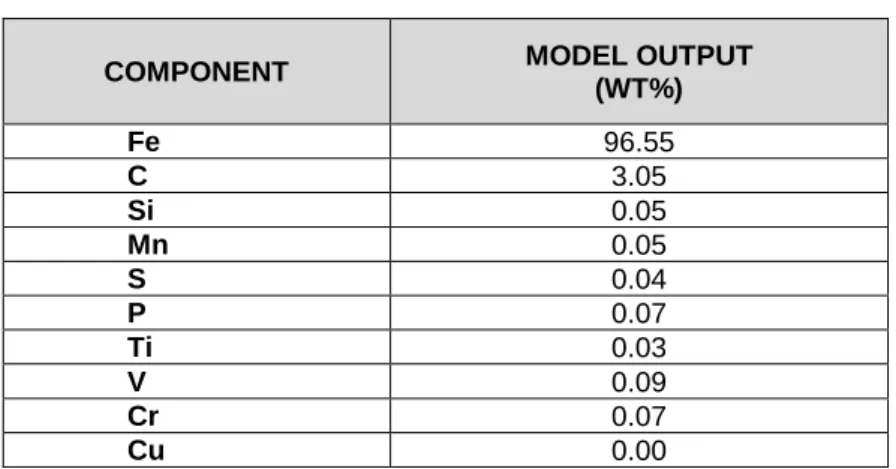
Table 1 Typical estimated pig iron product (Hatch pre-feasibility study
COMPONENT MODEL OUTPUT
(WT%) Fe 96.55 C 3.05 Si 0.05 Mn 0.05 S 0.04 P 0.07 Ti 0.03 V 0.09 Cr 0.07 Cu 0.00
30 JUNE 2015
Page 9
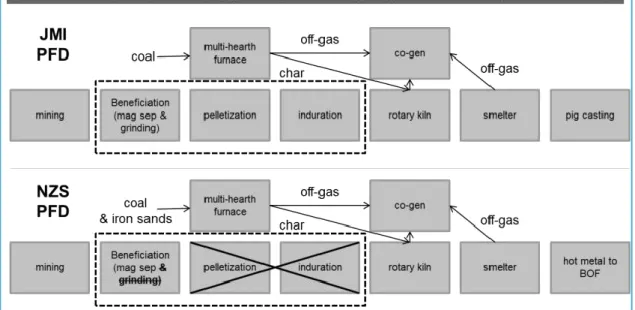
The pre-feasibility study focused on production associated with processing the current Kulon Progo reserves (first production module) – this will produce approximately 341ktpa pig iron. The remaining two production modules would focus on an NZS process where higher grade iron sands at 105 micron plus are introduced to the rotary kilns, removing the need for the agglomeration process, which provides for lower operating costs.
Opportunities for improvement
Indo Mines has hired key ex-NZS individuals with previous feasibility experience in developing operating efficiencies and additional revenue streams. These opportunities for improvement are available to Indo Mines and include but are not limited to;
A significant vanadium recovery increase from 60% as modelled by Hatch
Increased Cogeneration capability
Reduced phosphorus content
Beneficiation plant optimisation of yield recovery
Increased pig iron production tonnage
Refractory life optimisation (significant and practised by Indo Mines Head Technologist)
Key individuals with previous experience in these stated opportunities are available as and when required.
Figure 2 Process diagram comparison between JMI and NZS Power requirements
The co-generation plant will likely meet the power requirements of the iron plant only (smelter and perhaps rotary kiln). The plant size was determined by accounting for the beneficiation plant, iron plant power requirements, auxiliary loads, plant degradation, electrical losses and growth to account for future load increases as the process loads are finalised. The required net capacity of the power plant is 100 MW nominal which will be produced by a combination of 1 X 50 MW nominal coal-fired power plant unit and 1 x 50 MW off-gas waste heat recovery boilers (WHRBs). The co-generation plant will operate as a captive plant, and therefore is required to have high reliability. An emergency diesel generator can also be installed at the co-generation plant for redundancy purposes.
The Company has assumed at 1Mtpa pig iron capacity the power requirements will approximately triple, with all excess energy sold to the City of Yogyakarta PT PLN division (Indonesian national energy group).
30 JUNE 2015
Page 10 Potential logistics options
During the pre-feasibility study, Royal Haskoning DHV was appointed to assess potential logistic options for the project including viability of road, rail and port development. In addition, options were also assessed in moving oversized equipment to the site during construction phase – Royal Haskoning suggested Landing Craft Transport (LCT) was the preferable method to overcome the narrow and busy roads in Java Island. Development of a port is not financially practical at this stage.
Indo Mines commissioned LAPI-ITB to conduct logistical modelling (rail, road and port) to find an appropriate solution in regards to sea ports (Cirebon, Semarang, or Cilacap or combinations) to deliver raw materials to the plant site. The study is expected to be concluded by end of 2015.
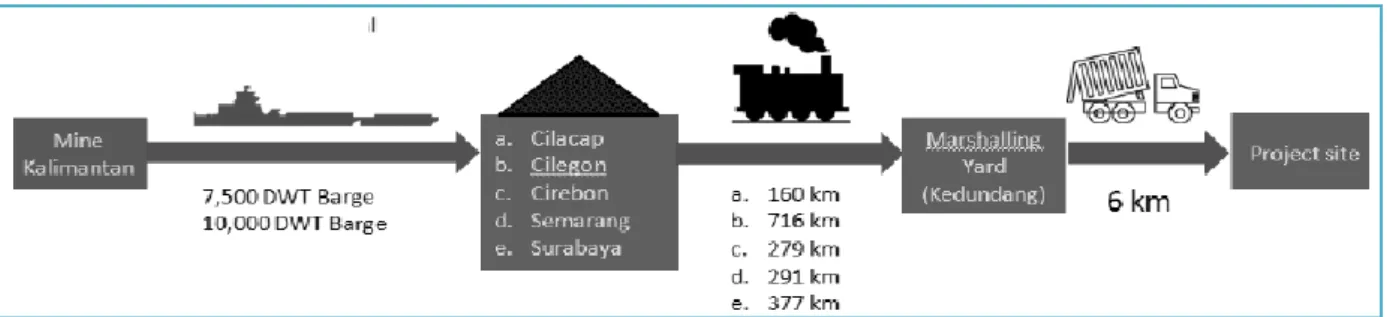
PT JMI has also consulted with PT Kereta Api (PT KAI), the Indonesian national rail carrier, on a potential ‘Public-Private Partnership’ (PPP) and ‘take or pay’ arrangements. A commercial rail line runs within 6 kilometres from the CoW and has proven to be a potential option for delivery of coal and iron sands from outside the region. The Royal Haskoning study confirms that capacity is available on this line that could fulfil the iron and power plant throughput requirements (even at 1Mtpa pig iron capacity). If the rail option is pursued then raw material would be barged to Cilacap then carried via train approximately 100 kilometres to Kedundang Station – from here raw material would be trucked the final 6 kilometres to site.
Figure 3 : Barge and rail logistics options (Royal Haskoning)
Basic Engineering Design (BED) for beneficiation plant contract
In November 2014 the Ferrostaal Indonesia BED contract for the iron sand beneficiation plant was reactivated after being put on hold in May 2014 (Ferrostaal was appointed in January 2014 by PT JMI). The suspension of the contract had occurred because of both Indonesia’s mineral ore export ban and the fact that beneficiation plant outputs would likely change, given the results of the pre-feasibility study on the iron plant.
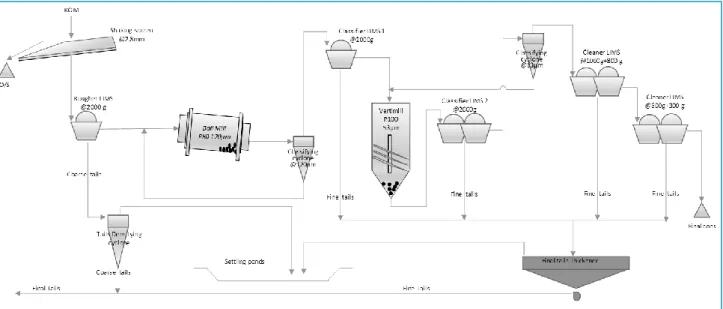
Due to the higher iron content required than initially requested in the original BED scope of work (55% Fe for Chinese export market), Figure 4 PT JMI concentrate plant basic PFD (closed circuit) the process flow design (PFD) that will see a concentrate produced at approximately 58% - 59% Fe with low phosphorous content (at 45 micron). This quality and consistency of supply to the reduction process is critical in producing a quality pig iron product.
Cyclones are utilised to separate large vs small particle size after grinding to lower grinding requirements - while low intensity magnetic separators (LIMS) minimize gangue collected along with magnetic material.
In addition Indo Mines has hired two ex-NZS employees:
Jeremy Bachelor has been with NZS for 36 years and was NZS Chief Chemist.
Paul Foote was previously a metallurgist and mining engineer for NZS and has 33 years of experience in developing, constructing and commissioning various coal and mineral plants around the world.
Both have proven to be invaluable assets to the company as the general understanding of iron sands compared to mineral sands by most consultants/companies is very poor.
30 JUNE 2015
Page 11
Figure 4 PT JMI concentrate plant basic PFD (closed circuit) Land acquisition
Industrial land in Java, Indonesia, is notoriously difficult to acquire and there are many good examples of large international infrastructure developers having to put projects on hold, because of the inability to acquire land or obtain permits. Meetings with high profile developers are impressed with the fact 160 hectares has been acquired to date for development of the smelter. In Sulawesi pricing of land for smelter development varies from US$80, 000 to US$100,000 per hectare.
PT JMI is fortunate to have stakeholders who understand managing industrial projects in Yogyakarta. Both PT Rajawali Corpora and PT JMM have a successful track record in land acquisition and know the importance of balancing project interest with local interests. Significant emphasis has taken place at PT JMI in its Community and Social Responsibility (CSR) program and local co-operative (Koperasi) activities (ground activities providing local employment and training). In conjunction with education and work programs, PT JMI has invested considerable time and money in understanding reclamation as the mining progresses down the beach. The CSR team has proven that crop yields will increase as the tailings are reclaimed – this is because many minerals that impact plant life from developing on the beach are removed in the beneficiation process.
The result has seen all permits and licenses issued that PT JMI has required to date from local villages, local authorities and Central Government. More importantly it has also seen the successful acquisition of 160.66 hectares of land for the iron plant site (within the CoW area) and continued support by the Sultan of Yogyakarta. Land acquired to date has been ‘cleared’, meaning farmers have been paid compensation for potential lost earnings – this gives PT JMI the right to use the land for industrial purposes. In addition the owners of the land, the Pakualaman Kingdom, are paid a yearly rent from total smelter revenue, with a grace period of 5 years until first payment. During the grace period PT JMI will pay a basic land rent to the Pakualaman Kingdom.
Successful land acquisition is one challenge in maintaining acquired industrial land. The area acquired then must be protected from farmers and villagers settling back into the cleared area. Another mining company made the unfortunate mistake of paying for land to be cleared, but they made the assumption the process was complete and allowed villagers to resettle in the cleared area. This ended up costing the company nearly double what they originally budgeted to complete the ‘clean & clear’ process.
PT JMI has taken the steps of building a fence around the boundary of the clean and clear area. This serves several purposes including protection of acquired area, continued ‘on-ground’ activities and jobs for the local community. In addition to the fence boundary PT JMI have recruited a significant number of security personnel from the local community.
30 JUNE 2015
Page 12
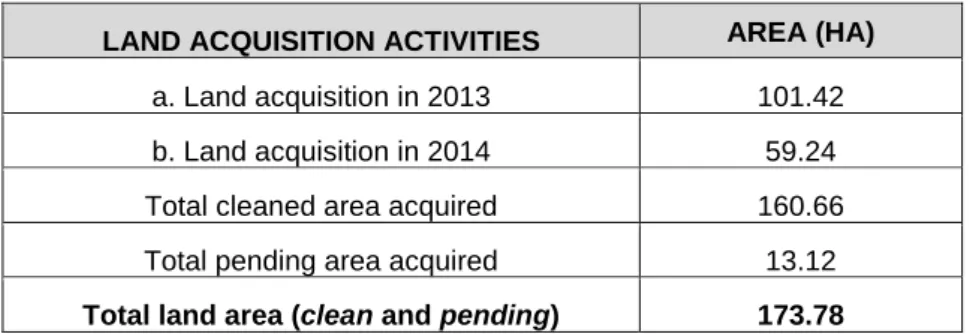
Table 2 Land Acquisition Activities
LAND ACQUISITION ACTIVITIES AREA (HA)
a. Land acquisition in 2013 101.42 b. Land acquisition in 2014 59.24 Total cleaned area acquired 160.66 Total pending area acquired 13.12
Total land area (clean and pending) 173.78
Definitive Feasibility Study
The completion of the pre-feasibility by Hatch Consultants in late 2014 led Indo Mines to a clear strategy on how to execute a smelter project by exploiting the Kulon Progo iron sand resource, both financially and technically. The next logical step in the feasibility process is to decrease the margin of accuracy from 30% - 20% +/- to a bankable 15% - 10% +/-, which from hereafter we will refer to as the Definitive Feasibility Study (DFS). This can only be achieved via a program of defining capital and operating costs further via engineering design work and further detailed test work on raw materials.
At the time of writing, DFS phase I is being closed out – this includes Basic Engineering Design (BED) of the beneficiation plant, test work in Germany of the SL/RN process, GAP analysis of the environmental and social studies to Equator Principle standard and upgrade of the JORC report to 2012 standard.
Phase II of the DFS will take at least the remaining months of 2015 to complete and H1 2016– the primary focus being:
Technical DFS of the pig iron plant at 340ktpa by Outotec.
Captive power plant and co-generation preliminary design and capacity.
Equatorial Principles (EP) standard social and environmental studies (1st tier funding requirement) based on gap analysis.
Detailed logistics analysis for land based solution.
Geotechnical – detailed soil investigation where heavy equipment is located i.e. smelter site, multi hearth furnace units etc.
Additional smelter test work on raw material (2 tonnes of concentrate is required) by Outotec.
The list of studies provided below includes advanced smelter test work on the DRI via Outotec’s facilities in both Frankfurt, Germany and Pori, Finland. Approximately 2 tonnes of 58-59% Fe concentrate will be required for Outotec’s pelletization, induration, rotary kilns and submerged arc furnace test work to provide process guarantees. This in turn will provide accurate power requirement data, pig iron yield/quality and slag partition ratios. Fortunately the design of the plant can proceed without completion of the test work – the design will be adjusted according to the results.
The current test work being undertaken by Outotec is sufficient to provide required data for basic engineering design of the agglomeration, induration and reduction equipment. Outotec has done significant work on Kulon Progo iron sands in the past and has a solid understanding of its behaviour within the pyro-metallurgical processes the concentrate is exposed to. In previous reduction and smelting test work carried out by Outotec in 2008 and 2011, the concentrate produced a premium DRI and pig iron product (utilising Ausiron process).
Outside the battery limits of the beneficiation and iron plant, the studies are not as detailed in either analysis or engineering design work. This is because it is likely power, water treatment and logistics facilities will be outsourced to third parties. The level of detail provided in these studies though, will allow PT JMI to negotiate with potential interested parties and have a Capex/Opex margin of error of approximately 20% (preliminary design and pre-feasibility study level).
30 JUNE 2015
Page 13
One of the most important studies to be undertaken by PT JMI during the DFS, is preparing additional information or studies that were not covered in the current AMDAL report (Indonesian environmental study) but required by Equatorial Principles standard environmental and social analysis. PT JMI has completed a gap analysis on all the existing studies/documents it has already completed to date – this has been insightful for the DFS Project Management team, as there is a significant body of work already in existence that will provide valuable data towards supplementing the AMDAL report.
Indo Mines has worked with CRL Labs and Paul Foote in New Zealand, to assist Ferrostaal Indonesia in beneficiation test work of the iron sand for the BED contract. Various analysis is being undertaken which in turn has identified the need to utilise a low intensity magnetic rougher to separate low grade magnetite from the high grade. This is because low grade iron sand will not liberate iron, even under the most intense grinding – for efficiency purposes it is best to screen this material out immediately, thus increasing both yield and plant performance (12% yield from mining to concentrate confirmed from Ferrostaal Indonesia after they performed scout test 3 under observation and advice from Paul Foote).
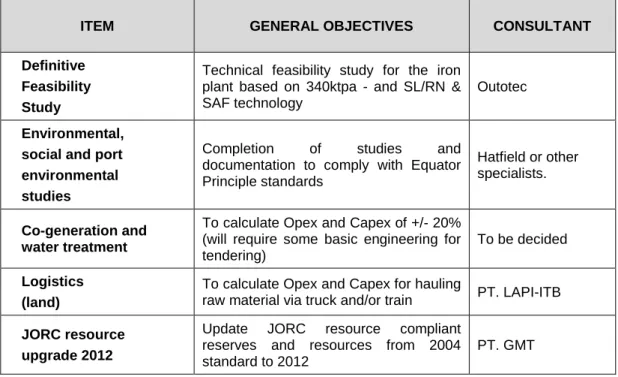
Table 3 DFS studies and potential consultants
ITEM GENERAL OBJECTIVES CONSULTANT
Definitive Feasibility Study
Technical feasibility study for the iron plant based on 340ktpa - and SL/RN & SAF technology
Outotec
Environmental, social and port environmental studies
Completion of studies and documentation to comply with Equator Principle standards
Hatfield or other specialists.
Co-generation and water treatment
To calculate Opex and Capex of +/- 20% (will require some basic engineering for tendering)
To be decided Logistics
(land)
To calculate Opex and Capex for hauling
raw material via truck and/or train PT. LAPI-ITB JORC resource
upgrade 2012
Update JORC resource compliant reserves and resources from 2004 standard to 2012
PT. GMT
Finance Review
At 30 June 2015, the Consolidated Entity held cash, cash equivalents and term deposits of $12,227,558. Operating activities consumed $3,110,287, including interest received of $342,293 and a R&D Tax Incentive Rebate of $1,266,608 for eligible expenditure in the 2014 financial year spent on advancing the Kulon Progo project.
Investing activities consumed $396,311, which included expenditure on capitalised exploration and evaluation of $4,523,357 and property, plant and equipment assets of $3,832,085. The Company sold its portfolio of US$ denominated fixed income securities, resulting in $13,182,731 being received. At the same time the Company took out two US$ denominated term deposits, one for US$2,000,000 with a one month term and one for US$4,000,000 with a three month term.
30 JUNE 2015
Page 14 CORPORATE GOVERNANCE STATEMENT
The Board is committed to maintaining the highest standards of Corporate Governance. Corporate Governance is about having a set of core values and behaviours that underpin the Company's activities and ensure transparency, fair dealing and protection of the interests of stakeholders. The Company has reviewed its corporate governance practices against the Corporate Governance Principles and Recommendations (3rd edition) published by the ASX Corporate Governance Council.
The 2015 Corporate Governance Statement is dated as at 30 September 2015 and reflects the corporate governance practices throughout the 2015 financial year. The 2015 Corporate Governance Statement was approved by the Board on 30 September 2015. A description of the Company’s current corporate governance practices is set out in the Company’s Corporate Governance Statement which can be viewed at www.indomines.com.au.
SIGNIFICANT CHANGES IN THE STATE OF AFFAIRS
In the opinion of the directors, significant changes in the state of affairs of the Group that occurred during the year ended 30 June 2015 were as follows:
Near completion of Definitive Feasibility Study Stage I and completion of Pre-Feasibility Study at the Kulon Progo iron sands project.
In June 2015 the Company received an R&D incentive refund of $1,266,608 from the Australian Government, on its eligible expenditure on research and development expenditure incurred during 2014 financial year, on the Company’s Kulon Progo iron sands project.
SIGNIFICANT POST BALANCE DATE EVENTS
In September 2015 the Company signed an Agreement for sale of the Vertimill for US$750,000. The sale is subject to a number of conditions precedent. A 5% refundable deposit (US$37,500) has already been received. In September 2015 the Company announced an updated 2012 JORC compliant resource report for the Kulon Progo iron sands project. A summary of this report can be seen in the Resources and Reserves Statement contained in this report.
Outside of the matters outlined above there has not arisen in the interval between the end of the financial year and the date of this report any item, transaction or event of a material and unusual nature likely, in the opinion of the Directors of the Company, to affect significantly the operations of the Group, the results of those operations, or the state of affairs of the Group, in future financial years.
ENVIRONMENTAL REGULATION AND PERFORMANCE
The Consolidated Entity’s operations are subject to various environmental laws and regulations under the relevant government’s legislation. Full compliance with these laws and regulations is regarded as a minimum standard for all operations to achieve.
Instances of environmental non-compliance by an operation are identified either by external compliance audits or inspections by relevant government authorities.
During the year the Company’s subsidiary PT JMI has been upgrading the current AMDAL report (Indonesian environmental study) to Equator Principle Standard environmental and social analysis. Currently PT JMI is completing a GAP analysis on the current studies it has already completed to date.
There have been no significant known breaches by the Consolidated Entity during the financial year. LIKELY DEVELOPMENTS AND EXPECTED RESULTS
During the coming year, the Company will complete the Definitive Feasibility Study Phase I for its pig iron before proceeding with a bankable feasibility study for an iron making facility for the production of pig iron and vanadium by product.
30 JUNE 2015
Page 15 SHARE OPTIONS
During the year ended 30 June 2015 1,500,000 vendor options exercisable at $0.20 each on or before 1 October 2014 expired unexercised. As at 30 June 2015 there are no further options over unissued ordinary shares on issue and no options have been granted since the end of the year.
The following table sets out each Director’s relevant interest in shares and options in the Company as at the date of this report: Ordinary Shares Directors Peter Chambers - Christopher Catlow(1) 5,702,861 Darryl Harris 210,000 Darjoto Setyawan - Hendra Surya - Stacey Apostolou(1) 5,000 Notes (1)
Number held at the date of resignation as a Director. REMUNERATION REPORT (AUDITED)
The remuneration policy for the Group’s Key Management Personnel (including the Chief Executive Officer) has been developed by the Board taking into account:
the size of the Group;
the size of the management team for the Group;
the nature of the Group’s current operations; and
market conditions and comparable salary levels for companies of a similar size and operating in similar sectors.
In considering the above general factors, the Board has also placed emphasis on the following specific issues:
risks associated with resource companies whilst exploring and developing projects; and
other than income which may be generated from asset sales (if any), the Group does not expect to be undertaking significant profitable operations until sometime after the successful commercialisation, production and sales of commodities from its Kulon Progo iron sands project, or the acquisition of a large scale profitable mining operation.
Remuneration Policy for Executives
The Group’s remuneration policy is to provide a fixed remuneration component and a performance based component (incentive options, see below). The Board believes that this remuneration policy is appropriate given the stage of development of the Group and the activities which it undertakes and is appropriate in aligning Key Management Personnel objectives with shareholder and business objectives.
Performance Based Remuneration – Incentive Options
The Board has, in prior years, chosen to issue incentive options to Key Management Personnel as a key component of the incentive portion of their remuneration, in order to attract and retain the services of the Key Management Personnel and to provide an incentive linked to the performance of the Group. The Board considers that each Key Management Personnel’s experience in the resources industry will greatly assist the Group in progressing its projects to the next stage of development and the identification of new projects. As such, the Board believes that the number of incentive options granted to Key Management Personnel is commensurate to their value to the Group.
Whilst no incentive options were granted during the current financial year, the Board’s policy has been to grant options to Key Management Personnel with exercise prices at and/or above market share price (at time of agreement). As such, incentive options granted to Key Management Personnel will generally only be of benefit if the Key Management Personnel perform to the level whereby the value of the Group increases sufficiently to warrant exercising the incentive options granted.
Other than market-based vesting conditions, there have been no additional performance criteria on the incentive options granted to Key Management Personnel historically, as given the speculative nature of the Group’s activities and the small management team responsible for its running, it is considered the performance of the Key Management Personnel and the performance and value of the Group are closely related.
30 JUNE 2015
Page 16 REMUNERATION REPORT (AUDITED) (continued)
Key Management Personnel are prohibited at all times from entering into margin lending or similar arrangements in respect to securities in the Company they hold or in which they have a relevant interest.
Key Management Personnel are prohibited at all times from dealing in financial products issued or created over or in respect of the Company’s Securities.
Impact of Shareholder Wealth on Key Management Personnel Remuneration
The Board does not directly base remuneration levels on the Group’s share price or movement in the share price over the financial year. The Company does not expect to be undertaking significant profitable operations until sometime after the successful commercialisation, production and sales of commodities from its Kulon Progo iron sands project, or the acquisition of a large scale profitable mining operation. Accordingly the Board does not consider current or prior year earnings or share price movements when assessing remuneration of Key Management Personnel. The compensation structures take into account the capability and experience of the key management personnel and their ability to assist Company performance.
As a result of the Group’s exploration and development activities, the Board anticipates that it will retain future earnings (if any) and other cash resources for the operation and development of its business. Accordingly the Group does not currently have a policy with respect to the payment of dividends, and as a result the remuneration policy does not take into account the level of dividends or other distributions to shareholders (e.g. return of capital).
Impact of Earnings on Key Management Personnel Remuneration
The Company does not expect to be undertaking significant profitable operations until sometime after the successful commercialisation, production and sales of commodities from its Kulon Progo iron sands project, or the acquisition of a large scale profitable mining operation. Accordingly the Board does not consider current or prior year earnings or share price movements when assessing remuneration of Key Management Personnel. The compensation structures take into account the capability and experience of the key management personnel and their ability to assist Company performance.
Fixed Compensation
Fixed compensation consists of base compensation (which is calculated on a total cost basis and includes any FBT charges related to employee benefits including motor vehicles), as well as employer contributions to superannuation funds.
Compensation levels are generally reviewed annually by the Board through a process that considers individual, segment and overall performance of the Group. In addition, where necessary, external consultants provide analysis and advice to ensure the Directors’ and senior executives’ compensation is competitive in the market place. A senior executive’s compensation is also reviewed on promotion. No external consultants were engaged during the year ended 30 June 2015.
Remuneration Policy for Non-Executive Directors
The Board policy is to remunerate Non-Executive Directors at market rates for comparable companies for time, commitment and responsibilities. Given the current size, nature and risks of the Group, incentive options have previously been used to attract and retain Executive Directors. The Board determines payments to the Non-Executive Directors and reviews their remuneration annually, based on market practice, duties and accountability. Independent external advice is sought when required. No external consultants were engaged during the year ended 30 June 2015.
The maximum aggregate amount of fees that can be paid to Non-Executive Directors is subject to approval by shareholders at a General Meeting. Fees for Non-Executive Directors are not linked to the performance of the Group.
General
Where required, Key Management Personnel receive superannuation contributions, which for the year ended 30 June 2015 was equal to 9.5% of salary. Key Management Personnel do not receive any other retirement benefit. From time to time, individuals have chosen to sacrifice part of their salary to increase payments towards superannuation.
30 JUNE 2015
Page 17 REMUNERATION REPORT (AUDITED) (continued)
All remuneration paid to Key Management Personnel is valued at cost to the Company and expensed. Incentive options are valued using an appropriate option valuation methodology depending upon the terms of the options. The value of these incentive options is expensed over the vesting period.
Employment Contracts with Key Management Personnel
Ms Stacey Apostolou, who resigned on 30 September 2014 as a Director of the Company and on 31 October 2014 as Company Secretary and Chief Financial Officer of the Group, entered into a fixed term contract with effect from 1 March 2013 which initially expired on 31 December 2013, but was extended by mutual agreement until 31 December 2014. Prior to Ms Apostolou’s appointment as a Director, she received a fixed remuneration component of $20,000 per month inclusive of superannuation. Subsequent to her appointment, this was increased to $23,333 per month (inclusive of superannuation).
Mr Arran Marshall, Chief Executive Officer, entered into an executive services agreement with the Company with effect from 25 February 2014. Pursuant to that agreement, Mr Marshall is paid a base salary of A$275,000 per annum, a housing allowance of US$3,000 per month and a motor vehicle allowance of IDR12.5 million per month. In addition, Mr Marshall may be entitled to receive a bonus of up to A$370,000 subject to him achieving certain performance based milestones during the period to 31 December 2015. The Company may terminate Mr Marshall’s employment at any time upon three months' notice, where that termination is effected within twelve months of his commencement, and upon 6 months’ notice, where the termination is effected following the expiration of twelve months from commencement. In lieu of notice, the Company may pay Mr Marshall an amount calculated in proportion to his base salary for any period of short notice. Mr Marshall can resign by providing three months’ written notice. The Company can terminate the agreement without notice for serious misconduct.
Non-Executive directors
Total compensation for all Non-Executive Directors, last voted upon by shareholders at the 2011 AGM, is not to exceed $500,000 per annum and is set with reference to fees paid to other non-executive directors of comparable companies. With effect from 1 December 2012, fees payable for the independent Non-Executive Directors are $50,000 per annum inclusive of superannuation contributions. Directors appointed by the Rajawali Group do not receive any Directors’ fees. Mr Surya was paid $17,324 during the year as remuneration for his role as CEO of PT JMI. Mr Chambers retired from his executive role with the Rajawali Group on 30 June 2014. With effect from 1 July 2014, Mr Chambers receives a fee in his capacity as Chairman of $78,000 per annum inclusive of superannuation contributions.
Non-Executive Directors did not receive any performance related compensation in 2015 (2014: Nil). Directors’ fees cover all main board activities and committee memberships.
30 JUNE 2015
Page 18 REMUNERATION REPORT (AUDITED) (continued)
Key Management Personnel Remuneration (Company and Consolidated)
Details of the nature and amount of each element of the remuneration of each Director of the Group and each of the Group’s executives for the financial year are as follows:
Short-Term Post Employment Other long term $ Termination Benefits $ Share- based payments Total Proportion of remuneration performance related Value of options as proportion of remuneration Directors Salary & Fees $ STI cash bonus $ Non monetary benefits $ Total $ Super- annuation $ Options and rights $ $ % % Peter Chambers 2015 78,800 - - 78,800 - - - - 78,800 - - Non-Executive Chairman 2014 - - - - Martin Hacon 2015 - - - - - - - - - - -
Managing Director & CEO 2014 347,355(2) - - 347,355 - - - - 347,355 - -
Christopher Catlow (3) 2015 11,415 - - 11,415 1,084 - - - 12,499 - - Non-Executive Director 2014 45,793 - - 45,793 4,207 - - - 50,000 - - Darryl Harris 2015 45,820 - - 45,820 5,325 - - - 51,145 - - Non-Executive Director 2014 45,793 - - 45,793 4,207 - - - 50,000 - - Darjoto Setyawan (1) 2015 - - - - - - - - - - - Non-Executive Director 2014 - - - - Hendra Surya (1) 2015 17,324 - - 17,324 - - - - 17,324 - - Non-Executive Director 2014 - - - - Stacey Apostolou (4) 2015 95,425 - - 95,425 5,490 - - - 100,915 - -
Exec Director & Co. Sec. 2014 236,863 - - 236,863 16,470 - - - 253,333 - -
Executives
Arran Marshall (5) 2015 326,449 - - 326,449 - - - - 326,449 - -
Chief Executive Officer 2014 114,338 - - 114,338 - - - - 114,338 - -
Satya Graha (6) 2015 - - - - - - - - - - -
Operations Director - JMI 2014 407,133 - - 407,133 2,572 - - - 409,705 - -
Total 2015 575,233 - - 575,233 11,899 - - - 587,132 - -
30 JUNE 2015
Page 19 REMUNERATION REPORT (AUDITED) (continued)
Notes
(1) No Directors Fees were payable to Messrs Setyawan and Surya for the year ended 30 June 2015. Remuneration paid for Mr Surya for his role as CEO of PT JMI during the year totalled $17,324.
(2) Includes the payment of $84,855 in annual leave paid out on termination. (3) Mr Catlow resigned as a Director on 30 September 2014
(4) Ms Apostolou resigned as a Director on 30 September 2014 and as Company Secretary on 31 October 2014. (5) Mr Marshall commenced employment on 25 February 2014.
(6) Mr Graha remains an employee of JMI but due to a change in role and responsibilities is no longer classified as key management personnel.
Options Granted to Key Management Personnel
No options were granted, exercised or lapsed during the year. End of Remuneration Report
INSURANCE OF OFFICERS AND AUDITORS
Under the Constitution the Company is obliged, to the extent permitted by law, to indemnify an officer (including Directors) of the Company against liabilities incurred by the officer in that capacity, against costs and expenses incurred by the officer in successfully defending civil or criminal proceedings, and against any liability which arises out of conduct not involving a lack of good faith.
The Company has in respect of any person who is or has been an officer of the Company or a related body corporate paid or agreed to pay a premium of $18,901 (2014: $18,051) in respect of a contract insuring against a liability incurred as an officer for the costs or expenses to defend legal proceedings.
The Company has indemnified officers of the Company against a liability incurred as an officer including costs and expenses in successfully defending legal proceedings.
The Company has not, during or since the end of the financial year, indemnified or agreed to indemnify an auditor of the Company or of any related body corporate against a liability incurred as such an auditor.
NON-AUDIT SERVICES
There were no non-audit services provided by the auditor (or by another person or firm on the auditor’s behalf) during the financial year.
AUDITOR’S INDEPENDENCE DECLARATION
The auditor’s independence declaration, which forms part of this Directors’ Report, for the year ended 30 June 2015 is on page 20.
This report is made in accordance with a resolution of the Directors made pursuant to section 298(2) of the Corporations Act 2001.
For and on behalf of the Directors
PETER CHAMBERS Non-Executive Chairman
Page 21
CONSOLIDATED STATEMENT OF PROFIT OR LOSS AND OTHER COMPREHENSIVE INCOME FOR THE YEAR ENDED 30 JUNE 2015
Note 2015 2014
$ $
Other income 3(b) 3,778,043 183,334
General and administrative project expenditure 3(a) (2,761,881) (10,207,521)
Depreciation 3(a) (77,423) (321,612)
Employee benefits expenses 3(a) (574,250) (913,220)
Other expenses 3(a) (1,021,314) (1,435,938)
Loss on disposal of subsidiary 3(d) (361,872) -
Financial income 3(b) 170,146 610,924
Financial costs 3(b) (1,202,007) (671,139)
Write-down of inventory to net realisable value 3(c) (1,091,686) -
Impairment expenses 3(c) - (44,005,991)
Loss before income tax (3,142,244) (56,761,163)
Income tax expense 4 - -
Loss for the year (3,142,244) (56,761,163)
Other comprehensive income/(loss)
Items that may be reclassified subsequently to profit or loss
Re-measurement of defined benefit obligations (31,971) (53,433)
Exchange differences on disposed entity 348,199 -
Foreign currency translation differences for foreign
operations 442,130 (94,461)
Other comprehensive income/(loss) for the year 758,358 (147,894)
Total comprehensive loss for the year (2,383,886) (56,909,057)
Loss attributable to:
Non-controlling interests (1,182,371) (7,828,990)
Owners of the Company (1,959,873) (48,932,173)
(3,142,244) (56,761,163)
Total comprehensive loss attributable to:
Non-controlling interests (984,957) (7,978,912)
Owners of the Company (1,398,929) (48,930,145)
(2,383,886) (56,909,057) Earnings/(loss) per share:
Basic earnings and diluted earnings/(loss) per share (cents) 25 (0.36) (9.1)
Notes to and forming part of the Statement of Profit or Loss and Other Comprehensive Income are set out on Pages 25 to 54.
Page 22
CONSOLIDATED STATEMENT OF FINANCIAL POSITION AS AT 30 JUNE 2015
Note 2015 2014
ASSETS $ $
Current Assets
Cash and cash equivalents 26(b) 6,943,958 10,160,428
Term deposits 26(b) 5,283,600 60,000
Trade and other receivables 5 58,465 181,400
Financial assets at fair value through profit or loss 6 - 10,792,805
Total Current Assets 12,286,023 21,194,633
Non-Current Assets
Restricted cash and cash equivalents 26(b) 42,926 51,952
Other receivables 5 137,108 -
Inventory 7 312,173 1,318,673
Property, plant and equipment 8 3,448,878 439,795
Exploration and evaluation assets 9 4,692,253 -
Total Non-Current Assets 8,633,338 1,810,420
TOTAL ASSETS 20,919,361 23,005,053
LIABILITIES Current Liabilities
Trade and other payables 10 1,402,543 2,077,611
Employee benefits 11 - 31,639
Total Current Liabilities 1,402,543 2,109,250
Non-Current Liabilities
Trade and other payables 12 53,912 49,234
Employee benefits 13 394,361 317,923
Borrowings 14a 5,223,600 4,240,433
Derivative financial instruments 14b 21,946 81,328
Total Non-Current Liabilities 5,693,819 4,688,918
TOTAL LIABILITIES 7,096,362 6,798,168 NET ASSETS 13,822,999 16,206,885 EQUITY Issued capital 15 140,998,541 143,998,541 Reserves 16 242,374 44,430 Accumulated losses 17 (111,485,831) (112,888,958)
Total equity attributable to equity holders of the
Company 29,755,084 31,154,013
Non-controlling interest 18 (15,932,085) (14,947,128)
TOTAL EQUITY 13,822,999 16,206,885
Page 23
CONSOLIDATED STATEMENT OF CASH FLOWS FOR THE YEAR ENDED 30 JUNE 2015
Note 2015 2014
$ $
Cash flows from operating activities
Research and development refund 1,266,608 -
Payments to suppliers and employees (inclusive of GST) (4,426,936) (14,132,884)
Interest received 342,293 751,887
Interest paid (292,252) (346,243)
Net cash outflows from operating activities 26(a) (3,110,287) (13,727,240)
Cash flows from investing activities
Purchase of property, plant and equipment (3,832,085) (1,492,337) Payments for exploration and evaluation (4,523,357) (7,355,595)
Proceeds from sale of property, plant and equipment - 967
Receipts/(payments) for term deposits (5,223,600) 39,300,000
Acquisition of interest in tenement - (49,791)
Receipts/(payments) for fixed income securities 13,182,731 (11,172,205)
Net cash inflows/(outflows) from investing activities (396,311) 19,231,039
Net increase/(decrease) in cash and cash equivalents (3,506,598) 5,503,799
Cash and cash equivalents at the beginning of the financial year 10,160,428 4,416,151
Effects of exchange rate changes 290,128 240,478
Cash and cash equivalents at the end of the financial year 26(b) 6,943,958 10,160,428
Notes to and forming part of the Statement of Cash Flows are set out on Pages 25 to 54 .
Page 24
CONSOLIDATED STATEMENTS OF CHANGES IN EQUITY FOR THE YEAR ENDED 30 JUNE 2015
Notes to and forming part of the Statements of Changes in Equity are set out on Pages 25 to 54. Attributable to the equity holders of the Parent
Share Capital Performance Shares Share-Based Payments Reserve Other Reserves Foreign Currency Translation Reserve Accumulated Losses Total Non-controlling Interest Total Equity $ $ $ $ $ $ $ $ $ Balance at 1 July 2014 140,998,541 3,000,000 363,000 (34,621) (283,949) (112,888,958) 31,154,013 (14,947,128) 16,206,885
Net loss for the year - - - (1,959,873) (1,959,873) (1,182,371) (3,142,244)
Other comprehensive income Re-measurement of defined
benefit obligation - - - (31,971) - - (31,971) - (31,971)
Exchange difference on
disposed entity - - - - 348,199 - 348,199 - 348,199
Exchange differences arising on
translation of foreign operations - - - - 244,716 - 244,716 197,414 442,130
Total other comprehensive
income - - - (31,971) 592,915 (1,959,873) (1,398,929) (984,957) (2,383,886)
Transactions with owners, recorded directly in equity
Expiry of performance shares - (3,000,000) - - - 3,000,000 - - -
Expiry of options - - (363,000) - - 363,000 - - -
Page 25
CONSOLIDATED STATEMENTS OF CHANGES IN EQUITY (continued) FOR THE YEAR ENDED 30 JUNE 2015
Notes to and forming part of the Statements of Changes in Equity are set out on Pages 25 to 54. Attributable to the equity holders of the Parent
Share Capital Performance Shares Share-Based Payments Reserve Other Reserves Foreign Currency Translation Reserve Accumulated Losses Total Non-controlling Interest Total Equity $ $ $ $ $ $ $ $ $ Balance at 1 July 2013 140,998,541 3,000,000 363,000 18,812 (339,410) (63,956,785) 80,084,158 (6,968,216) 73,115,942
Net loss for the year - - - (48,932,173) (48,932,173) (7,828,990) (56,761,163)
Other comprehensive income Re-measurement of defined
benefit obligation - - - (53,433) - - (53,433) - (53,433)
Exchange differences arising on
translation of foreign operations - - - - 55,461 - 55,461 (149,922) (94,461)
Total other comprehensive
income - - - (53,433) 55,461 - 2,028 (149,922) (147,894)
Total comprehensive
profit/(loss) for the year - - - (53,433) 55,461 (48,932,173) (48,930,145) (7,978,912) (56,909,057)
Page 26 1. STATEMENT OF SIGNIFICANT ACCOUNTING POLICIES
The principal accounting policies adopted in preparing the financial report of the Company, Indo Mines Limited and its consolidated entities (“Consolidated Entity” or “Group”) for the year ended 30 June 2015 are stated to assist in a general understanding of the financial report. These policies have been consistently applied to all the years presented, except as described below.
Indo Mines is domiciled in Australia and is a for-profit entity, limited by shares and these shares are publicly traded on the Australian Securities Exchange.
The financial report of the Group for the year ended 30 June 2015 was authorised for issue in accordance with a resolution of the Directors on 30 September 2015.
(a) Going Concern
The Group incurred a loss for the year of $3,142,244 (2014: $56,761,163) whilst it continued with studies for the development of the Kulon Progo iron sands project.
The financial report has been prepared on a going concern basis which contemplates the continuation of business activity and the realisation of assets and settlement of liabilities in the ordinary course of business.
(b) Basis of Preparation
Statement of compliance
The financial report is a general purpose financial report which has been prepared in accordance with Australian Accounting Standards (AASs) adopted by the Australian Accounting Standards Board (AASB) and the Corporations Act 2001. The consolidated financial report of the Group complies with International Financial Reporting Standards (IFRSs) adopted by the International Accounting Standards Board (IASB).
Basis of measurement
The consolidated financial statements have been prepared on the historical cost basis, as modified by the revaluation of financial assets and liabilities (including derivative instruments) at fair value through profit or loss. New or revised accounting standards and interpretations
A number of new standards, amendments to standards and interpretations are effective for annual periods beginning after 1 July 2014, and have been applied in preparing these financial statements. Those which may be relevant to the Group are set out below.
Certain new or revised accounting standards and interpretations became effective for the annual reporting period commencing 1 July 2014. The Group assesses that these recently issued or revised standards and interpretations will not have a significant impact on the group’s financial statements.
Page 27
1. STATEMENT OF SIGNIFICANT ACCOUNTING POLICIES (continued)
(c) Principles of Consolidation
The consolidated financial statements incorporate the assets and liabilities of all subsidiaries of Indo Mines Limited as at 30 June 2015 and the results of all subsidiaries for the year then ended. Indo Mines and its subsidiaries together are referred to as the Group or the Consolidated Entity.
Subsidiaries are all those entities (including special purpose entities) over which the Group has the power to govern the financial and operating policies, generally accompanying a shareholding of more than one-half of the voting rights. The existence and potential effect of potential voting rights that are currently exercisable or convertible are considered when assessing whether the Group controls another entity. The Group controls an entity when it is exposed to, or has rights to, variable returns through it power over the entity.
Subsidiaries are fully consolidated from the date on which control is transferred to the Group. They are de-consolidated from the date that control ceases.
Intercompany transactions and balances, and unrealised gains on transactions between Group companies, are eliminated. Unrealised losses are also eliminated unless the transaction provides evidence of the impairment of the asset transferred. Accounting policies of subsidiaries have been changed where necessary to ensure consistency with the policies adopted by the Group.
Non-controlling interest
The Group measures any non-controlling interest at its proportionate interest in the identifiable net assets of the subsidiary.
(d) Exploration and evaluation expenditure
Exploration and evaluation expenditure encompasses expenditures incurred by the Group in connection with the exploration for and evaluation of mineral resources before the technical feasibility and commercial viability of extracting a mineral resource are demonstrable.
Exploration and evaluation expenditure incurred by the Group is accumulated for each area of interest and recorded as an asset if:
(i) the rights to tenure of the area of interest are current; and (ii) at least one of the following conditions is also met:
(1) the exploration and evaluation expenditures are expected to be recouped through successful development and exploitation of the area of interest, or alternatively, by its sale; and/or
(2) exploration and evaluation activities in the area of interest have not at the reporting date reached a stage which permits a reasonable assessment of the existence or otherwise of economically recoverable reserves, and active and significant operations in, or in relation to, the area of interest are continuing. For each area of interest, expenditure incurred in the acquisition of rights to explore is capitalised and recognised as an exploration and evaluation asset. Exploration and evaluation assets are measured at cost on recognition. Capitalised exploration costs are reviewed each reporting date to establish whether an indication of impairment exists. If any such indication exists, the recoverable amount of the capitalised exploration costs is estimated to determine the extent of the impairment loss (if any).
Where a decision is made to proceed with development, accumulated expenditure is tested for impairment and transferred to development properties, and then amortised over the life of the reserves associated with the area of interest once mining operations have commenced.
Recoverability of the carrying amount of the exploration and evaluation assets is dependent on successful development and commercial exploitation, or alternatively, sale of the respective areas of interest.