POWER SYSTEM NETWORK SPLITTING AND
LOAD FREQUENCY CONTROL OPTIMIZATION
USING ABC BASED ALGORITHMS
KANENDRA NAIDU A/L VIJYAKUMAR
THESIS SUBMITTED IN FULFILMENT OF THE
REQUIREMENTS FOR THE DEGREE OF
DOCTOR OF PHILOSOPHY
FACULTY OF ENGINEERING
UNIVERSITY OF MALAYA
KUALA LUMPUR
ii
UNIVERSITY OF MALAYA
ORIGINAL LITERARY WORK DECLARATION
Name of Candidate: Kanendra Naidu A/L Vijyakumar (I.C No: 841129-14-5857) Registration/Matric No: KHA 110103
Name of Degree: Doctor Of Philosophy
Title of Thesis (―this Work‖): POWER SYSTEM NETWORK SPLITTING AND LOAD FREQUENCY CONTROL OPTIMIZATION USING ABC BASED ALGORITHMS
Field of Study: Power System
I do solemnly and sincerely declare that: (1) I am the sole author/writer of this Work; (2) This Work is original;
(3) Any use of any work in which copyright exists was done by way of fair dealing and for permitted purposes and any excerpt or extract from, or reference to or reproduction of any copyright work has been disclosed expressly and sufficiently and the title of the Work and its authorship have been acknowledged in this Work;
(4) I do not have any actual knowledge nor do I ought reasonably to know that the making of this work constitutes an infringement of any copyright work; (5) I hereby assign all and every rights in the copyright to this Work to the
University of Malaya (―UM‖), who henceforth shall be owner of the copyright in this Work and that any reproduction or use in any form or by any means whatsoever is prohibited without the written consent of UM having been first had and obtained;
(6) I am fully aware that if in the course of making this Work I have infringed any copyright whether intentionally or otherwise, I may be subject to legal action or any other action as may be determined by UM.
Candidate‘s Signature Date:
Subscribed and solemnly declared before,
Witness‘s Signature Date:
Name: Designation:
iii
ABSTRACT
Blackout is the worst case scenario that could occur in the power system network. The cascading failure from one part of the system can propagate throughout the network and cause total system blackout. In order to mitigate the effect of blackout which causes the system to split into infeasible islands, the intentional islanding method is considered. It is applied to split the system into operational smaller island of network until system restoration is carried out. With regards to this, an optimization technique is required to identify the optimum system splitting solution and at the same time ensure the post- islanding frequency stability in the system. This research presents a modified optimization program for the system splitting problem in large scale power system based on Artificial Bee Colony algorithm and graph theory. The post-islanding frequency stability is maintained by optimizing the Load Frequency Control‘s parameters. The graph theory is used to represent the power system based on interconnection between the buses through the adjacency matrix. The edge reduction algorithm is initially applied to reduce the search space to obtain the initial solution. Subsequently, the modified optimization is implemented in order to find the optimum system splitting solution which ensures minimal power flow disruption. The power balance is checked and transmission line power flow analysis is carried out in each island to ensure stability is maintained. In the event the power balance criteria are violated, load shedding scheme is further applied to meet generation-load equilibrium. In the post-islanding phase, the load frequency control for each islanded area is optimally tuned using multi objective ABC optimization technique to maintain nominal system frequency at all times. The online wavelet filter is further implemented to filter out the noise in the LFC model. The IEEE 30-bus, 39-bus and 118-bus test system are chosen to validate the proposed method in MATLAB.
iv
ABSTRAK
Salah satu senario buruk yang boleh berlaku dalam sistem kuasa adalah putus bekalan. Kegagalan melata dari satu bahagian sistem boleh tersebar ke seluruh rangkaian dan menyebabkan putus bekalan secara menyeluruh. Untuk mengurangkan kesan putus bekalan yang menyebabkan rangkaian berpisah kepada sistem terpulau tak tersaur, kaedah sistem pemulauan terancang dipertimbangkan. Kaedah ini digunakan untuk memisahkan rangkaian kuasa kepada sistem terpulau tersaur yang masih berfungsi. Oleh yang demikian, satu kaeadah pengoptimuman diperlukan untuk mengenalpasti sistem terpulau yang optimum dan dalam masa yang sama, memastikan agar kestabilan dan operasi pasca sistem pemualaun dijamin. Kajian ini membentangkan atur cara pengoptimuman diskret untuk masalah sistem terpulau dalam sistem kuasa skala besar berpandukan algoritma ‗Artificial Bee Colony‘ dan ‗graph theory‘. Kestabilan pasca sistem terpulau dijamin dengan mengoptimasi parameter pengawal frekuensi beban. ‗Graph theory‘ digunakan untuk mewakili saling hubungan antara bas melalui matriks bersebelahan. Algoritma ‗edge reduction‘ digunakan untuk mengurangkan ruang gelintaran untuk memperolehi penyelesaian awal. Atur cara pengoptimuman diskret dilaksanakan untuk mencari penyelesaian optimum berpandukan gangguan aliran kuasa minima. Keseimbangan kuasa dipantau dan analisis talian penghantaran aliran kuasa dijalankan di setiap pulau bagi memastikan kestabilan dikekalkan. Sekiranya kriteria keseimbangan kuasa dilanggar, skim penanggalan beban akan diaplikasikan. Dalam fasa operasi pasca pemulauan, parameter optimum pengawal frekuensi beban untuk setiap sistem terpulau ditala menggunakan atur cara ‗ABC‘ multiobjektif untuk mengekalkan frekuensi sistem nominal. Penapis ‗wavelet‘ dugunakan untuk menapis hingar dalam model LFC. Sistem ujian IEEE 30, 39 dan 118 bas dipilih untuk mengesahkan kaedah yang dicadangkan dalam MATLAB.
v
ACKNOWLEDGEMENTS
First and foremost, I would like to kindly express my sincere thanks and deepest gratitude to my supervisors, Associate Professor Dr. Hazlie Bin Mokhlis and Dr. Ab Halim Bin Abu Bakar for all the help and guidance provided. Their advice, enthusiasm and motivation in assisting me to successfully complete this project is wholeheartedly appreciated.
I would like to sincerely thank my co-supervisor, Professor Vladimir Terzija for his advice and feedback in completing my PhD work. I would like to also thank Universiti Malaya for providing academic support and encouragement and also the necessary facility in ensuring a conducive atmosphere in order to accomplish my project.
I would like to take this opportunity to thank all my friends in the power group laboratory for all their assistance. I would also like to extend my gratitude and sincere thanks to my parents, my brother and sister who played an instrumental role in helping me by providing their full support and encouragement.
Last but not least, my heartfelt gratitude and appreciation to all of you and others who has contributed towards the successful completion of this project.
vi TABLE OF CONTENTS Abstract ... iii Abstrak ... iv Acknowledgements ... v Table of Contents ... vi
List of Figures ... xii
List of Tables ... xix
List of Symbols and Abbreviations ... xxiii
List of Appendices ... xxiv
CHAPTER 1: INTRODUCTION ... 1
1.1 Introduction ... 1
1.2 Problem Statement ... 5
1.3 Research Objectives ... 6
1.4 Methodology and Scope of Research ... 7
1.5 Thesis Outline ... 10
CHAPTER 2: AN OVERVIEW OF NETWORK SPLITTING, GRAPH THEORY AND LOAD FREQUENCY CONTROL ... 13
2.1 Power System Overview ... 13
2.2 Power System Security ... 14
2.3 Failures in Power System ... 17
2.4 Blackout ... 20
2.4.1 Blackout Summary ... 24
2.4.2 Blackout Mitigation ... 25
vii
2.5 NETWORK SPLITTING TECHNIQUES ... 33
2.5.1 Binary Decision Diagram (BDD) ... 34
2.5.2 Clustering technique... 35
2.5.3 Two time-scale theory ... 36
2.5.4 Heuristic Technique ... 38
2.5.5 Piecewise Linear AC Power Flow and Mixed Integer Linear Programming ... 39
2.5.6 Network splitting Techniques summary ... 40
2.6 Graph Theory ... 41
2.6.1 Graph model approach ... 43
2.6.2 Minimal cutset ... 43
2.6.3 Graph-cut approach ... 43
2.6.4 Graph theory summary ... 44
2.7 Post-islanding Frequency Stability - Load Frequency Control ... 44
2.7.1 Classical methods ... 47
2.7.2 Adaptive and variable structure methods ... 49
2.7.3.Robust approach ... 51 2.7.4 Digital approaches ... 53 2.7.5 Intelligent approaches ... 55 2.7.5.1 Neural network ... 55 2.7.5.2 Fuzzy logic ... 57 2.7.5.3 Genetic algorithm ... 58
2.7.5.4 Swarm based optimization ... 59
2.7.6LFC design methodology summary ... 60
2.8 Discussion ... 61
viii
CHAPTER 3: PROPOSED OPTIMUM NETWORK SPLITTING ALGORITHM
AND LOAD FREQUENCY CONTROL OPTIMIZATION ... 66
3.1 Introduction ... 66
3.2 Optimum Network Splitting Algorithm ... 66
3.2.1 Task 1: Modeling of Large Scale Power System ... 66
3.2.2 Task 2: Initial Solution Algorithm ... 69
3.2.2.1 Edge reduction algorithm ... 70
3.2.2.2 Random line configuration ... 75
3.2.2.3 Generator coherency path elimination ... 76
3.2.3Task 3: Modified ABC optimization based on discrete values ... 77
3.2.3.1 Artificial Bee Colony (ABC) algorithm ... 77
3.2.3.2 Constraints ... 77
3.2.3.3 Input parameter ... 78
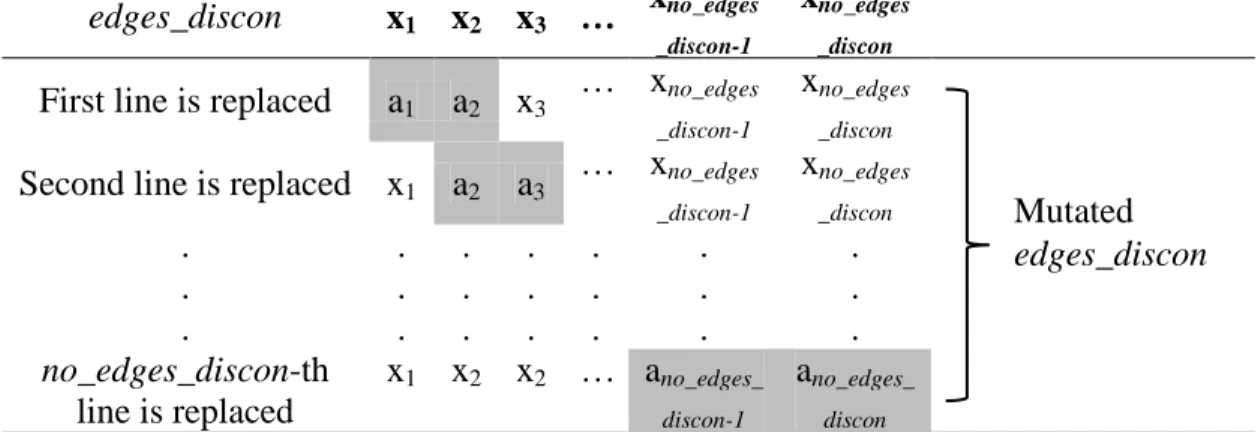
3.2.3.4 Mutation ... 79
3.2.3.5 Objective Function ... 84
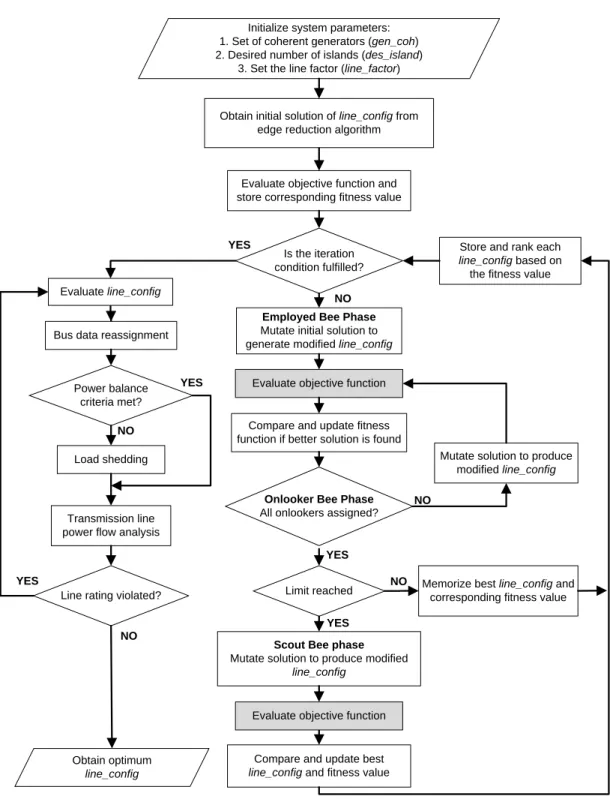
3.2.3.6 Modified ABC optimization flowchart ... 85
3.2.3.7 Modified PSO flowchart ... 90
3.2.3.8 Load Shedding Algorithm ... 91
3.3 Post-Islanding Frequency Stability ... 93
3.3.1 Multi objective optimization approach ... 95
3.3.2 Objective function ... 97
3.3.3 Weightage value selection and performance index ... 98
3.3.4 Multi objective optimization technique ... 98
3.3.4.1 Multi objective ABC optimization technique ... 99
3.3.4.2 Multi objective PSO technique ... 102
ix
3.3.5.1 Wavelet filter implementation ... 106
3.3.5.2 Signal integrity index ... 106
3.4 Summary ... 108
CHAPTER 4: VALIDATION OF PROPOSED OPTIMUM NETWORK SPLITTING ALGORITHM ... 110
4.1 Introduction ... 110
4.2 Test System ... 110
4.3 Verification of Edge Reduction Algorithm ... 114
4.4 Case 1: IEEE 30-Bus Test System (Coherency set 1) ... 116
4.4.1 First Phase: Edge reduction for Case 1 ... 117
4.4.2 Second Phase: Modified ABC optimization for Case 1 ... 118
4.5 Case 2: IEEE 30-Bus Test System (Coherency set 2) ... 122
4.5.1 First Phase: Edge reduction for Case 2 ... 122
4.5.2 Second Phase: Modified ABC optimization for Case 2 ... 123
4.6 Case 3: IEEE 30-Bus Test System (Coherency set 3) ... 126
4.6.1 First Phase: Edge reduction for Case 3 ... 126
4.6.2 Second Phase: Modified ABC optimization for Case 3 ... 128
4.7 Case 4: IEEE 39-Bus Test System (Coherency set 1) ... 132
4.7.1 First Phase: Edge reduction for Case 4 ... 133
4.7.2 Second Phase: Modified ABC optimization for Case 4 ... 134
4.8 Case 5: IEEE 39-Bus Test System (Coherency set 2) ... 137
4.8.1 First Phase: Edge reduction for Case 5 ... 137
4.8.2 Second Phase: Modified ABC optimization for Case 5 ... 138
4.9 Case 6: IEEE 39-Bus Test System (Coherency set 3) ... 142
x
4.9.2 Second Phase: Modified ABC optimization for Case 6 ... 144
4.10 Case 7: IEEE 118-Bus Test System (Coherency set 1) ... 148
4.10.1 First Phase: Edge reduction for Case 7 ... 149
4.10.2 Second Phase: Modified ABC optimization for Case 7 ... 151
4.11 Case 8: IEEE 118-Bus Test System (Coherency set 2) ... 155
4.11.1 First Phase: Edge reduction for Case 8 ... 155
4.11.2 Second Phase: Modified ABC optimization for Case 8 ... 157
4.12 Case 9: IEEE 118-Bus Test System (Coherency set 3) ... 160
4.12.1 First Phase: Edge reduction for Case 9 ... 160
4.12.2 Second Phase: Modified ABC optimization for Case 9 ... 162
4.13 Summary ... 165
CHAPTER 5: VALIDATION OF PROPOSED LOAD FREQUENCY CONTROL OPTIMIZATION ... 167
5.1 Introduction ... 167
5.2 LFC Test System ... 168
5.3 LFC Test Case 1 ... 170
5.3.1 Load variation investigation in Island 1 ... 170
5.3.2 Online wavelet filter implementation in island 1 ... 174
5.3.3 Load variation investigation in Island 2 ... 179
5.3.4 Online wavelet filter implementation in island 2 ... 183
5.4 LFC Test Case 2 ... 188
5.4.1 Load variation investigation in Island 3 ... 189
5.4.2 Online wavelet filter implementation in island 3 for LFC Test Case 2 ... 193
5.5 LFC Test Case 3 ... 198
xi
5.5.2 Online wavelet filter implementation in island 2 for LFC Test Case 3 ... 203
5.6 Summary ... 208
CHAPTER 6: CONCLUSION AND FUTURE WORK ... 210
6.1 Conclusion ... 210
6.2 Future Work ... 213
References ... 215
List of Publications and Papers Presented ... 227
Appendix A ... 228
Appendix B ... 236
xii
LIST OF FIGURES
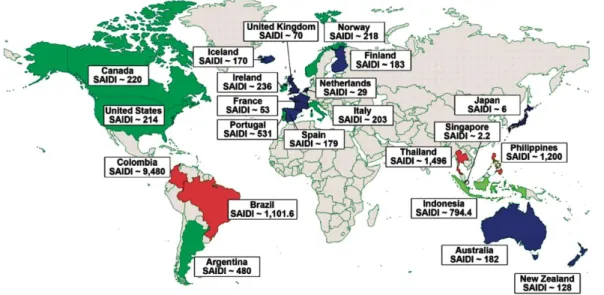
Figure 1.1: SAIDI based on a sample of countries ... 3
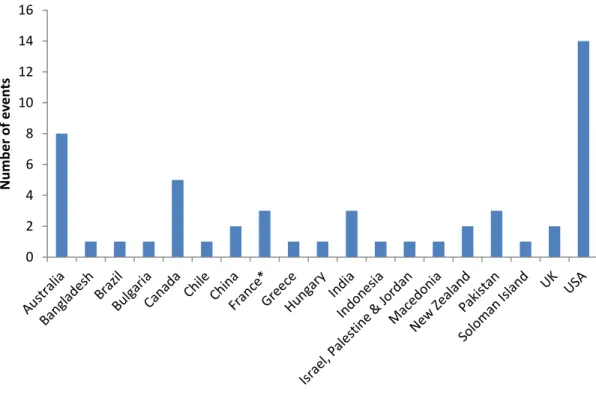
Figure 1.2: Reported cases of power outages during the first quarter of 2013 ... 4
Figure 2.1: Operating States of Power System (Morison et al., 2004) ... 15
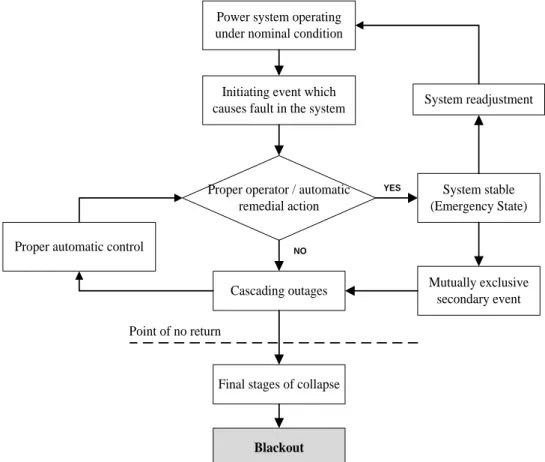
Figure 2.2: General process of events leading to total system blackout ... 19
Figure 2.3: Major power disturbances in North America (NERC, Eaton Blackout Tracker, Goldman Sachs Research estimates) ... 24
Figure 2.4: Flowchart of load shedding process ... 27
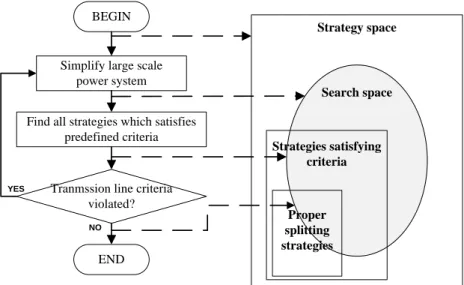
Figure 2.5: Proposed algorithm flowchart ... 28
Figure 2.6: Typical scenario of cascading failure ... 29
Figure 2.7: Splitting strategy for IEEE 30- bus system (Q. Zhao et al., 2003) ... 31
Figure 2.8: Intentional islanding of the IEEE test system ... 32
Figure 2.9: Flowchart of search space reduction process ... 35
Figure 2.10: Graph partitioning based on eigenvectors with respect to vertices. ... 36
Figure 2.11: Typical graph model ... 41
Figure 2.12: Search process in an arbitrary graph model ... 42
Figure 2.13: Block diagram of a standard synchronous generator with LFC ... 45
Figure 2.14: Single area LFC ... 46
Figure 2.15: LFC design methodology ... 47
Figure 2.16: Configuration of optimal control for LFC ... 48
Figure 2.17: Block diagram of standard fuzzy logic based controller (FLC) ... 49
Figure 2.18: H2/H∞ design synthesis ... 52
Figure 2.19: Typical neural network structure ... 56
xiii
Figure 3.1: IEEE 5-bus power system ... 67
Figure 3.2: Graph model of IEEE 5-bus system ... 68
Figure 3.3: IEEE 14-bus test system ... 71
Figure 3.4: Direct connection ... 71
Figure 3.5: IEEE 14-bus test system after 2nd iteration ... 72
Figure 3.6: IEEE 14-bus test system after 3rd iteration ... 73
Figure 3.7: Edge reduction algorithm flowchart ... 74
Figure 3.8: Generator coherency path ... 76
Figure 3.9: Modified ABC optimization flowchart ... 85
Figure 3.10: Objective function flowchart ... 86
Figure 3.11: Modified PSO flowchart... 90
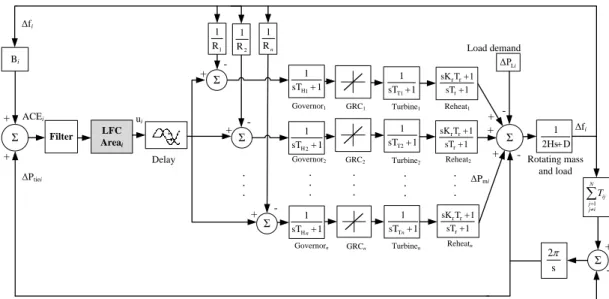
Figure 3.12: LFC model of control area i with n interconnected generators ... 93
Figure 3.13: PID controller‘s self-tuning algorithm ... 97
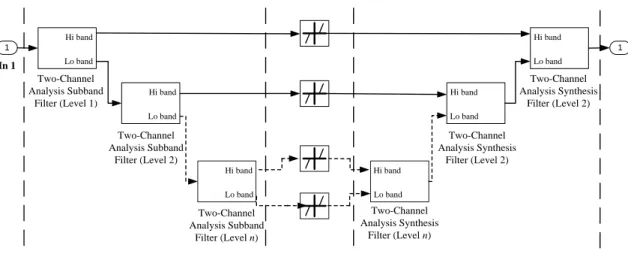
Figure 3.14: Wavelet denoising overview ... 105
Figure 3.15: Wavelet filter design ... 106
Figure 3.16: Complete network splitting flowchart ... 108
Figure 4.1: IEEE 30-bus test system one line diagram ... 111
Figure 4.2: Original IEEE 39-bus test system one line diagram ... 112
Figure 4.3: Modified IEEE 39-bus test system one line diagram ... 112
Figure 4.4: IEEE 118-bus test system one line diagram ... 113
Figure 4.5: Graph model of IEEE 30-bus test system ... 116
Figure 4.6: Edge reduction algorithm for Case 1 ... 117
Figure 4.7: Islanding solution for case 1 ... 119
xiv
Figure 4.9: Edge reduction algorithm for Case 2 ... 123
Figure 4.10: Islanding solution for case 2 ... 124
Figure 4.11: Convergence curve for Case 2 ... 125
Figure 4.12: Edge reduction algorithm for Case 3 ... 127
Figure 4.13: Islanding solution for case 3 ... 129
Figure 4.14: Convergence curve for Case 3 ... 129
Figure 4.15: Graph model of IEEE 39-bus test system... 132
Figure 4.16: Edge reduction algorithm for Case 4 ... 133
Figure 4.17: Islanding solution for case 4 ... 135
Figure 4.18: Convergence curve for Case 4 ... 135
Figure 4.19: Edge reduction algorithm for Case 5 ... 138
Figure 4.20: Islanding solution for case 5 ... 139
Figure 4.21: Convergence curve for Case 5 ... 140
Figure 4.22: Graph model of modified IEEE 39-bus test system ... 142
Figure 4.23: Edge reduction algorithm for Case 6 ... 143
Figure 4.24: Islanding solution for case 6 ... 145
Figure 4.25: Convergence curve for Case 6 ... 145
Figure 4.26: Graph model of IEEE 118-bus test system ... 148
Figure 4.27: Edge reduction algorithm for Case 7 ... 150
Figure 4.28: Islanding solution for case 7 ... 152
Figure 4.29: Convergence curve for Case 7 ... 153
Figure 4.30: Edge reduction algorithm for Case 8 ... 156
Figure 4.31: Islanding solution for case 8 ... 158
xv
Figure 4.33: Edge reduction algorithm for Case 9 ... 161 Figure 4.34: Islanding solution for case 9 ... 163 Figure 4.35: Convergence curve for Case 9 ... 163
Figure 5.1: Frequency deviation step response for load increment in island 1 for LFC Test Case 1 ... 172
Figure 5.2: Generator power response for load increment in island 1 for LFC Test Case 1 ... 173
Figure 5.3: Frequency deviation step response for load decrement in island 1 for LFC Test Case 1 ... 173
Figure 5.4: Generator power response for load decrement in island 1 for LFC Test Case 1 ... 174
Figure 5.5: Clean ACE signal for load increment in island 1 for LFC Test Case 1 ... 175 Figure 5.6: Noisy ACE signal for load increment in island 1 for LFC Test Case 1 ... 175 Figure 5.7: Noisy ACE signal with conventional low pass filter for load increment in island 1 for LFC Test Case 1 ... 175 Figure 5.8: Noisy ACE signal with wavelet filter for load increment in island 1 for LFC Test Case 1 ... 176 Figure 5.9: Clean ACE signal for load decrement in island 1 for LFC Test Case 1 ... 176 Figure 5.10: Noisy ACE signal for load decrement in island 1 for LFC Test Case 1 .. 176 Figure 5.11: Noisy ACE signal with conventional low pass filter for load decrement in island 1 for LFC Test Case 1 ... 177 Figure 5.12: Noisy ACE signal with wavelet filter for load decrement in island 1 for LFC Test Case 1 ... 177 Figure 5.13: Signal integrity index for various wavelet choices in island 1 for LFC Test Case 1 ... 178
Figure 5.14: Frequency deviation step response for load increment in island 2 for LFC Test Case 1 ... 181
Figure 5.15: Generator power response for load increment in island 2 for LFC Test Case 1 ... 182
xvi
Figure 5.16: Frequency deviation step response for load decrement in island 2 for LFC Test Case 1 ... 182
Figure 5.17: Generator power response for load decrement in island 2 for LFC Test Case 1 ... 183
Figure 5.18: Clean ACE signal for load increment in island 2 for LFC Test Case 1 ... 184 Figure 5.19: Noisy ACE signal for load increment in island 2 for LFC Test Case 1 ... 184 Figure 5.20: Noisy ACE signal with conventional low pass filter for load increment in island 2 for LFC Test Case 1 ... 184 Figure 5.21: Noisy ACE signal with wavelet filter for load increment in island 2 for LFC Test Case 1 ... 185 Figure 5.22: Clean ACE signal for load decrement in island 2 for LFC Test Case 1 ... 185 Figure 5.23: Noisy ACE signal for load decrement in island 2 for LFC Test Case 1 .. 185 Figure 5.24: Noisy ACE signal with conventional low pass filter for load decrement in island 2 for LFC Test Case 1 ... 186 Figure 5.25: Noisy ACE signal with wavelet filter for load decrement in island 2 for LFC Test Case 1 ... 186 Figure 5.26: Signal integrity index for various wavelet choices in island 2 for LFC Test Case 1 ... 187
Figure 5.27: Frequency deviation step response for load increment in island 3 for LFC Test Case 2 ... 191
Figure 5.28: Generator power response for load increment in island 3 for LFC Test Case 2 ... 192
Figure 5.29: Frequency deviation step response for load decrement in island 3 for LFC Test Case 2 ... 192
Figure 5.30: Generator power response for load decrement in island 3 for LFC Test Case 2 ... 193
Figure 5.31: Clean ACE signal for load increment in island 3 for LFC Test Case 2 ... 194 Figure 5.32: Noisy ACE signal for load increment in island 3 for LFC Test Case 2 ... 194 Figure 5.33: Noisy ACE signal with conventional low pass filter for load increment in island 3 for LFC Test Case 2 ... 194
xvii
Figure 5.34: Noisy ACE signal with wavelet filter for load increment in island 3 for LFC Test Case 2 ... 195 Figure 5.35: Clean ACE signal for load increment in island 3 for LFC Test Case 2 ... 195 Figure 5.36: Noisy ACE signal for load increment in island 3 for LFC Test Case 2 ... 195 Figure 5.37: Noisy ACE signal with conventional low pass filter for load increment in island 3 for LFC Test Case 2 ... 196 Figure 5.38: Noisy ACE signal with wavelet filter for load increment in island 3 for LFC Test Case 2 ... 196 Figure 5.39: Signal integrity index for various wavelet choices in island 3 for LFC Test Case 2 ... 197
Figure 5.40: Frequency deviation step response for load increment in island 2 for LFC Test Case 3 ... 201
Figure 5.41: Generator power response for load increment in island 2 for LFC Test Case 3 ... 202
Figure 5.42: Frequency deviation step response for load decrement in island 2 for .... 202
Figure 5.43: Generator power response for load decrement in island 2 for LFC Test Case 3 ... 203
Figure 5.44: Clean ACE signal for load increment in island 2 for LFC Test Case 3 ... 204 Figure 5.45: Noisy ACE signal for load increment in island 2 for LFC Test Case 3 ... 204 Figure 5.46: Noisy ACE signal with conventional low pass filter for load increment in island 2 for LFC Test Case 3 ... 204 Figure 5.47: Noisy ACE signal with wavelet filter for load increment in island 2 for LFC Test Case 3 ... 205 Figure 5.48: Clean ACE signal for load decrement in island 2 for LFC Test Case 3 ... 205 Figure 5.49: Noisy ACE signal for load decrement in island 2 for LFC Test Case 3 .. 205 Figure 5.50: Noisy ACE signal with conventional low pass filter for load decrement in island 2 for LFC Test Case 3 ... 206 Figure 5.51: Noisy ACE signal with wavelet filter for load decrement in island 2 for LFC Test Case 3 ... 206
xviii
Figure 5.52: Signal integrity index for various wavelet choices in island 2 for LFC Test Case 3 ... 207
xix
LIST OF TABLES
Table 3.1: First run of the employed bee mutation process ... 80
Table 3.2: Second run of the employed bee mutation process... 81
Table 3.3: Third run of the employed bee mutation process ... 81
Table 3.4: Onlooker bee phase mutation process ... 82
Table 3.5: Scout bee phase mutation process ... 83
Table 3.6: Complete line configuration array ... 88
Table 4.1: Simulation time information for different initialization technique ... 114
Table 4.2: System Parameters for Case 1 ... 117
Table 4.3: Initial network splitting solution for Case 1 ... 118
Table 4.4: Optimum network splitting solution for Case 1 ... 118
Table 4.5: First island information for Case 1 ... 120
Table 4.6: Second island information for Case 1 ... 120
Table 4.7: Transmission Lines Power Flow Analysis for Case 1 ... 121
Table 4.8: System Parameters for Case 2 ... 122
Table 4.9: Initial network splitting solution for Case 2 ... 123
Table 4.10: Optimum network splitting solution for Case 2 ... 124
Table 4.11: First island information for Case 2 ... 125
Table 4.12: Second island information for Case 2 ... 126
Table 4.13: System Parameters for Case 3 ... 127
Table 4.14: Initial network splitting solution for Case 3 ... 127
Table 4.15: Optimum network splitting solution for Case 3 ... 128
Table 4.16: First island information for Case 3 ... 130
xx
Table 4.18: Third island information for Case 3 ... 131
Table 4.19: System Parameters for Case 4 ... 133
Table 4.20: Initial network splitting solution for Case 4 ... 134
Table 4.21: Optimum network splitting solution for Case 4 ... 134
Table 4.22: First island information for Case 4 ... 136
Table 4.23: Second island information for Case 4 ... 136
Table 4.24: System Parameters for Case 5 ... 137
Table 4.25: Initial network splitting solution for Case 5 ... 138
Table 4.26: Optimum network splitting solution for Case 5 ... 139
Table 4.27: First island information for Case 5 ... 140
Table 4.28: Second island information for Case 5 ... 141
Table 4.29: Third island information for Case 5 ... 141
Table 4.30: System Parameters for Case 6 ... 143
Table 4.31: Initial network splitting solution for Case 6 ... 144
Table 4.32: Optimum network splitting solution for Case 6 ... 144
Table 4.33: First island information for Case 6 ... 146
Table 4.34: Second island information for Case 6 ... 146
Table 4.35: Third island information for Case 6 ... 147
Table 4.36: Fourth island information for Case 6 ... 147
Table 4.37: System Parameters for Case 7 ... 149
Table 4.38: Initial network splitting solution for Case 7 ... 151
Table 4.39: Optimum network splitting solution for Case 7 ... 152
Table 4.40: First island information for Case 7 ... 153
xxi
Table 4.42: Third island information for Case 7 ... 154
Table 4.43: System Parameters for Case 8 ... 155
Table 4.44: Initial network splitting solution for Case 8 ... 157
Table 4.45: Optimum network splitting solution for Case 8 ... 157
Table 4.46: First island information for Case 8 ... 159
Table 4.47: Second island information for Case 8 ... 159
Table 4.48: System Parameters for Case 9 ... 160
Table 4.49: Initial network splitting solution for Case 9 ... 162
Table 4.50: Optimum network splitting solution for Case 9 ... 162
Table 4.51: First island information for Case 9 ... 164
Table 4.52: Second island information for Case 9 ... 164
Table 5.1: First island information for LFC Test Case 1 ... 170
Table 5.2: Weightage set and corresponding performance index based on LAE of Island 1 for LFC Test Case 1 ... 171
Table 5.3: Optimum weightage set and LAE of Island 1 for LFC Test Case 1 ... 171
Table 5.4: Optimal PID controller gains and system performance of Island 1 for LFC Test Case 1 ... 172
Table 5.5: Signal integrity index for load variation investigation in island 1 for LFC Test Case 1 ... 178
Table 5.6: Second island information for LFC Test Case 1... 179
Table 5.7: Weightage set and corresponding performance index based on LAE of Island 2 for LFC Test Case 1 ... 180
Table 5.8: Optimum weightage set and LAE of Island 2 for LFC Test Case 1 ... 180
Table 5.9: Optimal PID controller gains and system performance of Island 2 for LFC Test Case 1 ... 181
Table 5.10: Signal integrity index for load variation investigation in island 1 for LFC Test Case 2 ... 187
xxii
Table 5.11: Third island information for LFC Test Case 2 ... 189 Table 5.12: Weightage set and corresponding performance index based on LAE of Island 3 for LFC Test Case 2 ... 190 Table 5.13: Optimum weightage set and LAE of Island 3 for LFC Test Case 2 ... 190
Table 5.14: Optimal PID controller gains and system performance of Island 3 for LFC Test Case 2 ... 191
Table 5.15: Signal integrity index for load variation investigation in Island 3 for LFC Test Case 2 ... 197
Table 5.16: Second island information for LFC Test Case 3 ... 199 Table 5.17: Weightage set and corresponding performance index based on LAE for Island 2 for LFC Test Case 3 ... 200 Table 5.18: Optimum weightage set and LAE for Island 2 for LFC Test Case 3 ... 200
Table 5.19: Optimal PID controller gains and system performance for Island 2 for LFC Test Case 3 ... 201
Table 5.20: Signal integrity index for load variation investigation in island 2 for LFC Test Case 3 ... 207
xxiii
LIST OF SYMBOLS AND ABBREVIATIONS
AGC : Automatic Generation Control ABC : Artificial Bee Colony
ACE : Area Control Error H : Generator inertia constant Kp : Proportional gain
Kr : Reheat gain
LFC : Load Frequency Control
PID : Proportional Integral Derivative PSO : Particle Swarm Optimization PGmax : Highest maximum power rating
PG : Power generated
PLoad : Load demand
Ploss : Power losses in transmission line
Pimbalance : Power imbalance
Pflow : Power flow in transmission lines
Pmax : Maximum power rating of the lines
Putil : Power utilized by transmission line
Pmin : Minimal power flow disruption
Ti : Integral time constant
Td : Derivative time constant
TH : Hydraulic time constant
Tr : Reheat element time constant
TT : Steam turbine time constant
xxiv
LIST OF APPENDICES
Appendix A………… ………... 228 Appendix B………… ………... 236 Appendix C………… ………... 256
1
CHAPTER 1: INTRODUCTION
1.1 Introduction
Power system is an important and significant element that plays a major part in humans‘ daily lives. The power system is an intricate web of connection that acts as a single unit and mainly comprises of three important power system elements which are power system generation, transmission and distribution. This intricate and complex interconnection is often referred to as a power grid. Due to rapid growth in technology, humans‘ dependence on reliable source of electricity has increased tremendously. As such, the reliability of the electricity is heavily dependent on the successful operation of each part of the system which is composed of multiple interconnected elements (Rosas-Casals & Solé, 2011).
The electrical power system has five main operating states which are normal, alert, emergency, in extremis state and restorative state (X. Wang et al., 2005). In the normal and alert state the system is still able to operate in stable condition. The emergency state denotes the state in which the safety threshold of the system is compromised and is the final state where major preventive measures need to be taken. Failure to do so will lead to the extremis state in which the system will experience cascaded failure which will lead to total system blackout. After blackout, the re-energization of the power system is referred to as the restoration state (Sakaguchi & Matsumoto, 1983).
More often than not, the power system blackout is caused by the malfunction of the transmission system. The blackout problem is also quite often associated by the transient or dynamic stability of the system rather than the steady state condition (Tiranuchit & Thomas, 1988). From this point of view, the generation part of the system
2
is at fault as the inability of the generator to maintain synchronism with the rest of the system after a huge disturbance leads to network collapse. Through this, it can be said that the power system generation and transmission plays a major role in ensuring system stability and power system reliability and security.
Many cases of blackouts in the world have been documented and published as reported in (Andersson et al., 2005; Hain & Schweitzer, 1997; Union for the Coordination of Transmission of Electricity, 2003; Vournas et al., 2006; Wong et al., 2007). One of the most common phenomena observed during system blackouts is that the frequency instability of the system causes the generator in the system to trip. This will in turn cause a cascaded effect that affects the supply and demand in the system as the protection elements of the system operates based on threshold of system parameters such as frequency, voltage or current (Wong et al., 2007). These unguided tripping will result in unintentional islanding. The formation of uncontrolled islands during cascading failure is one of the main causes of blackout in power system. Figure 1.1 shows the System Average Interruption Duration Index (SAIDI) based on the data from 1992 until 2001 (Committee on Enhancing the Robustness and Resilience of Future Electrical Transmission and Distribution in the United States to Terrorist Attack, 2012).
3
Figure 1.1: SAIDI based on a sample of countries
The figure which is taken based on a sample number of countries across the world indicates the measure of total power outage (number of minutes per year) experienced by an average customer. The trend highlights the fact that power outages are still being experienced by the customers despite major technological advancement in power systems.
Figure 1.2 shows the power outages due to extreme events during the first quarter of 2013(Klinger & Owen Landeg, 2014). Extreme events are events attributed to storms, winds, snow and other events due to estimate variation in weather pattern. Fifty two power outages were recorded across nineteen different countries. This evidently points to the presence of blackout in recent times.
4
Figure 1.2: Reported cases of power outages during the first quarter of 2013
The best way to handle the blackout problem would be through intentional or planned islanding. The main premise of intentional islanding is to split the network into ‗proper‘ islands. This is done to ensure that the islands continue providing power supply to meet the load demand. This means that by obtaining information on when the blackout is going to occur or observing the condition of the system in the extremis state, proper techniques have to be employed to split the power system network into different islands thus preserving the load generation capability which will ensure system stability. The weak area of the system will be partitioned off and reliable electrical supply to the customers can be guaranteed until the power system is fully restored. During the islanded operation, important system parameters such as voltage and frequency stability have to be carefully monitored in order to ensure proper operation of the islanded areas. In order to ensure successful post-islanding operation, the transient criteria of the system such as generator coherency and steady state criteria of the system such as
0 2 4 6 8 10 12 14 16 N u m b e r o f e ve n ts
5
power balance and transmission line capability has to be considered (Najafi et al., 2010).
Intentional islanding or controlled islanding as it is commonly referred to has gained researchers attention throughout the years. Intentional islanding for transmission network is a potential approach in defense strategy of power system to prevent total power blackout. Early research work in identifying the best network splitting solution has been reported in (Zhao et al., 2003) up to the most recent research in this area as reported in (Ding et al., 2013). In the intentional islanding approach, network splitting is carried out to separate the network into two or several islands. Each island will operate as a standalone network with generation capability to meet the island‘s load demand. However, less research work has been undertaken to identify the optimum network splitting solution and at the same time addressing the post-islanding frequency stability.
1.2 Problem Statement
There are certain issues that have to be considered before intentional islanding can be carried out, such as:
a. Optimization program for network splitting algorithm b. Load shedding and transmission line power flow analysis c. Post-islanding frequency stability
The main issue involved in determining the optimum network splitting solution is the combinatorial explosion of search space. A large scale power system usually contains extensive number of lines and the process to scour each possible configuration is a huge task which requires enormous effort. Furthermore, since the problem is discrete in nature, the conventional optimization program will not be able to efficiently find a
6
feasible network splitting solution. Combined with further constraints such as generator coherency and desired number of islands to be formed, the task of obtaining feasible network splitting solutions which are optimal is extremely difficult. The transmission lines to be disconnected have to be carefully selected in order to ensure minimal power flow disruption to maintain preserve transient stability in the system. Improper disconnection of transmission lines in forming the islands could further cause the islanded areas to collapse due transient instability. The power imbalance in each island should also be taken into account as deficit in generation could also trigger system instability.
The post-islanding frequency stability is also a crucial aspect in the intentional islanding problem. This is due to the fact that once the system has been islanded into different areas, each island has to sufficiently cater the load demand as a standalone network. The stability of the island in terms of the power flow in the transmission line has to be maintained within the maximum allowable capacity of the existing lines. The load frequency control of the generators should also be optimally tuned to address the changes in the system in the event there is increase or decrease in load demand. Hence, an optimization algorithm to optimally spit the network has to be developed based on practical constraints in order to obtain the feasible network splitting solutions. The post-islanding frequency stability should also be ensured in order to ascertain a successful islanding operation.
1.3 Research Objectives
The aim of this research is to propose an optimal network splitting solution using a modified optimization program based on discrete values and to analyze the post-islanding frequency stability by implementing an adaptive load frequency control to
7
maintain the frequency of each islanded area to its nominal value. The following are the objectives that are needed to be achieved:
a. To propose an optimum network splitting solution based on minimal power flow disruption using modified Artificial Bee Colony (ABC) optimization technique and compared with modified Particle Swarm Optimization (PSO) technique. b. To incorporate load shedding and transmission line power flow analysis in order
to maintain post-islanding frequency stability
c. To determine the optimum Proportional-Integral-Derivative (PID) parameters for the Load Frequency Control (LFC) for split network using multi objective ABC optimization technique and compared with multi objective PSO technique based on weighted sum in order to ensure the frequency stability in the post-islanding phase is maintained.
d. To implement online wavelet filter to effectively filter out the high frequency noise in the LFC signal input
1.4 Methodology and Scope of Research
The main scope of this research is to find the optimal network spiting solution for the intentional islanding scenario and to analyze and evaluate the post-islanding frequency stability. It would like to be stressed here that intentional islanding is achieved via system splitting or network splitting. Often, these terms are used interchangeably. However, in line with the title of the investigation, the term network splitting is used hereon. In order to successfully carry out the proposed research, the following methodologies are carried out:
Modeling of large scale power system based on graph theory
8 Modified optimization technique based on discrete values for network splitting
will be implemented
Load shedding scheme in order to maintain power balance criteria in each island will be carried out
Optimal tuning of the load frequency control using multi objective ABC optimization based on weighted sum to ensure the successful operation of islanded areas will be realized
Implementation of online wavelet filter to effectively filter out the high frequency noise while maintaining signal integrity at the same time
Verification and validation of the proposed optimization process will be carried out using Matlab software
This research proposes a modified optimization technique for network splitting problem based on discrete values and subsequently ensure the post-islanding frequency stability. The graph theory is utilized as the core of the algorithm to identify and split the large scale power system accordingly. Modified Artificial Bee Colony (ABC) optimization based on discrete values and modified Particle Swarm Optimization (PSO) technique based on discrete values are implemented to find the optimal network splitting solution. The proposed optimization method takes into account all practical constraints in the system to obtain the feasible splitting solution. Load shedding scheme is also introduced to maintain power balance equilibrium. The multi objective ABC optimization technique and multi objective PSO technique is implemented to optimally tune the load frequency control (LFC) to ensure post-islanding frequency stability of the system. The online wavelet filter is then integrated to the LFC model to effectively filter out the noise in the input signal to the controller.
9
The large scale power system based on the standard IEEE 30-bus, 39-bus and 118-bus test systems are modeled in Matlab software. The modified optimization technique is also developed and tested in Matlab software. The load frequency control model is designed and tested using Matlab‘s Simulink software.
The scope and limitation of this research are as follows:
The main focus of this research is to present an optimum solution for the network splitting problem. This is particularly useful for network planning engineers and future researchers to benchmark their result. As such, the time constraint in finding the solution is neglected in this investigation. This also enables Newton Raphson load flow method to be used instead of DC load flow.
The test cases currently considered are standard IEEE test cases and the desired islands are set to a maximum number of four based on current research carried out.
The coherent group of generators and the resultant number of desired islands are obtained from published results and investigations.
The automatic generation control (AGC) model of the multiple generator single area interconnected reheat thermal system is based on the model developed by (Rerkpreedapong et al., 2003). The designed model is a Laplace equivalent model of the power system.
Since the reactive power in the system can be compensated locally, only the active power is considered in the system. In regards to that, only the active power is considered in this investigation.
10
1.5 Thesis Outline
This thesis consists of six chapters and one appendix, which are organized in the following order:
Chapter 1: Introduction
This chapter presents an overview of the complete thesis by presenting a general introduction on the effect of blackout on the power system network. The importance of optimum network splitting algorithm is briefly discussed and the need for maintaining post-islanding frequency stability is also explained. The research objectives and the methodology employed are presented followed by the outline of the thesis.
Chapter 2: An overview of Network Splitting, Graph Theory and Load Frequency Control (LFC)
This chapter starts of by presenting a general overview of power system and the main causes of cascading failure in power system. The general outlook of power system security is then shown and the failures in the system that can lead to blackout in the power system are then highlighted. Several case studies on the blackout are presented and various blackout mitigation techniques are shown. The network splitting technique and the various algorithms used to successfully split the network is further discussed. Graph theory and the application of graph theory in power system network splitting are also presented here. The final part of these chapter discuses in great detail on the load frequency control (LFC) implementation. This chapter ends off by presenting a summary of the literatures and the techniques chosen to be implemented to develop the proposed methodology in line with the objectives of the research.
11
Chapter 3: Proposed Optimum Network Splitting Algorithm and Load Frequency Control Optimization
This chapter deals with two major aspects of the investigation which are the proposed optimum network splitting algorithm and load frequency control optimization. The proposed optimum network splitting algorithm is divided and explained in three subsequent tasks. The first task details on how the graph theory is utilized to model the large scale power system based on the IEEE test system. The second task presents the proposed edge reduction algorithm which is developed to produce the initial number of transmission lines to be disconnected. The third task presents the modified ABC optimization technique based on discrete values which shows how the optimum network splitting solution is found. The power balance criteria and transmission line power flow analysis is also described in this section. The second aspect of the investigation which is the load frequency control (LFC) optimization to ensure post-islanding frequency stability is described in detail. The ABC optimization used for the controller optimization technique is discussed and the self-tuning algorithm used by the PID controller is also shown.
Chapter 4: Validation of Proposed Optimum Network Splitting Algorithm
Three different IEEE test systems – IEEE 30-bus, IEEE 39-bus and IEEE 118-bus tests system are modeled using graph theory. Initially the edge reduction algorithm is applied and the selected edges to be disconnected are shown. Subsequently, the optimum network splitting algorithm is applied to obtain the optimum line configuration of the system based on the given system constraints. The solution obtained is compared with published results and alternative discrete optimization algorithm to validate the proposed technique.
12
Chapter 5: Validation of Proposed Load Frequency Control Optimization
This chapter will present LFC optimization technique. The LFC model of each test case – IEEE 30-bus, IEEE 39-bus and IEEE 118-bus tests system is designed in Simulink. The LFC is optimally tuned using multi objective ABC optimization technique based on weighted sum. The ABC optimization technique is compared with PSO technique to highlight the performance of the proposed technique. The load variation tests are carried out to observe and analyze the performance of each islanded areas as a standalone network. The system performance in terms of settling time and maximum overshoot is observed to determine the performance of the optimization technique. The online wavelet filter is implemented to effectively filter out the high frequency noise while maintaining the signal integrity.
Chapter 6: Conclusion and Future Work
The final chapter in the thesis summarizes the research conclusion and the contribution made in this research project. This chapter closes with recommendation for future work that can be carried out based on this research project.
13
CHAPTER 2: AN OVERVIEW OF NETWORK SPLITTING, GRAPH THEORY
AND LOAD FREQUENCY CONTROL
2.1 Power System Overview
Power system security and reliability is a paramount necessity in ensuring continuous power supply to the customer. In order to ensure that continuous power is delivered to the customers, many measures have been undertaken by the electrical utility board at each and every level of the power network. The three main levels of power system are power system generation, transmission and distribution. Detail planning of the system such as forecasting load demand right up to the protection of main elements in the system has been carried out by the power system operators to ensure minimum interruption. Despite such preventive measures being taken, failures in power system network still do occur.
Failures in power system can occur in any level and there are measures to overcome different type of faults. Faults such as single line to ground fault, double line to ground fault, fault due to lighting and or false relay tripping could occur at any time. Equipment such as circuit breakers, relays and other protection equipment are used to mitigate these faults. Due to the size of the power system which comprises of thousands of different equipment, the malfunction of single equipment is not uncommon. The failure of one of the equipment can further aggravate the instability of the whole network and is known as cascading failure.
Cascading failure can be defined as failure in a part of the network which can trigger failures in successive part of the network. This will lead to a catastrophic event known as blackout. Blackouts which are power outages in the network are detrimental towards
14
the stability of power system network as blackouts can result in partial or total collapse of the power grid. Among the main causes of faults that could lead to cascading failure are frequency collapse, thermal overload, transient instability, voltage instability and hidden failures (Kirschen, 2002).
2.2 Power System Security
Power system security is an important term which is synonymous to providing reliable power supply in power system. Security in a broader term reflects the ability of the system, to a certain degree to provide reliable and continuous power supply to the customer during imminent disturbances (contingencies). The term power system security and power system stability are often used to denote the reliability of the power supply. However, upon further scrutiny, it can be observed that the power system security, which is the wider term, encompasses power system stability as one of its sub-terms. When a power system is subjected to inadequate level of security, very often than not, the power grid will suffer a catastrophic failure. This catastrophic failure, known as blackout could cause economic loss and even in extreme cases, injuries and loss of life (Morison et al., 2004).
The power system should be able to meet the specified security criteria in both the transient and steady state. Failure to do so in any one of the state would deem the system incapable of providing a reliable supply of power to the consumers. The system should be able to provide power supply within the boundaries specified in the operating constraints during pre and post fault operations. Among the main aspects of security assessments are:
a) Frequency – Underfrequency
15
c) Thermal Loading – Thermal Overload
In order to further characterize and classify the overall operating condition of system, the power system operating states have been developed by (Dy Liacco, 1967). The operating states that has been defined embodies the whole structure and the operating state of the of the power system. The operating state of the system has to be identified in order for the control action to take the necessary measures to ensure the reliable operation of the power system.
Normal
Restorative Alert
In extremis Emergency
Figure 2.1: Operating States of Power System (Morison et al., 2004)
Figure 2.1 shows the five important operating states of the power system. The dashed arrows represent the contingencies resulting from unavoidable circumstances or events that are unplanned. The solid arrows in the diagram represent the control action that needs to be taken to return to normal operating state of the system. One of the main control objectives is to ensure that the power system is operating in the normal stage and in any event there is any disturbance, the power supply outage duration should be kept to the bare minimum. The operating states are:
1. Normal state: All system parameters are within operating conditions specified by
16
plausible contingencies within the technical constraints can be handled properly to ensure normal operation.
2. Alert state: Due to contingency measures, parameters or technical constraints of the
system is violated. However, power is still being continued to be served to the customers. Preventive and restorative action has to be undertaken to return the system back to normal state. Failure to do so might cause system to be subjected to further instability which could lead to the emergency state or in worst case scenario, in extremis state.
3. Emergency state: In the event of severe contingencies in the alert state, the
emergency state will be the resultant outcome. Thus, failure to carry out proper preventive or restorative action in the alert state might result the system deteriorating even further. System is still intact and power is still being continued to be served. Active corrective and control actions have to be undertaken to return the system to alert state and subsequently to normal state. Emergency control action such as generator tripping and fault clearing need to be done to prevent the system from going to in extremis state.
4. In extremis state: The worst case scenario in power system as the system is no
longer intact. Major portion of the network will experience the absence of power supply and the system will either be in partial or complete blackout. In this state, any possible control action should be taken to minimize the damage as cascading failure can further cause widespread damage.
5. Restorative state: In order to ensure that system is restored back to normal operating
conditions, the restorative action is taken by applying appropriate control actions such as restoring parts of areas in which the power plants have black start capability. If the damage done by blackout is extensive, the system will be returned to the alert state before restoring it back to normal state.
17
2.3 Failures in Power System
Reduction in predictability of the power system operation has given rise to many possible factors that could influence the normal operation of the power system. These factors could also be a possible cause to many disturbances in the system. These disturbances could be minor interruptions lasting for short period of time to huge disturbances that could eventually lead to blackout in the system. Predictability of power system is a very important aspect. This will ensure that the designed system will be able to mitigate any abnormal conditions that may arise from the system based on existing knowledge. As an example, power system operators often forecast the load demand of the system a day earlier to be able to dispatch generation units accordingly.
However, there are some factors that could influence the operation predictability of the power system (Morison et al., 2004). A failure in any one of these components could propagate and further result in cascading failure that could potentially lead to total system blackout. Among the factors that are related to the transmission and generation stability are:
1. Lack of new transmission facilities: The transmission lines are overloaded based on
their initial capacity or rating in which the lines were designed. Thus, due to protection equipment operation, the lines might be overloaded whenever fault clearing is carried out. This could be attributed to the unplanned increase of load demand over period of time.
2. Increased dependence on controls and special protection systems: Incorrect control
operations might lead to further issues as protection equipment‘s malfunction could sever connection of unfaulted lines. Thus, the control and special protection system has to operate without any errors.
18
3. Increased dependence on communications and computer systems: Software failures
might result in erroneous control action. This has to be eliminated as the control actions that are initiated by software based on intelligent algorithms has to be robust in identifying faults and adapt to the dynamics of the network.
4. Trend towards interconnection: Since the development of power system has
integrated many different geographical areas, the interconnection between different areas of the system has grown significantly. As such, dynamic properties of the system such as generator coherency and small signal stability, plays a major role in determining the characteristics of the system.
The blackout event is often caused by a single generation or transmission element. Different factor as described above can cause the system to experience multiple failures and lead to total disarray. This can however be prevented if corrective actions are taken when these faults are detected earlier in the system. However disturbances, especially during the peak load condition can be quite detrimental as any amount of corrective action might not be able to save the system from entering the emergency state. The flowchart in Figure 2.2 provides a clearer description on the process leading to blackout (Pourbeik et al., 2006).
The power system initially operates under normal operating conditions. In this state, there is no major disturbance in the system as the power system provides reliable and secure supply to meet the load demand. When a disturbance or any event that could cause fault in the system is initiated, the system operator is made aware of this condition. This is made possible by monitoring the changes in important system parameters such as voltage, frequency, current and power values.
19
Power system operating under nominal condition
Initiating event which causes fault in the system
Cascading outages
System stable (Emergency State) Proper operator / automatic
remedial action YES NO System readjustment Mutually exclusive secondary event
Final stages of collapse
Blackout Point of no return
Proper automatic control
Figure 2.2: General process of events leading to total system blackout
Manual or automatic action is then initiated to recover the system from the faulted condition. If the corrective or remedial action is successful, the system is back to its stable state. However, the system is still considered to be in an emergency state as a certain amount of time is required to recover the system to its pre-fault condition. If the system is proven to be stable, readjustment is carried out and the system returns back to its normal operating condition.
If the remedial action is unsuccessful, then the system will start to experience cascading failure. Multitude of equipment starts to fail or maloperate. This will further cause other parts of the system which was initially operating in normal condition to be affected. This could also occur during the stable state when the system is observed for a period of time before readjustment is carried out. At this state, if a major secondary event occurs, then the system would also experience cascading failure. At this stage,
20
extreme remedial action is required such as under frequency load shedding or under voltage load shedding. This is of critical importance to return the control of the system back to the operator.
If the corrective action in the cascading outage stage is unsuccessful, then the system enters to point of no return in which the system will experience the final stages of total system collapse. The system might split into uncontrollable islands. When this happens, the islands might experience a large mismatch between generation and load demand. At this point, no amount of measures could be undertaken to save the system as the system will eventually end in total system blackout.
2.4 Blackout
Blackout is the worst case scenario in power system. A blackout can cause either partial or total collapse of the system. Blackouts can last for short period or a long period of time. As discussed by (Rosas-Casals & Solé, 2011), the failure of the transmission system due to cascading failure could also be considered as a blackout. There are many reported cases of blackout and the subsequent impact to the affected customers. From these cases, we will be able to observe and analyze the cause and effect of the events that lead to the blackout.
1. Israel (Hain & Schweitzer, 1997): The Israeli Electric Corporation has an electrical
network which consists of 400 kV, 161 kV, and 110 kV circuits. The generation capacity of the system is 6388 MW (Union for the Coordination of Transmission of Electricity, 2003) and the recorded peak load is 5538 MW. During the event that leads to blackout, double circuit tripping occurred on the 161 kV line. The 161 kV line connects the northern and southern part of the system. The remaining interconnecting line was also tripped due to power oscillations. This has caused the
21
system to be split into two islands – ―northern‖ and ―southern‖ island. The load-generation equilibrium in ―southern‖ island was not met as the demand exceeded the available supply in the island by 900 MW. This caused the frequency in the island to decreases rapidly and ultimately the generating units in the area were tripped off leading to blackout in the southern part of the system.
2. United States and Canada (Andersson et al., 2005): The U.S / Canadian blackout
was a severe case of blackout as 50 million people were affected. The total load demand of the system was approximately 630 GW. Due to generator fault, the active power generation was severely limited. Cascading failure due to transmission line overload and inadequate load shedding further aggravated the instability of the system. The generators in the system were not able to meet the load-generation equilibrium, thus tripping off the remaining generating units. Finally, due to loss of major tie lines, the power flow in the system was affected as reverse power flow was recorded. The remaining transmission lines were heavily loaded and the cascading failures lead to the devastating blackout in the system.
3. Athens (Vournas et al., 2006): The blackout that occurred in southern Greece
affected approximately 5 million people. The network in Greece consists of 400 kV and 150 kV transmission lines. The recorded peak load was 9500 MW. The reason for voltage instability in the system is due to the distance between generating units and load which are far apart. Due to heavy demand during summer, in which the usage of air conditioning units increases, one of the generating units was tripped off and failure in load shedding occurred when another generating unit was tripped off at the same time. Due to reduction in power supply and no proper load shedding initiated, the load-generation equilibrium was not met and the voltage collapse in the
22
system was experienced. This caused the system to split unintentionally into two islands – north and south. The northern part of the system had surplus of generation and the over frequency relays were able to operate and bring back the system to stable operation. The southern part of the island experienced further issues as the voltage stability was compromised leading to undervoltage relays tripping off the generating units. This eventually led to blackout.
4. Italy (Union for the Coordination of Transmission of Electricity, 2003): The power
system in Italy involves four other different countries (Austria, France, Slovenia and Switzerland) which are interconnected. The northern part of comprises tie lines connected to neighboring country (Switzerland) rated at 220 kV and 380 kV. A flashover occurred on the 380 kV line causing the line to be disconnected. The other lines in the system were then tasked to take over the load to resume normal operation. However, due to the overloading conditions of other lines, the line overload was only acceptable for a short period of time. Due to overheating, the resultant voltage sag caused the tripping of the remaining interconnecting line (380 kV). Losing both important tie lines (380 kV), the overload condition on the remaining lines which were rated lower made the scenario become even worse. The high overload conditions attributed to voltage instability in the area causing several generating units to trip. Load shedding was further initiated to save part of the network, however due to absence of adequate power supply, the Italian power network faced total blackout.
5. Taiwan (Wong et al., 2007): The Taiwan Power Company is the power system
operator in Taiwan which is responsible for power system operation throughout the island. The Taiwan power system comprises of 69 kV, 161 kV and 345 kV
23
transmission lines. The generation capacity of the system is 28,480 MW and the recorded peak load is 24,206 MW. A ground fault occurred due to tower collapse which was carrying the 345 kV line. This further caused successive relay tripping in the system and the network was split into two areas comprising ―north‖ and ―south‖ of Taiwan. The generation-load balance in the northern area experienced a deficit in power supply as the surplus power generated in the southern area could not be transferred. The southern part on the network had surplus generation which led to overfrequency in the area. Due to this, the frequency in the northern area start to collapse and generating units in the area were tripped off. Several generating units in the northern area had to be tripped off to maintain the generation-load equilibrium and to ensure the proper operation of the island.
6. Malaysia (P Kundur et al., 2007; Smith, 2003): Malaysia has its fair share of major
power blackouts thorough its history. On 29 September 1992, a total power blackout occurred due to lighting strike on the transmission facility. This caused a cascaded effect in the transmission and distribution system. On the 3rd of August 1996, peninsular Malaysia experienced a 16-hour blackout due to transmission problem. This massive power failure was due to the tripping of a transmission line near one of the power stations which caused a cascaded effect which shut down all the other power stations in a sequential manner. Another total system blackout was experienced on 18th November 1998, where the distance protection relay was not able to clear the fault on transmission line which occurred due to flashover. This caused the 275 kV lines connecting the North/East to the Central/South system to trip and further separating the system into two islands. In January 2005, another blackout case was reported which caused the power outage on the northern states of the country (Perak, Penang, Kedah, and Perlis). The opening of a breaker to clear