De•tect (n.)
To discover or determine the existence or presence of <something>. Merriam-Webster Online Dictionary
Detection Methods
Chapter 6
Kenneth Petersen
, PhD, MSc
Immunohistochemistry (IHC) has emerged as a powerful in-vestigative tool that can provide supplemental information to the routine morphological assessment of tissues. The use of IHC to study cellular markers that define specific phenotypes has provided important diagnostic, prognostic, and predic-tive information relapredic-tive to disease status and biology. The application of antibodies to the molecular study of tissue pathology has required adaptation and refinement of IHC techniques, particularly for use in fixed tissues. In contrast to solution-based immunoassays that detect relatively abundant native proteins, in fixed tissues the preservation of antigen is variable and unpredictable. Thus, the history of IHC has evolved so that we today are able to detect proteins in tissue with great sensitivity, and also provide a semi-quantitative as-sessment, with the ultimate goal of integrating tissue-based analysis with proteomic information.
Immunohistochemistry: In the Beginning
The first staining with an antibody to find an antigen in tissue was reported in 1941, using a fluorescence-labeled antibody (1). Twentyfive years later, the enzyme horseradish peroxidase (HRP) together with 3,3’-diaminobenzidine (DAB) was used to study mouse kidneys (2). The following year, an antibody linked to HRP was used to visualize antigens in tissue using the indi-rect method, where a second antibody is used to recognize the first or primary antibody which is attached to the antigen (Figure 6.1). The secondary antibody recognize the constant part (Fc) of the primary antibody, which makes it possible to recognize all primary antibodies as long as they are from the same species. These pioneering studies using enzyme labels instead of fluorescent dyes and the application to formalin-fixed, paraf-fin-embedded tissue (FFPE) (3) opened the door to the use of immunoperoxidase methods for routine diagnosis in anatomic pathology (4, 5), and led to the development of modern meth-ods of IHC (see Chapter 1).
The good preservation of features and improved morphology of FFPE of tissues, makes this method the preferred choice in almost every clinical pathology laboratory. The indirect staining methods are likewise the preferred staining methods because labeling of the primary antibody is avoided, and they give a
more intense staining. The secondary antibodies used in the indirect methods are typically raised in goat against either mouse (GaM) or rabbit (GaR) antibodies. With the successful application of IHC methods to formalin-fixed specimens, new staining methods were rapidly developed including the immu-noperoxidase bridge method (6) and the peroxidase anti-per-oxidase (PAP) complex method (7).
The next generation of IHC methods emerged in 1981 with the avidin-biotin-based methods (Figure 6.2) (8). These methods are still used to a limited degree in some pathology laborato-ries and rely on the strong affinity of avidin or streptavidin for the vitamin biotin.
Streptavidin (from the bacteria Streptomyces avidinii) and avi-din (from chicken egg) both have four binavi-ding sites for bio-tin. The biotin molecule is easily conjugated to antibodies and enzymes. In the avidin-biotin complex (ABC) method second-ary antibodies are conjugated to biotin and function as links between tissue-bound primary antibodies and an avidin-bio-tin-peroxidase complex. The four binding sites for biotin make ‘lattice’ complexes possible, where the avidins are linked to-gether via the enzyme (8). The only requirement is that the en-zyme has at least two biotin molecules attached so that it can function as a link between the avidins. A colorless substrate,
Chapter 6.1
Introduction
Chapter 6.2
Avidin-Biotin Immunohistochemistry
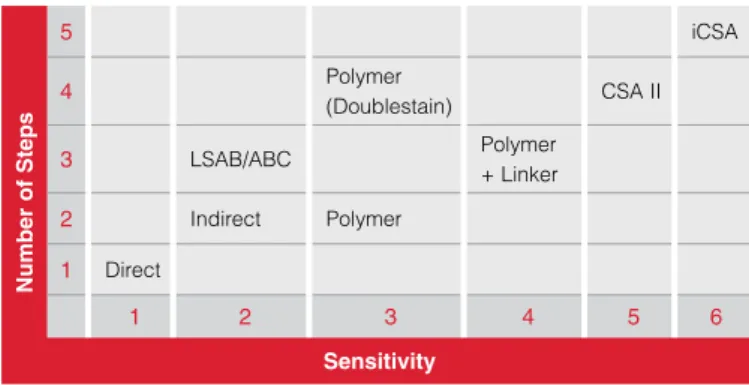
Table 6.1 Complexity vs. Sensitivity of Detection Systems.
LSAB=Labeled streptavidin-biotin; ABC=Avidin-biotin complex; CSA II=Catalyzed signal amplification II, iCSA = Improved catalyzed signal amplification. 5 iCSA 4 Polymer (Doublestain) CSA II 3 LSAB/ABC Polymer + Linker 2 Indirect Polymer 1 Direct 1 2 3 4 5 6 Sensitivity Number of St eps
e.g. DAB, is subsequently added, and is converted to a brown end-product by the multiple peroxidase enzyme molecules now attached at the site of the target antigen.
In a similar method the labeled streptavidin-biotin (LSAB) meth-od also utilizes a biotinylated secondary antibmeth-ody that links pri-mary antibodies to a streptavidin-peroxidase conjugate (Figure 6.3). This approach has the advantage that preassembly of the ABC complex is not needed. In both methods a single primary antibody is subsequently associated with multiple peroxidase molecules, and because of the large enzyme-to-antibody ratio, a considerable increase in sensitivity is achieved compared to direct peroxidase-conjugate methods.
When using these methods it is important to be aware of their limitations. Avidin has a tendency to bind non-specifically to lectin-like and negatively charged tissue components at physi-ological pH. For streptavidin less non-specific tissue binding is observed. Another challenge is the presence of endogenous bio-tin in tissues. Formalin fixation and paraffin embedding has been shown to significantly reduce the level of endogenous biotin, but residual activity can still be observed in tissues such as liver and kidney. Methods to block endogenous biotin are partially effec-tive, but add another layer of complexity to an already complex procedure. In frozen tissue sections, the level of endogenous bi-otin is usually even higher than that encountered in FFPE speci-mens, giving troublesome non-specific binding of the avidins.
The limitations associated with the avidin-biotin system, led to the development of detection systems with higher sensitivity and specificity, employing polymer-based IHC techniques (9). These methods utilize a polymer backbone to which multiple antibodies and enzyme molecules are conjugated. As many as 70 enzyme molecules and about 10 primary antibodies can be conjugated to a single dextran backbone. This con-struct allowed the entire IHC staining procedure, from prima-ry antibody to enzyme, to be accomplished in a single step (10). On the other hand, one limitation of this method was its restriction to a select group of primary antibodies provided
Chapter 6.3
Polymer-Based
Immunohistochemistry
Enzyme Secondary antibody Primary antibody Tissue antigenDirect staining Indirect staining Label
Primary Label
Figure 6.1 Direct vs. indirect staining.
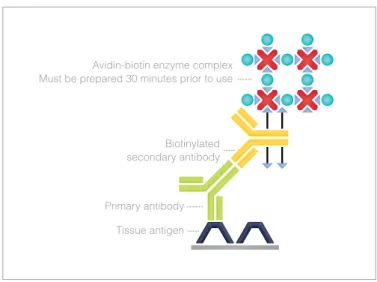
Biotinylated secondary antibody Avidin-biotin enzyme complex Must be prepared 30 minutes prior to use
Primary antibody Tissue antigen
Figure 6.2 Avidin-Biotin Complex (ABC) method.
Streptavidin enzyme complex Biotinylated secondary antibody, mouse/rabbit
Primary antibody Tissue antigen
by the manufacturer, and lack of utility for many user-supplied primary antibodies.
To overcome this limitation a new type of visualisation system, EnVision™, was introduced (Figure 6.4). This indirect visualiza-tion system also contains a dextran backbone to which multi-ple enzyme molecules are attached. However, the EnVision™ system contains secondary antibodies with anti-mouse Ig and anti-rabbit Ig specificity. This ‘universal’ reagent could be used to detect any tissue-bound primary antibody of mouse or rabbit origin. The broad applicability of this method opened the door to a new family of polymer-based IHC methods. The sensitivity of these methods when compared to LSAB and ABC methods is comparable or even slightly greater in most cases (11). By adding an additional linker step, the sensitivity can be improved further. However, because of the large molecular size of the polymer conjugates, accessibility to certain epitopes can be a challenge, presumably due to steric hindrance.
This amplification technique is based on the ability of peroxidase enzyme to oxidize phenolic compounds to highly reactive and unstable intermediates called radicals (12). The commonly used substrate in this technique is tyramine. It has a phenol in one end, used by peroxidases, and an amine in the other end of the
mole-cule. The amine can be used to add biotin, or other molecules of interest, to tyramine through an amide bond, hence the tyramide amplification name also used for this method. When tyramide is oxidized, it will react rapidly with electron-rich aromatic com-pounds, such as the amino acid tyrosine found in protein mole-cules (13). This reaction can be used in IHC to bind biotinyl-tyr-amide to protein molecules in the immediate vicinity of peroxidase enzymes. This reaction results in the deposition of numerous bio-tin signals around the primary antibody.
In a typical CSA-based IHC procedure, peroxidase en-zymes are first associated with primary antibodies by any of the standard IHC methods (Figure 6.5). Biotinyl tyramide and hydrogen peroxide are applied as a substrate to gen-erate numerous biotin signals. These biotin molecules can then be used to capture subsequent streptavidin-peroxi-dase enzymes to produce the desired staining by addition of the appropriate substrate (14). Another possibility is rep-etition of the biotinyl-tyramide reaction, which will increase the numerous biotin signals even further. This cycling of the reaction is practically limited to two or three cycles before background staining becomes too high. CSA is a highly sen-sitive amplification technique, but has several disadvantag-es that prevent its general use. The method is time consum-ing, results can be hard to reproduce, and as in previous biotin-based methods endogenous biotin can give a high background staining.
Chapter 6.4
Catalysed Signal Amplification (CSA)
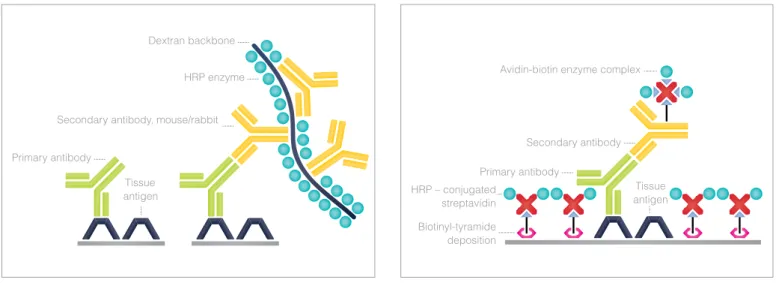
Figure 6.4 Two-step polymer method (EnVision™).
Primary antibody
Tissue antigen
HRP enzyme Dextran backbone
Secondary antibody, mouse/rabbit
Figure 6.5 The CSA system.
Avidin-biotin enzyme complex
HRP – conjugated streptavidin Biotinyl-tyramide deposition Tissue antigen Secondary antibody Primary antibody
Fluorescyl-tyramide can replace biotinyl-tyramide to avoid en-dogenous biotin background. In this procedure peroxidase is associated with a tissue-bound primary antibody by applica-tion of a secondary anti-mouse antibody to which peroxidase has been conjugated. The peroxidase catalyzes the conver-sion and deposition of fluorescyl-tyramide onto the tissue sec-tion. At this point the reaction can be terminated and viewed by fluorescence microscopy, or the signal can be converted to a colorimetric reaction by the sequential application of an an-ti-fluorsecein antibody conjugated to peroxidase followed by a diaminobenzidine-hydrogen peroxide substrate.
In comparison to standard IHC methods, tyramide amplifica-tion methods have typically increased sensitivity by at least 50-fold or greater (15). As with any amplification method, back-ground tends to increase along with signal.
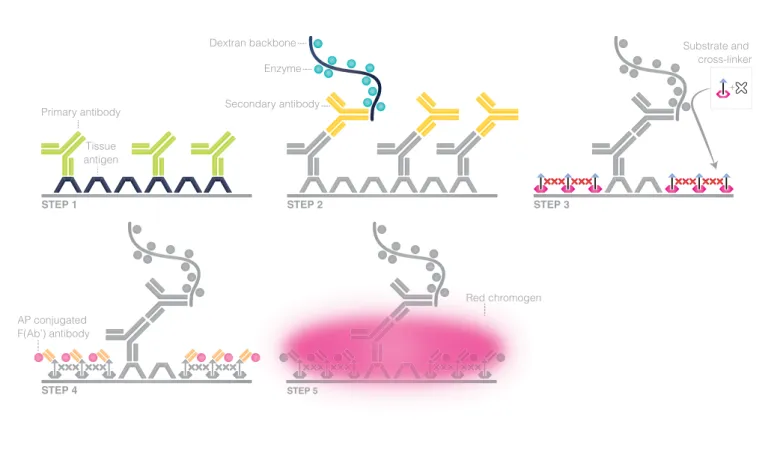
The latest improvement of the CSA method to increase sensi-tivity and improve signal to noise ratio introduces a new more soluble substrate. It entails a background-reducing effect, combined with a crosslinker that enhances the precipitation of the substrate in step 3 (Figure 6.6) The fluorescein is con-served in the substrate while the tyramine is substituted with ferulic acid, which is a much better peroxidase substrate. To-gether these changes improve CSA method by maintaining high sensitivity and reducing background, giving high sig-nal-to-noise ratio. Furthermore, the incubation time in each step can be reduced significantly making it possible to stain a tissue in less than one hour.
Chapter 6.5
Fluorescyl-tyramide Amplification
Chapter 6.6
Improved Catalysed Signal
Amplification (iCSA)
Primary antibody Tissue antigen AP conjugated F(Ab’) antibody STEP 1 STEP 2 STEP 4 STEP 5 STEP 3 Secondary antibody EnzymeDextran backbone Substrate and
cross-linker +
Red chromogen
STEPP55
Rededchchromogen
In some cases there is a need for knowledge about the relative localization of targets, which context can only be obtained by vis-ualizing multiple targets in one slide. In other cases, the material available for staining is scarce and there is a need for multiplexing to retrieve all possible information out of material available.
Definition of Multi-Staining IHC
Multiple staining can be defined as the detection of two or more targets on one slide, thus increasing the information ob-tained from each slide and reducing turnaround time, com-pared to single staining or sequential staining (see definition below). This technique also makes it possible to assess the topographic relationship of two or more targets, for exam-ple, to determine whether targets are present in different cell populations, in different cells, in the same cell, or even in the same cellular compartment. In addition, multiple staining al-lows the combination of in situ hybridization (ISH) and IHC, giving information about a particular target both at protein level and DNA/mRNA level. Information can also be obtained on possible cell-to-cell spatial contacts of different cell types. Furthermore, with an increasing demand for less invasive sampling techniques and smaller and fewer specimens avail-able, multiple staining has the advantage not only of conserv-ing tissue, but also savconserv-ing time and reagents.
Examples of Multiple Staining
The diagnosis of prostatic intra-epithelial neoplasia (PIN) is just one example of the clinical importance of multiple staining. Prostate needle biopsy is the preferred method for diagnos-ing early prostate cancer, but in some cases the diagnosis is uncertain because the biopsy includes only a few malignant glands, or a few hyperplastic or dysplastic glands that are difficult to distinguish from cancer (16, 17). Since basal cells typically are present in hyperplastic, and dysplastic glands, as well as around ‘in situ’ (PIN) lesions, but absent in malignant in-vasive glands, the demonstration of basal cells can be used to assist recognition, or exclusion, of invasive cancer. Basal cells are labeled using high molecular weight cytokeratin, cytokera-tin (e.g. CK5/6 - cytoplasmic) or p63 (nuclear) immunostaining, or both. In addition, AMACR/P504S, is expressed in a high per-centage of prostate carcinomas, but is negative or only weakly
expressed in benign prostate tissue. Thus it is used as a pos-itive cancer marker, often in a multiplex stain with keratin and p63 (see example in Figure 6.8). If single stains are done on serial sections, interpretation is much more difficult and ambig-uous lesions may be absent in adjacent cuts, especially when dealing with small foci, with the result that some malignancies may remain undiagnosed. In this context, multiple staining pro-tocols significantly improve the ability to distinguish between benign and malignant lesions. This approach, which reduces the percentage of ambiguous lesions and the need for addi-tional biopsies, is being extended to facilitate recognition of other invasive cancers, as in breast.
Technical Challenges
Before embarking on a multi-staining project, some important issues should be considered:
Most primary antibodies used today originate from either mouse or rabbit and are visualized using systems based on anti-mouse and anti-rabbit secondary antibodies. The challenge of distinguishing between two primary anti- bodies of the same species (mouse-mouse, or rabbit- rabbit) must be addressed, because separate mouse and rabbit primary antibodies to the chosen targets often are not available. Utilizing two primary antibodies of the same species can require quite elaborate protocols.
Spectral differentiation of stain colors may be difficult, especially if the targets are co-localized leading to a mix- ture of colors (18). The ‘mixed’ color should contrast well with the two basic colors. In the case where a rare target is co-localized, the color reaction of the more abundant target will tend to dominate the other.
Even if targets are not co-localized it is difficult to balance signals so as to enable visualization of a rare target in the same slide as highly expressed targets. An adjustment in concentration of the primary antibodies may solve this problem.
If different targets are viewed under different magni- fications, it may be difficult to obtain the desired
topographic information.
Image analysis approaches, such as ‘spectral separation’, are generally superior to the human eye in segregating the different color reactions in a multiplex stained slide.
Pre-treatment
Multiple staining, like single staining, can be performed on any of FFPE tissue sections, frozen sections, cell smears and cytospin preparations. Multiple staining may be constrained by the fact that it may not be possible to find a single tissue pre-treatment (retrieval) protocol that is optimal for all targets. In this case, it may be necessary to determine a method that allows all targets to be stained, although the method may be sub-optimal for some targets.
Multi-Staining Method Selection
To ensure success, IHC staining using multiple antibodies must be carefully planned. If primary antibodies of the desired spec-ificity for the two (or more) targets are commercially available, and made in different species, then there are several different staining methods that one can choose. However, very often the choice may be limited by the reagents available (19). Care must be taken to avoid cross-reactivity between reagents; in the event that avoidance is not possible, then measures must be taken to minimize the risk, including additional controls to detect significant cross reactivity if present.
In general, staining methods can be divided into the following classes:
Sequential staining
By this method, one staining procedure succeeds another. For example, the first antibody is applied to the tissue section fol-lowed by a labeled detection system such as streptavidin-bi-otin horseradish peroxidase (HRP), with a chromogen such as DAB. The second primary antibody is applied only after the excess DAB is rinsed off, followed by labeling with a streptavi-din-biotin alkaline phosphatase (AP) detection system and a colored chromogen. The biggest advantage of sequential staining is that by this procedure problems related to cross-re-activity are minimized, possibly due to steric interference. A sequential staining is shown in Figure 6.7. Here, the primary and secondary antibodies from the first staining were eluted before the staining of the next target was performed. The dis-advantages of sequential staining are: the method cannot be used for co-localized targets, the technique often leads to a long staining protocol and carries an inherent risk of incorrect
double staining due to incomplete elution of unreacted rea-gents from the first staining sequence, before application of the next reagents.
Elution may become an issue with some high-affinity primary antibodies, as these may remain at their binding-site, leading to spurious double stained structures. Elution also risks de-naturing epitopes of antigens to be visualized subsequently. Furthermore, for some chromogens there is a risk that the first chromogen (DAB in particular) may shield other targets. This technique is, therefore, not recommended for evaluation of mixed colors at sites of co-localization, because not all reac-tion products are capable of surviving the rigorous washing required to remove the antibodies. To avoid such problems and blurry staining results, it is recommended to use the most ‘robust’ dyes such as DAB, Fast Red, AEC and Blue chromog-en first, followed by other less ‘robust’ dyes.
Simultaneous staining
In a simultaneous double stain, the primary antibodies can be applied simultaneously. The advantage of this method is that it is less time-consuming because the reagents can be mixed together. However, the technique can only be used if the primary antibodies are from different species, or are di-rectly labeled with different enzymes (20).
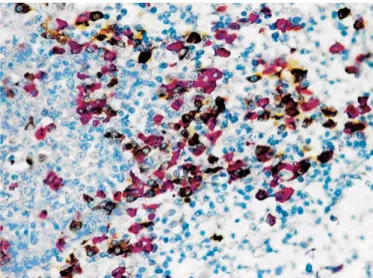
Figure 6.7 Sequential double staining method performed with the EnVi-sionTM G|2 Doublestain Kit using polyclonal anti-kappa light chains (red)
and polyclonal anti-lambda light chains (brown) as primary antibodies. FFPE tissue sections from tonsils.
A simple example of the direct method is when the primary antibodies are fluorescence-labeled with fluorochromes emit-ting different colors to allow direct visualization of two or more targets. This avoids cross-reactivity, but is rarely practical since some form of amplification is necessary to get sufficient fluorescent signal. Alternatively, the primary antibodies may be conjugated directly with enzymes, biotin or haptens, sub-sequently employing the corresponding secondary antibody or streptavidin reagent. This approach is less time-consuming than the sequential method, because primary and secondary antibodies can be mixed together in two incubation steps. However, it requires avoiding all cross-reactivity.
With the indirect method it is also possible to apply time-sav-ing antibody ‘cocktails’ because the primary antibodies are recognized by different secondary antibodies. Generally, it is advantageous to use secondary antibodies raised in the same host in order to prevent any unexpected interspecies cross-reactivity at the level of the secondary antibody. One example of such a system is the EnVisionTM DuoFLEX from
Dako. This system applies a mixture of primary antibodies of mouse and rabbit origin, followed by a mixture of the secondary goat-anti-mouse and goat-anti-rabbit antibodies labeled with HRP and AP, respectively. Finally, the chromo-gens are applied sequentially. The result is a double stain where the primary mouse antibodies are stained brown with DAB and the primary rabbit antibodies are stained red with Permanent Red (for an example, see Figure 6.8). The sys-tem has been developed for Dako’s line of RTU cocktails of primary antibodies, but may also be used with other anti-body cocktails or individual antibodies that are sequentially incubated on a single slide.
Multi-step technique
This is an indirect/direct method combining unlabeled primary antibodies with directly-conjugated antibodies (3). The meth-od starts with staining of the unlabeled antibmeth-ody/antibmeth-odies with the appropriate detection system, but without performing the final enzymatic staining reaction. The tissue is blocked with normal serum from the host of the first primary antibody before the second, directly-labeled primary antibody is add-ed. The staining ends with the two enzymatic reactions being performed sequentially.
Multi-step staining can be used when the selection of primary antibodies is limited. However, when using this method it is not possible to mix reagents. Users will often find that the choice of staining method is limited by the availability of the primary antibodies with respect to species origin or label.
Difficulties arise when targets are known or suspected to be co-lo-calized, and the only available primary antibodies are unlabeled monoclonal mouse antibodies of the same IgG subclass. In that case, none of the techniques described above are applicable. One solution for such circumstance is the Dako Animal Research Kit (ARK™), which contains reagents for labeling mouse prima-ry antibodies with a biotinylated anti-mouse Fab fragment, fol-lowed by blocking of the remaining reagent with normal mouse serum. This approach can be applied to the tissue as part of the multi-step technique (21). The kit uses a non-covalently labeled antibody, thus avoiding the risk of reducing affinity. In addition, only small amounts of primary antibody are needed and the kit does not require time-consuming purification steps.
Another solution is Zenon Technology (Invitrogen) developed for flow cytometry. It essentially uses the same technique and offers la-beling kits for mouse primary antibodies, available as enzyme con-jugates or conjugated to one of a wide variety of fluorescent dyes.
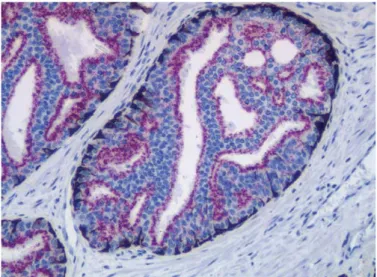
Figure 6.8 Simultaneous double staining performed with EnVisionTM
DuoFLEX using an antibody cocktail containing monoclonal rabbit anti-AMACR (red), monoclonal mouse anti-HMWCK and monoclonal mouse anti-CK 5/6 (brown/black). FFPE tissue sections from prostate.
Finally, it is important to be aware of the fact that visualization systems with dual recognition such as the EnVision™+ Dual Link system do not discriminate between species, and thus are only suitable for multiple staining when using the sequential method. Visualization kits with amplification layers that are not clearly specified should be avoided, since possible cross-re-activity cannot be predicted.
The primary choice to make when deciding how to make the targets visible is whether to use immunoenzyme staining or flu-orescence. Both have advantages and disadvantages and in the end, decisions should be made based on conditions of the individual experiment.
Chromogenic Dyes
When selecting color combinations for multiple staining with chro-mogenic dyes, it is advisable to choose opposing colors in the color spectrum such as red and green to facilitate spectral differ-entiation. If using a counterstain, this color must also be included in the considerations. When working with co-localized targets, dyes must be chosen so that it is possible to distinguish the mixed
color, from each individual color. Double staining using chromo-genic dyes is well-established, but if the targets are co-localized then a percentage of the single colors cannot be easily identified. For triple staining, it is naturally more difficult to choose colors that can be unambiguously differentiated, and even more so if targets are co-localized. In such cases, a technique known as spectral imaging may be applied (18,19). Spectral imaging allows images of the single stains to be scanned and by using specialized soft-ware algorithms the colors are unmixed, thereby displaying the distribution and abundance of the individual chromogens.
Visualizing Low Expressed Targets
A narrow dynamic range is a disadvantage for immunoenzymatic staining. The precipitation process, which is crucial for this meth-od, is only triggered at a certain threshold concentration of sub-strate and product. On the other hand, at high concentrations the precipitated product may inhibit further reaction. Therefore, it is difficult to visualize rare targets and highly abundant targets in the same slide. To ease this problem, catalyzed signal amplification - an extremely sensitive IHC staining procedure can be used (Fig-ures 6.5 and 6.6). The method can bring low expressed targets within the same dynamic range as high expressed targets.
Fluorescent Dyes
Double immunofluorescence labeling is quite well estab-lished (22). Some of the same considerations as for chromo-genic dyes apply when working with immunofluorescence. It is equally necessary to select dyes with distinguishable spectral properties. However, there are more colors availa-ble and the emissions spectra of the fluorescent molecules are narrower than the spectra of the chromogenic dyes. It is possible to have more stains on one slide with fluorescent dyes than it is with chromogenic dyes, which is one of the main advantages of fluorescent dyes in multistaining. The use of multiple fluorescent colors is also well established in FISH and flow cytometry. When using fluorescence dichro-ic excitation/emission, filters are employed to separate the different fluorescent signals. The spectral separation can be aided by digital compensation for overlapping emission spectra. In addition, new fluorescence microscope systems can separate the spectral signatures of up to eight fluoro-chromes without any problems, using multi-spectral imaging techniques such as emission fingerprinting (23).
Chapter 6.8
Selection of Dyes
Table 6.2 Examples of enzyme/chromogen pairs suitable for triple staining.
Enzyme Chromogen Color
Gal X-Gal Turquoise
AP Fast Blue BB Blue
HRP AEC Red
HRP DAB Brown
Gal X-Gal Turquoise
AP Liquid Fast Red Red
HRP DAB Brown
AP New Fucsin Red
HRP TMB Green
Gal (beta-galactosidase); X-Gal (5-bromo-4-chloro-3-indolyl β -galac-toside); AP (alkaline phosphatase); HRP (horseradish peroxidase); AEC (3-amino-9-ethylcarbazole); DAB (3,3’-diaminobenzidine); TMB (3,3′,5,5′-tetramethylbenzidine)
When staining co-localized targets, fluorescent dyes may al-low separate identification of targets. This makes it possible to discern targets even in very different concentrations, whereas subtly mixed colors from chromogenic dyes may easily pass unnoticed with immunoenzyme staining.
Thus immunofluorescence has some advantages, but there are also inherent problems; mainly loss of morphologic detail, which may determine the choice technique for a multi-stain-ing application.
Alternative dyes
Alternatives to the conventional chromogenic dyes are colloidal gold-labeled antibodies that can be used with bright field micros-copy, with silver enhancement, Green Fluorescent Proteins (GFP and their variants), and Quantum dots. The latter, especially, has been found to be superior to traditional organic dyes on several counts, such as brightness (owing to the high-quantum yield), as well as their higher stability (owing to less photodestruction). They can be linked to antibodies or streptavidin as an alternative to fluorochromes (24). However, the size of these conjugates poses problems of steric interference and diffusion, in terms of getting these inorganic particles into cells or organelles.
Digital image analysis will increase the number of usable dyes because it does not rely on the human eye for detection and differentiation. A digital image is acquired at excitation wave-lengths relevant for the dyes applied, and separate detectors re-cord individual colors. Thus, digital image analysis will allow the combination of both fluorescent and immunoenzyme dyes (25). Detectors, however, have biased color vision. They amplify colors differently than does the human eye. Therefore, dyes used in image analysis should be optimized for the best fit pos-sible with the detector’s filter properties.
Image analysis systems incorporate algorithms that allow compensation for overlapping emission spectra, comparable to flow cytometry. They also allow signal gating within a range of wavelengths of interest, enabling users to see only signals
within the desired range. Visualizing a combination of several gates, with the color selected independently of the dyes used for staining, may clarify pictures and facilitate interpretation. This capability also makes it possible to set a threshold on sig-nal intensity, to exclude non-specific staining or background staining from final images. A more thorough discussion of im-age acquisition and analysis can be found in Chapter 7.
Immunofluorescence (IF) is a common laboratory technique used in almost all aspects of biology. This technique, based on pioneering work by Coons and Kaplan (26, 27), and later by Osborne (28), has been widely both in research and clinical diagnostics. Applications include the evaluation of cells in sus-pension, cultured cells, frozen tissue, FFPE tissue, beads, and microarrays for the detection of specific proteins. In IF tech-niques, antibodies are chemically conjugated to fluorescent dyes such as fluorescein isothiocyanate (FITC) or tetramethyl rhodamine isothiocyanate (TRITC). As in the enzymatic meth-ods these labeled antibodies can be use directly or indirectly to bind to the antigen of interest, which allows for antigen de-tection through fluorescence techniques. The degree of fluo-rescence can then be quantified using a flow cytometer, array scanner, or automated imaging instrument, or visualized using fluorescence or confocal microscopy. IF techniques can be used on both fresh and fixed tissue samples, though the latter present problems of autofluorescence.
Chapter 6.9
Automated Image Acquisition and
Analysis in Multiple Staining
Chapter 6.10
Immunofluorescence
Table 6.3 Advantages and disadvantages of direct and indirect immu-nofluorescence.
Direct Immunofluorescence Indirect Immunofluorescence
Pros Simpler Higher signal (amplified)
Antibodies from the same species
Flexibility (array of fluorescent colored secondary antibodies) Low costs
Cons Lower signal More steps
Higher costs Antibodies from the same species cannot be used together
Principle of Fluorescence
Fluorescence and phosphorescence are both types of lu-minescence. When molecules with luminescent properties absorb light, they emit light of a different wavelength. With fluorescence the emission of light occurs extremely rapidly after the absorption of excitation light, whereas with phospho-rescence emission continues for milliseconds to minutes after the energy source has been removed. Fluorescent materials give off light because of their atomic structure. Electrons are arranged in discrete energy levels surrounding the atom’s nu-cleus, with each level having a predetermined amount of en-ergy. When an electron absorbs the energy from a photon of light (Figure 6.10) it becomes ‘excited’ and jumps to a higher, less stable, energy level. The excited state does not last long. The half-life of the excited state is generally less than 10 sec-onds. The electron loses a small amount of energy as heat, and the remainder of the extra energy is given off in the form of a photon. The emitted fluorescence has a lower energy than the absorbed light, so the wavelength of the emitted light is longer than that of the excitation light.
A range of wavelengths of light can excite the electrons of a fluorochrome. For example, fluorescein will fluoresce when hit by light with any wavelength between 450 nm and 520 nm. However, the closer the excitation wavelength is to 495 nm, the
Figure 6.9 Cultured pulmonary artery endothelial cells stained for tubulin (red), actin (green) and DNA (blue). The dual immunofluorescence pro-cedure used rabbit-anti-actin and mouse-anti-alpha tubulin as primary antibodies. The secondary antibodies used were Texas Red-conjugated goat, anti-rabbit IgG and FITC-conjugated goat, anti-mouse IgG. The sample was also stained with the DNA-specific dye Hoechst 33342. Scale bar is equal to 20 microns.
Figure 6.10 Principle of fluorescence.
Low energy High energy Excitation
by external light source
Molecule goes into higher energy state
Excitation decay energy (heat) lost towards semi-stable state
Light emission
when the molecule goes back to ground state
more fluorescence will be produced. This optimal wavelength is called the excitation peak. Similarly, the light produced by fluorochromes has a range of wavelengths. The emission of light from fluorescein ranges from 490 nm to 630 nm, and the emission peak is approximately 515 nm. Since the phenome-non of fluorescence was first explained in 1852 by a British sci-entist, Sir George Stokes, the shift in wavelength from short to long during fluorescence is called “Stokes shift” (Figure 6.11). Some fluorochromes have a small Stokes shift, while other flu-orescent compounds have large Stokes shifts. For example, the fluorochrome fluorescein can be excited by blue-green light, and its Stokes shift is only about 20 nm, which means that the light emitted is green. This contrasts with another flu-orochrome, phycoerythrin, which also can be excited by blue-green light, but has a large Stokes shift and thus the light will be emitted in a different color (yellow).
Photobleaching
As with most fluorescence-based techniques, a significant
prob-lem with immunofluorescence is photobleaching. Photobleaching is when the fluorophore looses its ability to fluoresce. This pho-tochemical destruction is due to the generation of reactive ox-ygen species in the specimen as a byproduct of fluorescence excitation (Figure 6.12). Photobleaching can be minimized by: (a) decreasing the excitation light in both intensity and duration, (b) reducing the availability of singlet oxygen (1O
2) by the addition of
singlet oxygen scavengers (= antifade reagents), and (c) using a low concentration of a fluorochrome with high-quantum efficiency.
Autofluorescence
Biological autofluorescence in mammalian cells due to flavin coenzymes (FAD and FMN: absorption, 450 nm; emission, 515 nm) and reduced pyridine nucleotides (NADH: absorption, 340 nm; emission, 460 nm) can be problematic in the detection of fluorescence probes in tissues and cells. Fixation with al-dehydes, particularly glutaraldehyde, can result in high levels of autofluorescence. This can be minimized in fixed cells by washing with 0.1% sodium borohydride in phosphate-buff-ered saline (29) prior to antibody incubation. Problems due to
Figure 6.11 Excitation and emission spectrum of fluorescein. When flu-orescein is excited at a wavelength other than its peak excitation (470 nm in this example), the shape of the emission curve (darker green) remains the same, but the relative intensity is reduced. The efficiency of the excitation at 470 nm is 45% of peak excitation.
Peak FITC emision, 520 nm
Actual FITC emision, 520 nm Peak FITC excitation, 495 nm
Stroke shift Excitation source, 470 nm Intensity (%) 400 425 450 475 500 525 550 575 600 625 650 675 700 100 80 60 40 20 0 Wavelength (nm)
Figure 6.12 Illustration of how a singlet-excited state can convert to a triplet-excited state. Photobleaching is the irreversible decomposi-tion of the fluorescent molecules in the exited state because of their interaction with molecular oxygen prior to emission.
Ground energy state
S
3S
2S
1S
0T
1 Energy Phophoresence Intersystem crossingGreen fluorescence emission Absorption (blue)
autofluorescence can be minimized by selecting probes and optical filters that maximize the fluorescence signal relative to the autofluorescence. Other factors that limit IF include the performance of the detection instrument (i.e. how well the mi-croscope has been calibrated and set), the specificity of the antibodies, and the specimen preparation.
Fluorescence Overlap
One of the problems that must be dealt with when measuring fluorescence of more than one color is the possibility that the emission signals overlap. It is necessary to remove the over-lapping signal or it will give a false level for one or more colors. For example, as shown in figure 6.14, there is significant over-lap when using FITC and PE. A range of wavelengths will be collected for each detection channel. In the figure, these are identified as the FITC detector bandwidth and the PE detector bandwidth. These band-pass optical filters will allow photons within this wavelength range to reach the detector. However, as can be seen in Figure 6.14, there is a very small amount of PE fluorescence, which is within the FITC band, and similarly a
small amount of FITC fluorescence within the PE band. These unwanted signals must be electronically removed or the meas-urement for each detector will overestimate the actual signal. This process is called fluorescence compensation and can be automatically calculated in many detection systems using sin-gle positive controls.
Applications of IF in Pathology
Some practical applications of IF in diagnostic pathology are:
Analysis of protein antigens in fresh, frozen or, less often, fixed tissues; sub-cellular localization of protein antigens in tissue culture monolayers; and observation of bacterial or parasitic organisms. Immunofluorescence is primarily used in the research setting, or in clinical research setting, on frozen tissue. In particular where antibodies compatible with formalin fixation and paraffin embedding have not been developed.
A major practical use is for fluorescence in situ hybri- dization (FISH), fluorescent labeled DNA is used to detect gene aberrations in cells.
Figure 6.13 NADH autofluorescence in a human colon carcinoma cell line (HCT116). Ultra-violet excitation at 363 nm was used and the emitted flu-orescence greater than 440 nm was collected. Scale bar is 10 microns. Courtesy of Giselle M. Knudsen, Department of Medicinal Chemistry and Molecular Pharmacology, Purdue University, West Lafayette, IN, USA.
Figure 6.14 Fluorescence overlap of FITC and PE.
Intensity (%) 100 80 60 40 20 0 Wavelength (nm) Excitation source FITC detector bandwidth PE detector bandwidth 400 425 450 475 500 525 550 575 600 625 650 675 700 PE emision FITC emision Overlap
Immunofluorescence potentially has a wider dynamic ran- ge than immunoenzyme staining, as there is no enzymatic amplification involved and thus the dynamic range is de- termined solely by the sensitivity of the detectors (25). Quantitative immunofluorescence staining coupled with digital scanning of slides and image analysis algorithms have been utilized to create an automated quantitative im- munofluorescence technique which has been applied in various studies (30).
Multi-staining (see multi-staining section)
Visualization of cell structures by super resolution microscopy
The IHC technique continues to undergo evolution and im-provement, driven by ongoing demands of reproducibility, sen-sitivity and quantification. Today, automated systems enable standardized visualization of targets in tissue with increased sensitivity and improved signal to background ratio. Chromo-gen, fluorescence and multistain technologies are being em-ployed. Increasingly, stained slides are submitted for digital scanning and signals quantified using image analysis algo-rithms. The demand for more information from each slide, to conserve available tissue, will inevitably lead to increasing use of multistaining technologies in the pathology laboratories. In addition, targeted therapies have created a need for more quantitative biomarker information, launching a rapidly growing range of new types of IHC tests, variously termed ‘prognostic markers’, ‘predictive markers’, ‘companion diagnostics’ or ‘ad-vanced personalized diagnostics’ (Chapter 11). Thus, future IHC-based tests will increasingly rely upon standardized, ap-proved kits and reagents, in combination with an automated im-age analysis system for the evolution into quantitative pathology.
Acknowledgements
Sections, in whole or parts thereof, from the previous editions of this Guidebook are used in the 6th edition. We sincerely thank and acknowledge the contribution of the authors. Special ac-knowledgements to: Mark Key, J. Paul Robinson, Jennifer Sturgis, George L. Kumar, Nanna K. Kristensen and Lars Winther.
Chapter 6.11
Future Perspectives
1. Coons A, Creech HJ, Jones RN. Immunological properties of an antibody containing a fluorescent group. Proc Soc Exp Biol Med 1941;47: 200-2.; Coons A, et al. J Immunol 1942; 45, 159-170. 2. Graham R, Karnovsky M. The early stages of absorption of injected
horseradish peroxidase in the proximal tubules of mouse kidney: Ultrastructural cytochemistry by a new technique. J Histochem Cytochem 1966; 14: 291-302.
3. Nakane PK. Simultaneous localization of multiple tissue antigens using the peroxidase labeled antibody method: A study of pituitary glands of the rat. J Histochem Cytochem 1968;16:557-60. 4. Taylor CR, Burns J. The demonstration of plasma cells and other immunoglobulin- containing cells in formalin-fixed, paraffin-em- bedded tissues using peroxidase-labelled antibody. J Clin Pathol 1974; 27:14-20.
5. Taylor CR, Mason DY. The Immunohistological detection of intra cellular immunoglobulin in formalin-paraffin sections from multiple myeloma and related conditions using the immunoperoxidase
technique. Clin Exp Immunol 1974; 18:417-29.
6. Mason TE, Phifer, RF, Spicer SS. An immunoglobulin-enzyme bridge method for localizing tissue antigens. J Histochem Cyto- chem 1969;17:563-9.
7. Sternberger LA, Hardy PH Jr., Cuculis JJ, Meyer HG. The unla- beled antibody-enzyme method of immunohistochemistry. Prepa- ration and properties of soluble antigen-antibody complex (horse- radish peroxidase-antihorse-radish peroxidase) and its use in
identification of spirochetes. J Histochem Cytochem 1970;18:315. 8. Hsu SM, Raine L, and Fanger H. Use of avidin-biotin peroxidase
complex (ABC) in immunoperoxidase techniques: a comparison between ABC and unlabeled antibody (PAP) procedures. J Histo- chem Cytochem 1981;29:577-80.
9. Heras A, Roach CM, Key ME. Enhanced polymer detection system for immunohistochemistry. Lab Invest 1995;72:165 (Abstract). 10. Chilosi M, Lestani M, Pedron S, Montagna L, Benedetti A, Pizzolo
G, et al. A rapid immunostaining method for frozen sections. Bio- tech Histochem 1994;69:235.
11. Sabattini E, Bisgaard K, Ascani S, Poggi S, Piccioli M, Ceccarelli C. The EnVision™ system: a new immunohistochemical method
for diagnostics and research. Critical comparison with the APAAP, ChemMateTM, CSA, LABC, and SABC techniques. J Clin Pathol 1998;51:506-11.
12. Gross AJ, Sizer IW. The oxidation of tyramine, tyrosine, and related compounds by peroxidase. J Biol Chem 1959;234:1622-1614. 13. Bobrow MN, Harris TD, Shaughnessy KJ, Litt GJ. Catalyzed re
porter deposition, a novel method of signal amplification. Applica- tion to immunoassays. J Immunol Methods 1989;125:279-285. References
14. Adams JC. Biotin amplification of biotin and horseradish peroxi- dase signals in histochemical stains. J Histochem Cytochem 1992;40:1457-63.
15. Merz H, Malisius R, Mann-Weiler S, Zhjow R, Hartmann W, Or scheschek K, Moubayed P, Feller AC. Methods in laboratory in vestigation immunoMax. A maximized immunohistochemical me- thod for the retrieval and enhancement of hidden antigens. Lab Invest 1995;73:149-56.
16. Molinie V, Fromont G, Sibony M, Vieillefond A, Vassiliu V, Cochand-Priollet B, et al. Diagnostic utility of a p63/alpha-methyl- CoA-racemase (p504s) cocktail in atypical foci in the prostate. Mod Path 2004; 17:1180-90.
17. Taylor CR, Levenson RM. Quantification of Immunohistochemistry – issues concerning methods, utility and semiquantitative as-
sessment. Histopathol 2006; 49:411-424.
18. van der Loos CM. Multiple immunoenzyme staining: methods and visualizations for the observation with spectral imaging. J Histo- chem Cytochem 2008; 56:313-28.
19. Van der Loos CM. Immunoenzyme Multiple Staining Methods: BIOS Scientific Ltd.; 1999.
20. Chaubert P, Bertholet MM, Correvon M, Laurini S, Bosman FT. Si multaneous double immunoenzymatic labeling: a new procedure for the histopathologic routine. Mod Path 1997; 10:585-91. 21. van der Loos CM, Gobel H. The animal research kit (ARK) can be
used in a multistep double staining method for human tissue speci- mens. J Histochem Cytochem 2000;48:1431-8.
22. Mason DY, Micklem K, Jones M. Double immunofluorescence labelling of routinely processed paraffin sections. J Pathology 2000;191:452-61.
23. Dickinson ME, Bearman G, Tille S, Lansford R, Fraser SE. Multi- spectral imaging and linear unmixing add a whole new dimension to laser scanning fluorescence microscopy. BioTechn 2001; 31:1272-8. 24. Wu X, Liu H, Liu J, Haley KN, Treadway JA, Larson JP, et al. Immu
nofluorescent labeling of cancer marker Her2 and other cellular targets with semiconductor quantum dots. Nat Biotech 2003; 21:41-6. 25. Jubb AM, Landon TH, Burwick J, Pham TQ, Frantz GD, Cairns B, et al. Quantitative analysis of colorectal tissue microarrays by im munofluorescence and in situ hybridization. J Pathol 2003; 200:577-88. 26. Coons AH ea. Proc Soc Exp Biol Med 1941;47:200-2.
27. Coons AH and Kaplan MH. Localization of antigen in tissue cells. II. Improvements in a method for the detection of antigen by means of fluorescent antibody. J Exp Med 1950; 91:1-13.
28. Weber K, Bibring T, Osborn M. Specific visualization of tubulin- containing structures in tissue culture cells by immunofluores- cence. Cytoplasmic microtubules, vinblastine-induced paracrys- tals, and mitotic figures. Exp Cell Res 1975; 95:111-20.
29. Bacallao R, Sohrab S, Phillips C. Guiding Principles of Specimen Preservation for Confocal Fluorescence Microscopy. In: Pawley JB, editor. Handbook Of Biological Confocal Microscopy: Springer US; 2006. p. 368-80.
30. Camp RL, Chung GG, Rimm DL. Automated subcellular localiza- tion and quantification of protein expression in tissue microarrays. Nat Med 2002; 8:1323-8.