SAP Enterprise Data Warehouse
for Point of Sales Data Optimized
for IBM DB2 for Linux, UNIX, and
Windows on IBM Power Systems
Applies to:
SAP Retail, SAP NetWeaver BW 7.3
Summary
This article provides an overview of the optimizations for SAP Retail and SAP NetWeaver
BW regarding efficient data management and processing of large Point of Sales (POS)
data volumes on the parallel database IBM DB2 for Linux, UNIX, and Windows (in the
following referred to as DB2 for LUW) on IBM POWER7 servers. Real-time processing of
POS data is today’s business challenge. With a large proof of concept (PoC), we show
how you can achieve these business demands using DB2 for LUW on a mid-range IBM
POWER7 server. In addition, this document provides information about the valuable DB2
and POWER7 features that are used to achieve excellent performance results. We also
provide best practices and recommendations on how to run a large SAP EDW system for
POS data most efficiently on DB2 for LUW on POWER7.
Authors: Brigitte Bläser (IBM) Karl Fleckenstein (IBM) Stefan Hoffmann (SAP)
Oliver Schall (SAP) Olaf Rutz (IBM)
Company: SAP AG, IBM Germany Research & Development GmbH
Author Bio
Brigitte Bläser is a senior software engineer at IBM Deutschland Research & Development GmbH in Böblingen. She is a member of the joint IBM/SAP development team that enables SAP applications for DB2 for Linux, UNIX and Windows and is responsible for integrating DB2 for LUW solutions into SAP NetWeaver BW.
Karl Fleckenstein is a Senior Technical Staff Member and the lead architect in the SAP/IBM DB2 for LUW development team. He is responsible for DB2 for LUW solutions within SAP NetWeaver applications. Karl joined IBM 1990 and worked as software engineer in several database related projects. He has more than 20 years of experience with DB2 and more than 13 years of experience with SAP basis and SAP NetWeaver BW technology. Karl is a frequent speaker at IBM's and SAP's technical conferences and has published various technical white papers with SAP/DB2 for LUW solutions. He is a member of the IBM German Technical Expert Council (TEC).
Dr. Stefan Hoffmann is a Principal Technology Consultant and Head of the In-Memory
Innovation Center for Retail in St. Ingbert / Germany. He is based in Germany and his role is to advice internal and external customer in the architecture of In Memory based solutions for Trade Industry customers. Stefan joined SAP in 1998 and started as software engineer in the development team of SAP Business Warehouse. After 4 years within software development he changed role to SAP consulting and worked as a technical consultant in several projects. He has more than 10 years of experience with SAP basis and SAP BI technology.
Dr. Oliver Schall is a Technology Expert Consultant in the Global Retail Hub located in St. Ingbert / Germany. He is specialized in In-Memory technology as well as SAP basis, SAP BI technology and SAP Enterprise Portal. Before joining SAP in 2008, Oliver worked as a researcher at the Max Planck Institute for Computer Science and published several papers in international journals and gave presentations at renowned conferences.
Olaf Rutz is a senior software engineer at IBM Deutschland Research & Development GmbH in Böblingen. He is the technical team lead of the SAP on AIX team and has more than 15 years experience working with SAP on IBM System z, i and, p platforms.
Table of Contents
Introduction ... 5
Enterprise Data Warehouse Solutions for POS Data ... 6
General... 6
POS Inbound Processing Engine (PIPE) ... 7
POS Analytics ... 8
Layered Scalable Architecture ... 8
Terminology ... 9
Service Offering ... 11
Innovative Features Used ... 12
Features of DB2 for LUW ... 12
Database Partitioning Feature (DPF) ... 12
Multidimensional Clustering (MDC) ... 13
Data and Index Compression ... 15
Compression of Temporary Tables ... 16
Automatic Statistics Collection and Real-Time Statistics ... 16
Automatic Storage Management ... 16
DB2 Specific Near-Line Storage (NLS) Solution ... 17
Features in SAP NetWeaver BW 7.3 ... 18
MPP-Optimized DSO Data Activation ... 18
Parallel Data Extraction from Write-Optimized and Standard DSOs ... 18
IBM Power Systems Features ... 18
POWER7 ... 18
Active Memory Expansion (AME) ... 19
Test Environment ... 21
Hardware Setup ... 21
SAP System Setup ... 22
Test Scenarios ... 24
Results 26 ETL Performance Evaluation ... 26
NLS Performance Evaluation ... 31
NLS: Data Archiving Tests ... 32
NLS Query Performance Tests ... 33
POWER7 AME Tests ... 35
POWER7 AME Activation for the SAP Application Server LPAR ... 35
Best Practices ... 37
SAP Configuration for AIX ... 37
Active Memory Expansion Planning and Advisory Tool ... 37
DB2 for LUW ... 38 Summary... 40 Appendix ... 41 List of Abbreviations ... 41 DB2 Configuration Details ... 41 DB2 Registry ... 41
Database Manager Configuration ... 42 Database Configuration ... 44 Bufferpools (KB) ... 48 Table of Figures ... 49 List of Tables ... 49 Related Content ... 50 Copyright... 51
Introduction
Efficient data management and processing of large POS data volumes has become more and more important for the business success of large retail companies.
Current business challenges require a fast data consolidation and data cleansing of POS data and providing the POS data up to the reporting layer in a timely manner to allow querying of operational data in real-time. This document describes why the combination of IBM Power Systems™, AIX®, DB2® for LUW, SAP NetWeaver Business Warehouse (SAP NetWeaver BW), and the SAP Retail application provides an excellent response to these demands. It is proven that a large POS data volume of eight billion records can very efficiently be processed on an SAP NetWeaver BW system on DB2 for LUW with a mid-range POWER7 server.
In addition, information about SAP’s Enterprise Data Warehouse solution for POS data is also provided in this document.
Especially the optimizations for SAP Retail and SAP NetWeaver BW that use the parallel database feature of DB2 for LUW are the key for fast data processing of POS data. In addition, the new POWER7 feature
Advanced Memory Expansion significantly reduces physical memory requirements of the SAP application servers and the database server. The chapter “Innovative Features Used” provides an overview of these optimizations and the DB2 features, such as, database partitioning, multi-dimensional clustering, automatic storage management, compression and the DB2-specific near-line storage (NLS) solution.
In chapter “Test Environment”, the hardware and system setup, and the test scenarios used in this PoC are described. Chapter “Results” provides a detailed description of the test results, and in chapter “Best
Practices” you find best practices for the optimal setup of an SAP Retail POS data management system on DB2 for LUW, IBM POWER7, and AIX.
Enterprise Data Warehouse Solutions for POS Data
GeneralFor many organizations, POS data is scattered across the enterprise in multiple systems and applications. The result is data fragmentation and information redundancy, which makes a thorough analysis of your business very hard to do. Today, these challenges prevent organizations from achieving goals, such as:
Producing holistic reports in a timely manner Querying operational data in real-time
Ensuring that reports contain the most accurate and up-to-date information
More and more customers are looking for a central platform that acts as entry for POS data into their organization.
For many years, SAP has been offering the POS Data Management solution (SAP POS DM) to Trade Industry customers. SAP POS DM is a packaged solution that can be installed as a standalone application. It acts as a data hub for POS data in an organization or you can install it as part of SAP Enterprise Data Warehouse.
POS DM provides a single point of entry for sales data from various distribution channels, including web sales, via standard interfaces.
POS DM is able to load intraday sales data and provides services for loading intraday sales data deltas to SAP ERP Retail since SAP ECC6.0 EHP2. SAP ECC supports near real-time stock and inventory counts during opening hours.
The sales data in POS DM can also be transferred to non-SAP systems. Thus customers can use POS DM as a single central system for the entry and validation of sales data and for the distribution of the data to all targets that require the sales data. POS DM offers the following functions and features:
Data cleansing
Very often data quality is an issue. Since POS DM is cleansing the POS data using already cleansed master data from SAP NetWeaver BW, it is ensured that all other systems which receive that data use the same data basis. Since this also includes POS Analytics, it is ensured that real-time data is cleansed in the same way as historical data. This procedure leads to accurate data and is SAP’s answer to ‘one version of the truth’.
Real-time reporting
In today’s business, the overall success is determined by the ability to query in real-time what is happening in the store. Only few applications offer such possibilities. SAP POS DM allows fast loading of cleansed data in the data warehouse environment, which ensures reports to have the most accurate and up-to-date information. Standard interfaces allow direct access to data that is not (yet) loaded into the reporting layer which shortens the latency time between data in the data warehouse and data in the operational layer.
Trickle feed
Customers need to query operational data in real-time. This requires an architecture that provides fast data provisioning techniques and allows trickle feed scenarios. Since the POS Inbound Processing Engine (PIPE) part within POS DM is able to forward data immediately to requesting systems, a trickle feed into SAP NetWeaver BW is easy to establish. Assuming that a customer requires near-real time POS data in the data warehouse, the simplest approach is to continuously feed the BW system with new data from the POS system and insert the new data into separate InfoCube fact tables. With the modeling and scheduling tools within SAP NetWeaver BW, a customer can establish such a process without any additional change in their landscape.
Increasing numbers of information consumers need to query on transactional level. Since the data volume they have to access can be tremendously high, the architecture has to provide mechanisms that allow access on such a granularity with stable response times.
Ad-Hoc query
Due to the high granularity of data, it is often impossible to offer ad-hoc query capabilities to a larger number of users because those unpredictable queries cannot be optimized in advance. The runtime problems that are related to this type of queries often lead to the fact that customer do not allow end users to access this layer of granularity. With POS DM in combination with Business Warehouse Accelerator (BWA), a larger number of users can access this layer of granularity with a stable response time and an easy-to-use user interface.
Due to the high granularity of POS data, it is often required to use aggregation levels in reporting to be able to query the data. To build these aggregation levels is time consuming and prolongs the time to process POS data. Within POS DM, there are several options to shorten these processing times. With BWA in place, there is no need any longer for those aggregation levels, which leads to very short processing times.
Product affinity (basket analysis)
To get a better insight into the shopping behavior of customers, organizations need to be able to analyze the POS data on a transactional level. POS DM provides with product affinity metrics a solution that is embedded into the BWA. Product affinity metrics enable organizations to find product affinities that help them to run more efficient marketing campaigns and to optimize their assortment. Key benefits of the application for customers of the trade industry are as follows:
Complete POS data management solution in a stand-alone mode
Rapid implementation through best practices resulting in quicker return of investment (ROI) Enhanced performance through usage of in-memory technology
Extendable architecture for future product development Seamless links to existing SAP applications
Integration with non-SAP applications via SAP Business Objects Data Services or SAP Process Integration
Covers requirements beyond traditional retailing
Improved handling and controlling of POS inbound processing and analysis Support for trickle polling and intraday flash sales
Complete sales audit application included
The complete solution can be divided into two major applications:
POS Inbound Processing Engine (PIPE)
This application is used to process POS transactions in parallel into a centralized data hub. Within this architecture, the central container TLOG stores transactions from various POS systems and distributes them to systems in the organization that require POS data. SAP delivers standard interfaces and algorithms that you can use to check, cleans, aggregate, and distribute the data and to monitor the flow of the data to the systems in your landscape.
The PIPE provides a complete suite of functions for checking the correctness and for cleansing POS data (Sales Audit). Besides mass handling of POS transactions and reverse postings with monitoring capabilities, various analytical applications can be supplied on top of the central storage TLOG.
The integrated sales-audit functionality of the PIPE ensures that all data is accurate and complete. Since the PIPE has been built to be integrated with SAP NetWeaver BW, retail data is delivered directly to the heart of your company – there is no need to process the retail data in the merchandise management
system first. This improves the performance of all your IT systems and allows documents and relevant data to be used throughout your organization.
Seamless integration into existing SAP applications enables a fast ROI and offers a low TCO.
POS Analytics
SAP POS DM software improves decision making at all levels by gathering facts and figures from your retail outlets and making them available throughout your enterprise. It also provides standardized reports at the click of a mouse through a Web-based user interface, enabling Information consumers to access, explore, and analyze incoming sales information faster and more easily than ever before. In addition, POS analytics offers vital support for long-term strategic and operational decision making, which helps you capitalize on emerging business opportunities. The application is integrated directly with SAP Business Warehouse (SAP NetWeaver BW) software, allowing you to scrutinize the performance of your store from different
perspectives. It also links to a range of follow-on processes, such as inventory management, financials, billing, and credit-card settlement.
In addition, the application supports trickle polling, giving your planners an up-to-the-minute picture of everyday’s activities. This approach reduces strain on other systems, such as merchandise management, that often work through the night processing mission-critical data.
A predefined Enterprise Data Warehouse (EDW) model accelerates implementation and maximizes return on investment (ROI). The application comes ready-to-run, with POS processing and analytics features that are tailored to a variety of standard roles. These standard roles range from store managers to replenishment planners.
The implemented EDW model follows the methodology of layered scalable architectures and provides a complete, robust architecture that covers the needs of all size retailers in regards to POS reporting.
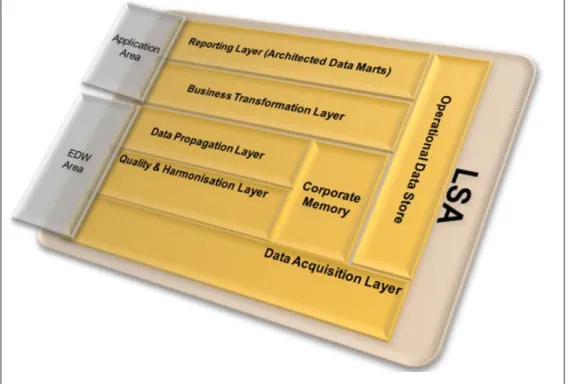
Layered Scalable Architecture
The layered scalable architecture of the underlying EDW model (see Figure 1) can be divided into the following main areas:
Application Area:
Persistence layer for business driven transformations
In the application area, business departments find the data targets that reflect their given business requirements for an analytical application. Sometimes, these applications are also called architected data marts.
EDW Area:
No business driven transformations; only integration transformations & cleansing based on common definitions and delivering reusable parts (Single Point of Truth)
Each area is divided in sub areas (layers) that support specific functions.
Parallel processing in the database (as available with DB2) is an important feature to achieve the real time POS DM requirements and good performance for the Extract/Transform/Load (ETL) processing within the layered scalable architecture.
Terminology
The following terminology is used in this document to describe the components of the LSA.
Data Domains
Refers to the logical or semantic grouping of data into separate objects that have been implemented to enhance loading stability (activation parallelization, object contention, and so on) and query performance, and so on.
Domains are always based on the source system and are grouped according to region or time-zone.
Layers
Refers to the sub-division of the LSA areas according to their functions, rules, and restrictions. The LSA is divided into the following layers:
Data Acquisition Layer
The data acquisition layer has the task to quickly accept the extracted records from the source and to distribute them further. It decouples the loads from the source systems from internal BW processing (spread workload). Therefore, you can extract data for a DataSource multiple times per day instead of fill specific BW applicationsonly once.
The acquisition layer is the earliest point in time where you can create multiple outbound data flows from a single inbound data flow and thus parallelize the BW processing.
Harmonization & Quality Layer
The harmonization & quality layer ensures the availability of the complete set of data in a cleansed and incorporated way.
Data Propagation Layer
The propagation layer is the EDW layer that is meant to provide digestible data for the application area. That is, data that is ready for consumption by BW applications.
The propagation layer is mandatory for all transactional data and does not reflect the domain concept of a layered scalable architecture. Instead of splitting this area into several sub-domains, all data coming from the various sources is routed through this object.
To achieve the best possible performance, a write-optimized DataStore Object (DSO) is used. Generally, the propagation layer provides all commonly-calculated figures that are relevant for all higher level cubes and DSOs.
The main benefit of the application layer is that it provides a persistent platform of data with the necessary calculations so that loading of applications is not delayed.
Corporate Memory
The data in the acquisition layer is not retained. To enable reloading of data independently of the source system, an additional layer is needed, which is the corporate memory. The corporate memory stores all fields delivered from the DataSource. Thus, the corporate memory is
comprehensive. Information is not aggregated. It is a write-optimized DSO and should be designed without a semantic key. All extracted records are stored. The corporate memory is historically complete.
It is not expected that any transformations - apart from 1:1 mappings, data splits or
concatenations - takes place that go into the corporate memory layer. Therefore, considerations about performance and time dependency of master data that is used in transformations are not important.
To simplify the selection of data that is required for reloading and recovery from corporate memory DSOs, the load date and request number must be loaded in delta update mode into all write-optimized corporate memory DSOs.Data is not deleted from corporate memory.
Corporate memory is used appropriately when a transformation in the data model is modified and data must be reloaded to reflect these changes, and no new fields are added from PIPE or the underlying POS system.
In case a reload of data into the business transformation layer (see next section) is required, data is read from the corporate memory objects and stored in the data propagation layer. From there, data is distributed into the various business transformation layer objects.
Business Transformation Layer
The business transformation layer is the first layer of the application area. It is a mandatory layer and it is used for complex application-specific business logic, such as the following:
Merging and joining (lookups) of data from different DataSources
Complex operations and lookups that fill additional characteristics and that are not delivered in the propagation layer increase the need for a dedicated persistency. Normally, this layer consists of standard DSOs. However, there are exceptions where a write-optimized DSO can be used to optimize load performance or support persistency. For example, this is the case when you merge several high data volume standard DSOs from the propagation layer via full loads.
The rational for placing a DSO in the transformation layer or the propagation layer is the
application specificity of the transformations and the reusability of the result. For example, if one DataSource can be used by many applications but only one application requires certain
transformations to take place, then these transformations should be performed in the
transformation layer. To be more precise: whenever the material information in the sales data must be enriched with assortment-specific information and the assortment enrichment is relevant for only one other area, it makes sense to enrich the data at the transformation layer.
Reporting Layer
The reporting layer comprises multidimensional InfoProviders that store data at the various aggregation levels depending on the requirements of the application. In exceptional cases, DSOs can also be used if, for example, only pure list reporting is required.
To achieve a highly flexible data model in terms of adding or removing InfoProviders to queries (which is also called logical partitioning), it is not allowed to do reporting directly on a basic InfoProvider but rather access InfoProviders using MultiProviders.
The reporting layer can be divided into different sub-categories, for example, high performance cubes (that are more aggregated) versus more detailed or granular cubes. Query performance is the key criteria to judge whether your InfoCube is correctly aggregated.
You should not attempt to provide all kinds of information for all users in a single cube. Instead, we recommend that you create multiple cubes that contain the same set of data but with different levels of detail.
Service Offering
SAP offers the Enterprise Data Warehouse Service for POS (EDW Service for POS) as a complete productized service (SAP SIL Service) to jump start a retailer’s POS data warehouse. Based on the latest SAP NetWeaver BW & EIM architecture, the EDW Service for POS delivers preconfigured data-models and an integration architecture to implement and operate a high-volume POS data warehouse.
The EDW Service for POS provides a POS Enterprise Data Warehouse data model in form of a transport package that you can install using the standard transport mechanism of SAP. Implementation of the
packaged solution into the customer’s BW system is jointly performed by SAP Consulting and the customer. During workshops, SAP consultants explain LSA principles like semantic partitioning and customize the customer system accordingly. An operational guide explains how to manage and operate the LSA EDW model.
Furthermore, knowledge transfer is performed by the consultants during introductory workshops regarding SAP NetWeaver BW Accelerator and SAP Business Objects Explorer.
The EDW Service for POS serves as reference architecture for SAP NetWeaver BW & EIM (classic SAP customer) and provides a best practice POS data model that covers the most common retail use cases for POS analytics as well as lean integration with SAP Business Objects front end tools.
SAP consultants transfer knowledge with regard to a high performance analytics setup using SAP Business Warehouse Accelerator and SAP Explorer Accelerated. In addition to the introduction of the LSA data model, the EDW Service for POS comes with comprehensive documentation material. SAP Consultants are
enabling the customer to run the data warehouse (DWH) by providing initial customer workshops. The EDW Service for POS is mainly based on the SAP POS Data Management solution that runs on the SAP NetWeaver BW platform. The data model can be integrated best if the customer already has the SAP POS Data Management solution, which is the strategic and state-of-the-art POS data collection and processing hub in combination with an EDW model of a Layered Scalable Architecture.
The service lowers the total costs of implementation dramatically, as the EDW data model is shipped as business content in its own namespace. Customers who are familiar with content activation could implement the solution themselves. In combination with the documentation, customers are able to implement the EDW for POS within a few days instead of a whole project cycle (which includes blueprinting, testing, and so on) Based on the EDW approach, the EDW Service for POS enables reporting down to receipt level and thus provides deep insight into shopping behavior.
By offering the EDW Service for POS for a fixed price, the service provides full control of implementation costs and offers the possibility to set a comprehensive data foundation for POS Analytics.
Innovative Features Used
This chapter describes the features of IBM DB2 for LUW, IBM Power Systems, and SAP NetWeaver BW 7.3 that are exploited to achieve a significant reduction of TCO, excellent performance and scalability, a
reduction of maintenance efforts, and a full data life-time support of this optimized POS DM on DB2 for LUW and IBM Power Systems solution.
Features of DB2 for LUW
Database Partitioning Feature (DPF)
The database partitioning feature (in the following referred to as DPF) allows the segmentation of a DB2 database into several database partitions that can be located on a single large Symmetric Multiprocessing (SMP) database server (scale-up) or on several smaller discrete servers (scale-out).
DPF follows the shared-nothing architecture. That is, each database partition is a part of the database and consists of its own data, indexes, configuration files, and transaction logs. Tables can be distributed automatically over several database partitions using a hash key that is defined when the table is created. Since data is distributed across database partitions, the throughput and bandwidth of many processors is aggregated and thus reduces the runtime of SQL access and database maintenance operations. Data retrieval and data manipulation requests are automatically decomposed into sub-requests, and executed in parallel on the database partitions where data resides. The fact that databases are split across database partitions is transparent to users issuing SQL statements.
DPF has the following advantages: Scalability options
o You can attach additional servers to provide support for growing data and user volumes
o Increased concurrent access to data for concurrently running applications or processes Excellent data access performance
Faster SQL access because the data can be processed in parallel on the database partitions on which it resides
Faster database maintenance operations:
o Operations such as table and index reorganization or index creation are faster because they are executed in parallel on the database partitions where the table or index is located. Collection of table or index statistics is faster because it is only executed on one database partition.
o Faster database backup and faster recovery because these functions run in parallel on all database partitions
TCO reduction:
Efficient usage of the hardware resources, that is, you start, for example, with a small database server and add another server later when the system is getting larger.
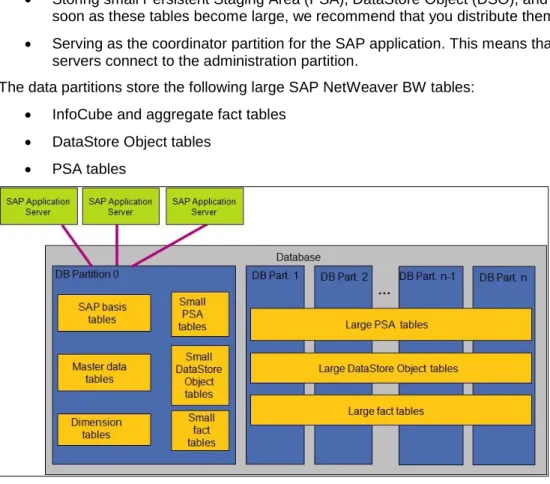
DPF has been supported in SAP NetWeaver BW as of SAP Business Information Warehouse 1.2. The DB2 database of an SAP NetWeaver BW system can be created as a multi-partition database consisting of an administration partition and several data partitions.
The administration partition performs the following tasks: Storing the DB2 system catalog
Storing SAP basis tables and the SAP NetWeaver BW management, master data, and dimension tables
Storing small Persistent Staging Area (PSA), DataStore Object (DSO), and InfoCube fact tables. As soon as these tables become large, we recommend that you distribute them over the data partitions. Serving as the coordinator partition for the SAP application. This means that the SAP application
servers connect to the administration partition.
The data partitions store the following large SAP NetWeaver BW tables: InfoCube and aggregate fact tables
DataStore Object tables PSA tables
Figure 2: Standard SAP NetWeaver BW Database Layout on DB2 for LUW
The creation and management of database partitions has been fully integrated into SAP tools such as the SAP installation tool SAPinst, the SAP DBA Cockpit, and the SAP Database Performance Warehouse. In this PoC, the DB2 database was created with the administration partition and seven data partitions. The tables of the DSOs and the fact tables of the InfoCubes of the layered scalable architecture for POS DM were distributed over the seven data partitions. All partitions were located in one AIX LPAR.
Multidimensional Clustering (MDC)
Multidimensional clustering (MDC) allows the clustering of the data in a table along one or more columns. The columns selected for clustering are called MDC dimensions. Records with the same values in the MDC dimension columns are stored physically together in blocks of pages. This means that MDC physically organizes data in a table into blocks according to the values in the clustering columns.
Figure 3: Multidimensional Clustering
In an MDC table, each unique combination of MDC dimension values forms a logical cell, which can physically consist of one or more blocks of pages. Each data page belongs to exactly one block, and all blocks consist of the same number of pages.
The size of a block is equal to the tablespace extent size so that block boundaries border on extent boundaries, which is beneficial for I/O operations. For DB2 databases in an SAP environment, the extent size is 2 by default, and the page size is 16 KB. Therefore, an MDC block is 32 KB in size.
The logical cell only has enough blocks associated with it to store the records having the dimension values of that logical cell. In case there are no records in the table that have the dimension values of a particular logical cell, no blocks are allocated for that logical cell.
MDC introduces block-based indexes. These indexes are much smaller than regular record-based indexes because the block indexes point to MDC blocks instead of individual records. Therefore, block indexes consume a lot less disk space and can be scanned faster. Structurally, they are the same as regular indexes. The following figure shows an example of block indexes for the table in Figure 3. In addition to the two dimension block indexes on Region and Year, a combined block index on Region and Year is also generated.
Figure 4: Multidimensional Clustering – Block Indexes
MDC provides the following benefits: Less data reorganization:
With MDC, a table can be physically clustered on more than one key or dimension simultaneously. An MDC table maintains and guarantees its clustering across all dimensions automatically and continuously. It is not necessary to reorganize MDC tables to restore the physical order of the data. In addition, starting with DB2 V9.7 for LUW, empty blocks can be returned to the tablespace very efficiently so that the space can be used by other tables. The reclaim of empty extents of MDC tables is an online operation that can be automated with DB2s automatic table reorganization feature. Improved SQL query performance:
The performance of queries with predicates on the clustered dimensions of an MDC table is improved because these queries access only those pages that have records with the qualifying dimension values. The qualifying pages are grouped into blocks, which results in most efficient sequential prefetching.
Reduced database locking:
MDC supports the loading of data from external source systems (roll-in). If different processes insert data into separate cells, locking is reduced to lock MDC blocks instead of single rows. Note that you can enable block locking for an individual MDC table by setting the LOCKSIZE parameter to
BLOCKINSERT in the database system catalog. In SAP NetWeaver BW systems, block locking is enabled automatically where applicable.
Fast data deletion:
MDC supports fast deletion of large amounts of old data that is no longer needed for reporting (roll-out). If all data of an MDC block is deleted, the pages of the block are marked as deleted and the block indexes are updated. Starting with DB2 V9.5, additional record-based indexes defined on MDC tables are cleaned up asynchronously in the background when the deletion of the data is completed. This improves the data deletion process by factors. Empty blocks can be reused as soon as the rollout is committed.
MDC is fully supported in SAP NetWeaver BW 7.0 and higher releases. A back-port with limited functionality is available for SAP NetWeaver BW 3.5, SAP Business Information Warehouse 3.0B, and SAP Business Information Warehouse 3.1 Content. For more information, see SAP Note 942909.
For more information about MDC and its use in SAP NetWeaver BW, see the following guide: SAP NetWeaver Business Warehouse 7.3 – Administration Tasks: IBM DB2 for Linux, UNIX, and Windows,
https://websmp101.sap-ag.de/~sapidb/011000358700001420572010E.PDF .
With the focus of this PoC in the data staging capabilities, MDC was beneficial for fast deletion of data in the following situations:
Deletion of processed requests from PSA tables after the data has been written to corporate memory Deletion of requests that are older than 10 days from the standard DSO change log tables
Deletion of data that has been archived to near-line storage (NLS) from InfoCubes and DSOs MDC is also used in the MPP-optimized DSO data activation that is described later in this document in the
Features of SAP NetWeaver 7.3section.
Data and Index Compression
With data and index compression, the disk space needed for tables and indexes can be reduced considerably. Data compression was introduced in DB2 V9.1 for LUW, and index compression was
introduced in DB2 V9.7 for LUW. DB2 data compression is based on compression dictionaries that - starting with DB2 V9.5 for LUW - , are created automatically when data is written into a table, which is enabled for compression. Compression dictionaries can also be created manually as follows:
By reorganizing a table with the RESETDICTIONARY option. The REORG command (re)builds the compression dictionary and (re)compresses all the data.
By executing DB2 INSPECT command with the ROWCOMPESTIMATE option. The INSPECT command creates a compression dictionary and inserts it into the table if the table is enabled for
compression. Existing data is not compressed but data inserted or updated in the future is compressed with the dictionary.
In DB2 V9.7 for LUW, indexes are created and are then automatically compressed if the table is enabled for compression.
In SAP NetWeaver BW, PSA tables, DSO tables, and InfoCube and aggregate fact tables can be created with compression enabled. If at least DB2 V9.5 for LUW is used and if the IBM DB2 Storage Optimization Feature is licensed, these tables are created with compression automatically enabled. Dimension and master data tables are not automatically compressed. The IBM DB2 Storage Optimization Feature is included in the SAP IBM DB2 OEM license at no extra cost.
In this PoC, data and index compression is used. The size of the tables of the layered scalable architecture for POS DM could be reduced between 82% and 88%, the size of their indexes between 53% and 71%.
Compression of Temporary Tables
Compressing temporary tables is especially beneficial for SAP NetWeaver BW systems because large temporary tables might be required to handle complex BW queries. The compression of temporary tables offers reduced IO, better use of the buffer pool, and the possibility to decrease the size of the temporary tablespace. Compression of temporary tables is based on a dictionary and works in the same way as data compression of regular tables.
Automatic Statistics Collection and Real-Time Statistics
Automatic statistics collection lets the DB2 engine check and determine whether database statistics need to be updated. The database triggers the RUNSTATS utility in the background for all tables that need updated statistics. A database administrator does not need to create additional jobs manually to check and update database statistics.
The DB2 engine distinguishes between asynchronous and synchronous automatic statistics collection: The evaluation engine for asynchronous statistics collection runs every two hours and checks table and index statistics. Tables for which no statistics exist or which have outdated statistics are scheduled for RUNSTATS. Tables scheduled for RUNSTATS are processed in the online maintenance window. Asynchronous statistics collection collects full table statistics with distribution and sampled detailed index statistics by default.
If the SQL compiler requires new statistics to create an optimal access plan, the SQL compiler invokes synchronous statistics collection. Depending on the statistics required by the SQL compiler and the size of the table, statistics might be fabricated, collected on a small sample of the data only, or collected fully. Synchronous statistics collection is called real-time statistics or automatic statement statistics and it was introduced in DB2 V9.5 for LUW.
SAP NetWeaver BW systems rely on DB2 automatic statistics collection. If automatic statistics collection and real-time statistics are enabled, calls to the RUNSTATS command in the SAP NetWeaver BW ABAP code are not executed.
During this PoC, automatic statistics collection and real-time statistics were activated.
Automatic Storage Management
If DB2 databases are created with automatic storage, you have to only define a storage pool that is associated to the database. This storage pool is defined by the storage path(s) for tablespaces and the database storage path. The storage path(s) for tablespaces store the data of the tablespaces that are enabled for automatic storage. With automatic storage enabled, tablespace sizes are administered automatically. Database administrators do not have to define container sizes or to add new containers to tablespaces manually any more. Monitoring of free space for the database is reduced to monitoring free space in the file system, which is a rather simple task that you can automate quite easily.
In DB2 V9.7 for LUW, automatic storage and DMS tablespaces are automatically enabled for the reclaimable storage feature. With reclaimable storage, the tablespace extents can be consolidated below the high-water mark and unused extents can be returned to the system for reuse.
The DB2 database used in this PoC was created with automatic storage on four storage paths and tablespaces enabled for reclaimable storage.
DB2 Specific Near-Line Storage (NLS) Solution
There is an integrated DB2-specific NLS solution for SAP NetWeaver BW available.
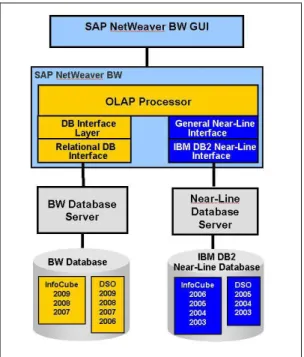
NLS is a new category of data persistency that is similar to archiving. Using an NLS database enables you to transfer historical read-only data of your InfoProviders (for example, InfoCubes and DataStore objects) to an additional NLS database. The database server and the storage devices of the NLS solution can be located on the same server as the SAP NetWeaver BW system or on a dedicated server. However, you can still access the separated data in the NLS database transparently from an SAP NetWeaver BW system.
The following figure (Figure 5) shows a basic setup of the NLS solution with DB2 for LUW as NLS database:
Figure 5: Basic Setup of NLS with DB2 for LUW as NLS Database
You can access NLS data online via the OLAP processor and the additional NLS interface that consists of the following parts:
General NLS interface, which is database independent
DB2-specific interface that establishes a database connection to the NLS database server and accesses the NLS data
The DB2-specific NLS solution is available as of the following SAP NetWeaver SAP NetWeaver releases and DB2 releases:
DB2 V9.7 for LUW (for the installation of the NLS database)
Enhancement Package 1 of SAP NetWeaver 7.0 Support Package 6 or higher with at least DB2 V9.1 or higher
This solution is delivered with the SAP NetWeaver 7.0 product and you can install it using the SAP
installation tool SAPinst. To monitor the NLS database, you can use the NLS-specific extensions in the DBA Cockpit.
For more information about the DB2-specific SAP NetWeaver BW NLS solution, see the following guide: How-To Guide: Enabling SAP NetWeaver Business Warehouse System to Use IBM DB2 for Linux, UNIX, and Windows as Near-Line Storage (NLS),
Excellent performance numbers (see chapter "Details of the SAP NetWeaver BW Near-Line Storage (SAP NW BW NLS) tests") are measured in this PoC for:
Data transfer to the NLS database BW query response time
You can use the DB2-specific NLS feature to reduce the size of the BW database and the TCO of the over-all SAP EDW POS solution.
Features in SAP NetWeaver BW 7.3 MPP-Optimized DSO Data Activation
MPP-optimized DSO data activation is a new feature of SAP NetWeaver BW 7.3. It explores MPP architectures such as DB2 for LUW DPF to improve the performance of the activation of new data in standard DSOs. In general, the record-based processing of DSO activation is replaced by a few complex SQL statements that process all records of a DSO request in parallel.
As a result, the performance of DSO data activation can improve by factors compared to SAP NetWeaver BW 7.0 and Enhancement Package 1 of SAP NetWeaver BW 7.0.
For standard DSOs to qualify for MPP data activation, ‘SID generation during Activation’ and the ‘Unique Data records’ flag have to be deactivated in SAP NetWeaver BW. With DB2 for LUW as the underlying database, you have to distribute the DSO over at least four database partitions for new data to be activated with the MPP-optimized data activation.
In this PoC, the MPP-optimized DSO activation is applied for the DSOs in the layer business transformation of the layered scalable architecture for POS DM.
Parallel Data Extraction from Write-Optimized and Standard DSOs
In SAP NetWeaver BW 7.3, you can configure data transfer processes (DTPs) from write-optimized DSOs and DSO change-logs for parallel extraction of data (conditionally available starting SP3). In earlier SAP NetWeaver BW releases, serial extraction from DSOs was performed together with several write processes that transfer the data to the target InfoProvider. In this PoC, a parallelism setting of 25 batch processes was used.
IBM Power Systems Features POWER7
The new POWER7 processor has been available since early 2010 and is built in 45 nm technology. Compared to the previous POWER6 CPU, the number of cores on a chip increased by a factor of 4 to 8 cores. In addition, the number of threads available within a core doubled to 4 and the L3 cache moved to the chip itself. With those characteristics, the POWER7 processor is an ideal candidate to implement the SAP Enterprise Data Warehouse for Point of Sales (POS) Data Solution as described in this document. As you have seen in the previous sections, one important aspect of this solution is the very high degree of parallelization on all levels. The increased number of cores and threads supports this improved solution design in a perfect manner.
Additionally, the ability of AIX to intelligently schedule processes with a larger number of threads in the cores helps to adapt to the characteristics of the workload. When only few processes are runnable at a given time, these are evenly spread to the primary threads of the available cores by the AIX scheduler. Resultingly. all
resources of a dedicated core are available to each of the processes. As soon as the number of run-able processes exceeds the number of available physical cores, the additional processes are scheduled to the secondary or tertiary threads of a core.
For more information about POWER7 technologies, see the following IBM Web site:
http://www-03.ibm.com/support/techdocs/atsmastr.nsf/WebIndex/FQ128785 For more information about the improved SMT modes, see the following IBM Web site.
http://www.ibm.com/developerworks/wikis/display/WikiPtype/Understanding+Processor+Utilization+o n+POWER+Systems+-+AIX
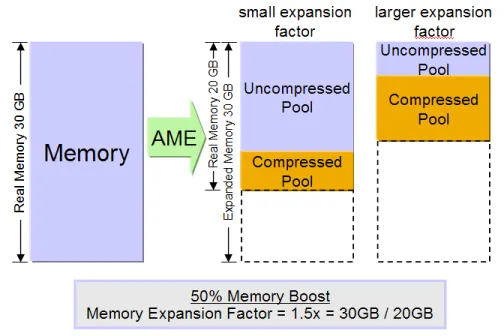
Active Memory Expansion (AME)
Another feature of the POWER7 processor is active memory expansion (AME). AME uses intelligent compression technologies to increase the use of physical memory. In the example described in this
document, we used AME to run the given workload with a smaller physical memory footprint while minimizing performance impact. You will find some measurement results later in this document.
In traditional operating systems, physical memory is used through the virtual memory manager (VMM). This is also true for AIX unless advanced technologies such as AME or active memory sharing (AMS, which is not described in this document) are used. The VMM provides each process in the system with a complete address space and this is called the virtual memory. Each process has its own virtual memory and this address space is partitioned evenly into pages. A page has typically a size of 4 KB. The sum of all virtual memory from all processes can exceed the amount of physical memory in the system. Only if a process is accessing a page in its virtual address range, the operating system provides a physical memory page to this process. The mechanism to detect that a virtual address is not backed by physical memory and to provide it to the process is called page fault. It might happen that the memory demand in the system across all processes is exceeding the available amount of physical memory. In this case, a page fault operation does not find a free physical memory page to provide to the process. The operating system takes a rarely-used page from any process and writes its content to a specific area on disk, which is called paging device or paging file. Now this available physical memory page can be used for the process that demanded a new memory page. If there are free physical memory pages, a typical page fault operation can be handled in micro or even nanoseconds. If the page fault operation has to include disk operation, the time to handle this request increases to milliseconds. This is the reason why systems doing intensive paging are seeing dramatic performance degradations.
By using AME, the VMM has now better options to handle page fault operations. The underlying physical memory is divided by the operating system into two areas: the compressed and uncompressed pool. Pages in the uncompressed pool can be used by the VMM in exactly the same way as in the traditional case. When overall memory demand within an OS instance is exceeding the size of the uncompressed pool, the
algorithm is changed. Instead of swapping a memory page to a HDD device, the VMM can compress the content of this page and write it to the compressed pool. This compression operation and in-memory write is much faster than an I/O operation to disk. Typically, this only takes a few microseconds - compared to the milliseconds required for the disk operation. After the page has been written to the compressed pool, the VMM can use the emptied uncompressed page for the demanding process. The sizes of the compressed and uncompressed pool are managed automatically by the operating system. They are controlled by an AME parameter called compression factor. This compression factor specifies up to which degree the operating system is allowed to compress pages. The higher the compression factor is, the more compression and decompression operations may occur. If the overall memory demand in the system is increasing beyond the amount of memory that can be held in the compressed and uncompressed pool, the system will use
traditional paging as well. Therefore, you can consider AME as a two-stage paging.
From the perspective of a process, the size of the physical memory is expanded by the compression factor, why it is called expanded memory.
Figure 6: Active Memory Expansion
AME has multiple advantages which depend on the access pattern to the memory and the amount of physical memory needed by an application. Applications tending to access just a few pages frequently - while majority of instance context is contained in rarely used pages - can benefit most from AME. Typically, an SAP ABAP instance is better suited for the use of AME than a JAVA instance, because garbage
collection in Java accesses a large number of pages in the Java heap and thus might cause more compression and decompression activity.
The following are examples of well behaving use cases for AME:
Use AME to increase the amount of expanded memory for a system without increasing the size of the physical memory
If a system has a peak memory requirement beyond its physical memory size every once in a while AME can help a lot. Instead of moving data to a paging device, the system starts to compress pages to memory, which is much faster as paging. Therefore, instead of experiencing drastic performance degradations during high load phases, these phases can be handled with just a minimal impact on the system performance.
In addition, if the memory demand of an application increased, for example due to a higher number of active users, but the system cannot be upgraded by additional physical memory (all DIMM slots are used), using AME could be very beneficial.
Run an application with lower physical memory footprint
If there is enough memory available in the system to cover all high load phases and the memory access pattern shows a lot of cold (rarely used) pages, you can increase the AME compression factor. This allows you to reduce the physical memory in the system so that you use system resources more efficiently. The other way round: AME supports consolidation of incremental OS instances onto a Power System while keeping the same physical memory size.
With regards to the solution described in this document, we ran the application with decreasing amounts of physical memory while keeping the expanded memory size always on the same level.
For more information about AME, see the following references: Active Memory Expansion: Overview and Usage Guide,
ftp://ftp.software.ibm.com/common/ssi/sa/wh/n/pow03037usen/POW03037USEN.PDF
Active Memory Expansion Performance
Test Environment
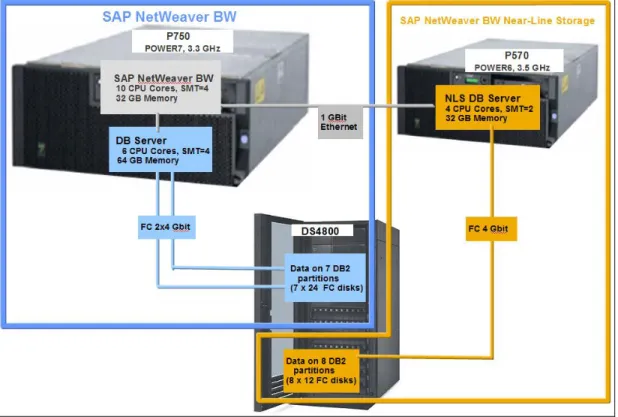
Hardware SetupOn the hardware side, we used a POWER7 based Power 750 running with 3.3GHz for the database and the application server. This machine was partitioned into several LPARs. The presented setup used one LPAR for the database server, one LPAR for the application server and one LPAR for the Virtual I/O Server (VIOS). Not all machine resources were used for the test setup.
The NLS part was implemented as a LPAR running on a POWER6 based p570 with 3.5 GHz. Disk storage for both machines was provided by a Fiber Channel attached DS4800.
Figure 7: System Overview
In detail, the LPAR configuration was as follows: Application Server:
1 LPAR on the Power 750 ( [email protected] ) 10 dedicated CPU cores with SMT4 enabled 32 GB physical memory
Database Server:
1 LPAR on the Power 750 ( [email protected] ) 6 dedicated CPU cores with SMT4 enabled 64 GB physical memory
NLS Server:
4 dedicated CPU cores with SMT2 enabled 32 GB physical memory
VIO Server:
1 LPAR on the Power 750 ( [email protected] ) 1.4 CPUs entitlement, 2 virtual CPUs uncapped
Important: The 1.4 CPU entitlement was not required for this use case. During our tests, we saw a
very low CPU utilization on the VIO server that was typically less than 5%. 5 GB physical memory
1 dedicated dual port 4GB fiber channel card to attach to the DS4800
The application server LPAR and the database server LPAR were using all Ethernet and Fibre Channel connections through virtual adapters provided by the VIO server.
SAP System Setup
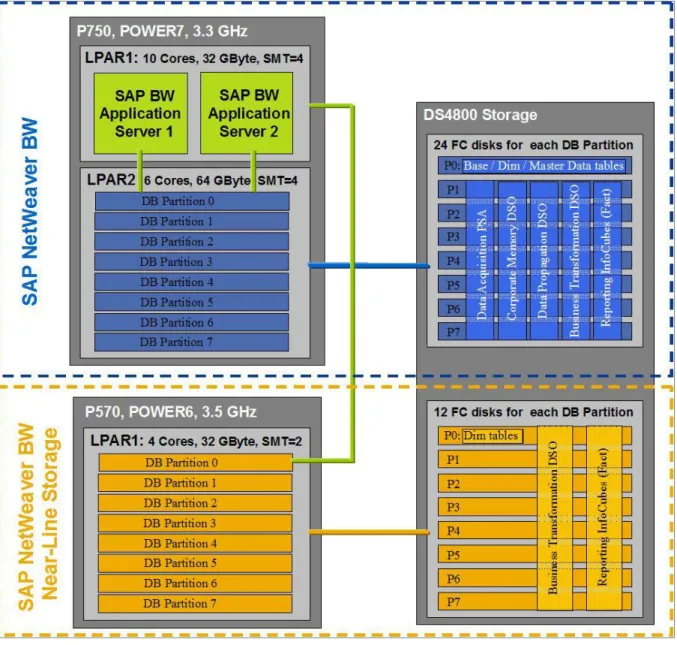
Figure 8: SAP System and DB2 Database Layout
Details of the SAP NetWeaver BW system:
The SAP NetWeaver BW application servers and the database server were running in two LPARs of the IBM Power 750 server.
Two SAP NetWeaver BW application server instances were running in the same Power System LPAR (LPAR1). Both instances were connected to the first database partition (= DB Partition 0) of the database server.
The database server was running in the second Power System LPAR (LPAR2). The database server was created with eight database partitions (administration partition + 7 data partitions) and it was connected to the SAN storage system DS4800.
In the DS4800 system, 24 Fiber Channel disks were assigned to each database partition. The smaller tables (SAP base tables, dimension tables and the master data tables) were located on the disks assigned to database partition 0 (=P0). The large PSA, DSO and InfoCube tables of the different SAP NetWeaver BW staging areas were distributed over all disks assigned to the other database partitions P1 to P7.
In the SAP NetWeaver BW application, an ABAP remote database connection was configured for the data transfer to and from the NLS system
Details of the NLS system:
The NLS server was installed on a separate Power System 570 server (POWER6). The data was stored on the same DS4800 storage system that was also used for the SAP
NetWeaver BW system, however on separate disks.
We used two alternative database server configurations in this PoC:
o An NLS database server with eight database partitions
12 Fiber Channel disks were assigned to each database partition. The dimension tables were stored on database partition 0. The large NLS tables (DSO and InfoCube fact tables) were distributed on all eight database partitions. The configuration with eight database partitions is shown in Figure 5.
o An NLS database server with one database partition
The same hardware resources (CPU cores, memory, I/O capacity) as used for the eight database partition scenario were assigned to the one database partition to have a
comparable environment for the SAP NetWeaver BW NLS performance tests. For example, 96 (= 8 * 12) Fiber Channel disks were assigned to the one database partition. All tables were distributed over the 96 disks.
Test Scenarios
To perform an automatic mass data load to SAP NetWeaver BW, two process chains were used. Both process chains were run simultaneously and influenced each other by using background process events. The purpose of the first process chain was to dispatch data from the PIPE into the delta queue of
DataSource 0RT_PA_TRAN_CONTROL and to trigger a subsequent InfoPackage to transfer the data into the PSA table. The process chain consisted of the following steps:
Figure 9: Process Chain for Data Upload from PIPE
1. Two days of point of sales data (between 23 and 24 million records) were dispatched from the PIPE and written to the delta queue. If a sufficient number of unprocessed requests were available in the PSA table or dispatching was locked, the process chain waited in this step.
2. The data that was written to the BW delta queue was extracted and inserted into the PSA table of 0RT_PA_TRAN_CONTROL.
3. To notify the second process chain that a request for processing was available in the PSA, a background event was raised.
4. The process chain was scheduled periodically and triggered itself once it was finished.
While the first process chain supplied the PSA table with new requests of data, the second chain loaded the data from the PSA to the different data targets. More specifically, different meta process chains were triggered that loaded the requests through the different layers of the EDW LSA. The following steps were processed:
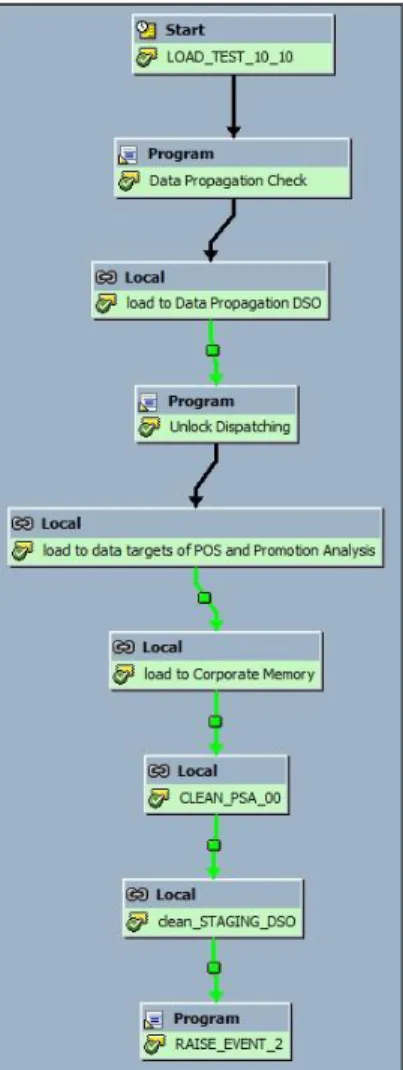
Figure 10: Process Chain for Data Load into the InfoProviders of the LSA for POS DM
1. First, it was checked whether unprocessed requests were available in the PSA table. If this was not the case, the process chain waited until unprocessed requests became available. If these requests were available, the chain continued.
2. The first meta chain loaded requests into the data propagation layer that consisted of a write
optimized DSO. During the load, mostly general business enrichment took place that were computed on the SAP application server. Therefore, the main computation load during this step was on the application server in comparison to the DB2 database.
3. After data was loaded to the propagation layer, the first process chain was unlocked again and allowed to transfer new data to the PSA table. The next meta chain following the data propagation layer conducted several steps.
At first, data was loaded to the business transformation layer that consisted of standard DSOs. These standard DSOs were semantically partitioned by quarter, which resulted in eight DSOs for two years. During this step, specific business enrichment that was processed on the SAP Application Server took place.
After the loading process, the data in the standard DSOs was activated using the new MPP-optimized activation method that mainly created workload on the database server.
Once the data had been activated, it was copied to the reporting layer that consisted of eight semantically-partitioned InfoCubes. Since no enrichment was performed in the transformation, the workload was mainly on the database LPAR.
Requests that had been loaded into the standard DSOs more than 10 days earlier were deleted from the change logs.
4. After the data had been enabled for reporting, it was loaded from the PSA table to the write-optimized DSOs in the corporate memory layer (eight DSOs for two years that were semantically partitioned by quarter). This was a 1:1 transformation to store the data unmodified to provide flexibility for cases where remodeling was necessary or redundancy was required to repair errors. 5. To prepare the process chain for the next run, successfully processed data was deleted from the
PSA table and the data propagation DSO was purged. 6. The process chain was scheduled periodically.
The DTPs were configured with a parallelism of 25 batch processes. The DSO data activations ran in parallel on the seven database partitions where the DSOs were located. The data deletion jobs from PSA, change logs, and write-optimized DSOs used MDC fast rollout.
Results
The results of the following tests are discussed in this section:
Extract/transform/load (ETL) operations from the PIPE to the InfoProviders of the layered scalable architecture for POS DM
NLS: Archiving from InfoCubes and DataStore objects into the NLS database and execution of reporting queries in the BW system and the NLS system
Impact of the advanced memory expansion (AME) feature on the ETL operations with AME active on the SAP application server.
ETL Performance Evaluation
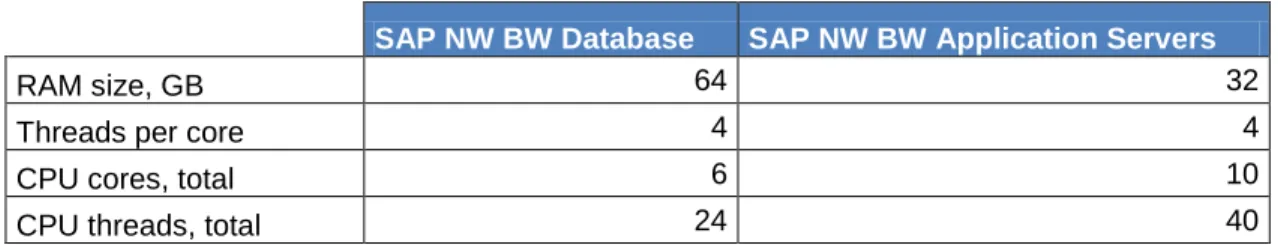
The following table lists the available CPU and memory resources for the SAP application servers and the database during the data load tests:
SAP NW BW Database SAP NW BW Application Servers
RAM size, GB 64 32
Threads per core 4 4
CPU cores, total 6 10
CPU threads, total 24 40
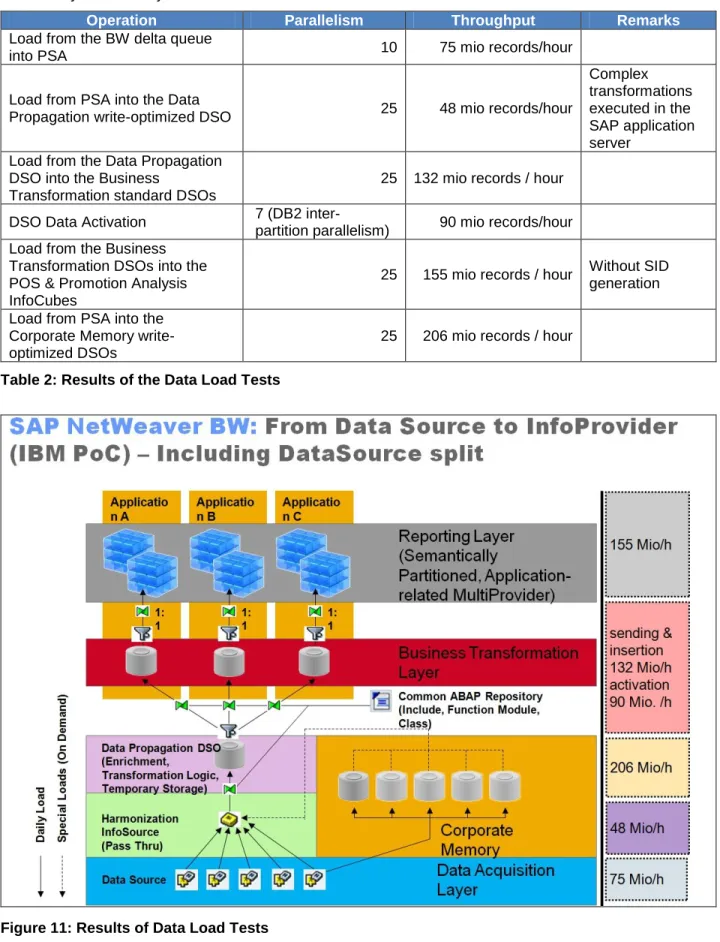
The following table and Figure 11 show the achieved throughput when loading the POS data into the different layers of the layered scalable architecture for POS DM:
Operation Parallelism Throughput Remarks
Load from the BW delta queue
into PSA 10 75 mio records/hour
Load from PSA into the Data
Propagation write-optimized DSO 25 48 mio records/hour
Complex transformations executed in the SAP application server
Load from the Data Propagation DSO into the Business
Transformation standard DSOs
25 132 mio records / hour
DSO Data Activation 7 (DB2 inter-
partition parallelism) 90 mio records/hour Load from the Business
Transformation DSOs into the POS & Promotion Analysis InfoCubes
25 155 mio records / hour Without SID generation
Load from PSA into the Corporate Memory write-optimized DSOs
25 206 mio records / hour
Table 2: Results of the Data Load Tests
To improve the performance of loading from the BW delta queue instead of only one DataSource, five DataSources were configured and the data transfer was split into five parallel processes, each one loading into a different Data Source. Each of the parallel processes ran approximately with a parallel degree of two. The parallelization of DataSources needs to be implemented individually and is not available in the standard setup of the layered scalable architecture for POS DM. We were able to achieve a throughput of 47 Million records per hour without parallelization of the DataSources.
The following figures (Figure 12 and Figure 13) show the CPU usage on the SAP application server LPAR and the database server LPAR while 30 InfoPackages were being loaded from the PIPE through the LSA into the InfoCube for POS & Promotion Analysis. This also includes loading from PSA into corporate memory. Approximately, the overall throughput was 15.15 million records per hour from PIPE into the InfoCube and into the corporate memory DSO.
Figure 12: CPU Usage of SAP Application Server LPAR
Figure 13: CPU Usage of Database Server LPAR
The peaks on the application server LPAR occur during data load from PSA into the data propagation DSO. The data transfer process (DTP) calls complex transformations coded in ABAP, which causes the high CPU usage.
The peaks with high workload on the database LPAR occur during MPP-optimized DSO data activation and data load into the InfoCubes and into corporate memory.
The following table (Table 3) shows the average and maximum CPU usage on the application server and the database LPAR.
User CPU System CPU IO Wait
Average Maximum Average Maximum Average Maximum
Database
Percent 42.34 98.8 4.78 17.1 2.15 28.8
Total 2.54 5.93 0.29 1.03 0,13 1.73
Application Servers Percent 52.71 96.3 2.18 11.4 0 3.6
Total 5.27 9.63 0.2 1.14 0 0.36
Table 3: CPU Usage during Data Load
The following figure (Figure 14) shows the CPU usage on the SAP application servers and the database server while one InfoPackage was being loaded. The following abbreviations are used:
PSA = Load from PIPE into PSA
DP DSO = DTP from PSA into Data Propagation DSO (write-optimized)
BT DSO = DTP from Data Propagation DSO into Business Transformation DSO (standard) Data Act. = Business Transformation DSO data activation
Cube = DTP from Business Transformation DSO into POS & Promotion Analysis InfoCube CM DSO = DTP from PSA into Corporate Memory DSO (write-optimized)
Figure 14: CPU Usage during Load of a single InfoPackage
The figure also shows that the two process chains were running and thereby partly overlapping. While a new request was loaded from PIPE into PSA, the data of the previous request was activated in the business transformation DSO and loaded from the business transformation DSO into the InfoCube.
The following table (Table 4) shows the average and maximum CPU usage for each of the data load and activation operations.
User CPU System
CPU IO Wait Avg Max Avg Max Avg Max
PSA → Data Propagation DSO Database % Total 26.07 77.1 3.58 10.0 0.65 7.5 1.56 4.63 0.21 0.6 0.04 0.45 Application Servers % 75.8 87.6 1.51 6.1 0 0 Total 7.58 8.76 0.15 0.61 0 0 Data Propagation DSO → Business Transformation DSO Database % 37.54 82.6 5.08 14.3 0.56 3.4 Total 2.25 4.96 0.3 0.86 0.03 0.2 Application Servers % 76.57 86.7 2.7 6.2 0 0 Total 7.657 8.67 0.27 0.62 0 0 DSO data activation Database % 50.27 70.4 3.28 9.7 1.89 9.7 Total 3.02 4.22 0.2 0.58 0.11 0.58 Application Servers % 0.72 12.5 0.23 1.3 0 0 Total 0.07 1.25 0.02 0.13 0 0 Business Transformation DSO → InfoCube Database % 60.33 96 4.18 11.1 0.89 16.7 Total 3.62 5.76 0.25 0.67 0.05 1.0 Application Servers % 36.28 84.7 2.7 7.1 0 0.1 Total 3.63 8.47 0.27 0.71 0 0.01 PSA → Corporate Memory Database % 68.04 94.4 6.37 9.7 0.32 2.9 Total 4.08 5.66 0.38 0.58 0.02 0.17 Application Servers % 28.2 80.4 4.71 7.6 0 0 Total 2.82 8.04 0.47 0.76 0 0 PIPE → PSA Database % 48.47 95.7 4.78 13.0 2.19 19.79 Total 2.91 5.74 0.29 0.78 0.13 1.19 Application Servers % 33.63 94.5 2.19 7.6 0 0 Total 3.36 9.45 0.22 0.76 0 0
Table 4: CPU Usage during Load of one InfoPackage
Some tests for DSO data activation were run with MPP-optimized DSO data activation turned off. The throughput achieved in these runs was 43.7 million records per hour, which is about 48.5% of the throughput achieved with MPP-optimized DSO data activation.
NLS Performance Evaluation
During this PoC, the performance of the following NLS-related operations was measured:
Data archiving from the SAP NetWeaver BW database to the NLS database and adjacent data delete in the SAP NetWeaver BW database.
BW queries that access data in the SAP NetWeaver BW and the NLS database
The necessary system resources of an NLS system depend mainly on the NLS performance requirements and the data volume that is stored in the NLS database. In a real-life scenario, the NLS system is smaller than the SAP NetWeaver BW database server.
In the following list, the characteristics of the NLS system are compared with the resources of the SAP NetWeaver BW system:
CPU power (measured in physical cores): 67% of the SAP NetWeaver BW system
RAM size (measured in Gigabytes): 50% of the SAP NetWeaver BW system
Storage performance (measured in amount of disk spindles): 50% of the SAP NetWeaver BW system
NLS System
SAP NW BW
System Ratio NLS / BW
CPU architecture of the DB
server POWER6 POWER7 ---
Total number of CPU cores of the
DB server 4 6 67%
CPU threads per core 2 4 50%
Total number of CPU threads 8 24 33%
RAM size of the DB server in GB 32 64 50%
Amount of disk spindles used in
the storage system 96 192 50%
Table 5: System Configuration used during NLS Tests NLS: Data Archiving Tests
Copy and Verification Phase
The NLS interface performs the following steps during this phase:
Reads data of the SAP NetWeaver BW object with (?) specified archiving time interval Writes data into the NLS database
Verifies data to make sure that the transferred NLS data are correct and consistent
The original SAP NetWeaver BW fact table holds about 745 Million records. In total, 500 Million records were copied to the NLS database and were verified with 15 parallel running NLS archiving processes. Each process transferred approx. 33 million records.
In total, 185 million records per hour were copied and verified.
The following table shows performance details of the SAP NetWeaver BW, the SAP application and NLS servers. During this test, NLS archiving was the only workload running on the SAP NetWeaver BW system.
SAP NW BW NW BW Database Server LPAR
SAP NW BW
Application Servers LPAR
NLS Database Server LPAR
Average user CPU usage 14% 56% 48%
Average CPU cores used 0,9 5,9 2
Average read/write activity in
million bytes per second 8 - 25
Table 6: System Performance Characteristics during NLS Tests
The 15 parallel processes read the data from the SAP NetWeaver BW database server, transform the data into the new NLS object structure, and send the NLS data to the NLS database server. Significant CPU resources with a usage of 56% on the SAP application server LPAR are consumed for these processes. The CPU and I/O usage on the SAP NetWeaver BW database server is relatively low with a 14% CPU usage and 8 million bytes per second I/O activity. Approximately half of the CPU resources are consumed on the NLS database server, white its Read/Write activity was 25 MB per second in average. I/O usage on both
database servers is low compared to a maximum I/O data transfer capacity of about 512 MB per second on both servers.
Deletion Phase
The final step of the NLS data archiving process is the data deletion phase. We tested the data deletion process with the following two different table layouts of a BW InfoCube:
MDC fast delete feature:
A BW InfoCube is created with MDC on the time characteristic column of the fact table that is used for data selection of an NLS data archiving package (that is, the MDC fast delete feature is used for data deletion).
Default DB2 data delete feature:
The time characteristics column of the fact table of the BW InfoCube is not created as an MDC column (that is, standard DB2 data deletion is used).
To ensure that the test conditions were the same in both tests, two identical InfoCubes with the same amount of data were used.
On both InfoCubes, data deletion was processed with 15 delete processes that were running sequentially, that is one package for one InfoCube at a time. Each process deleted approximately 33 million records. At first, both BW InfoCubes had 745 Million records. 500 million records were deleted, and 245 Million records were left.
As described in chapter “Innovative Features Used”, MDC fast delete is a block-based data deletion method and, therefore, much faster than the normal row-oriented data deletion method.
The deletion tests illustrated that MDC fast delete is approx. factor 3.64 faster. For that reason, we
recommend that you create the time-specific column in the fact table to be used for the selection of NLS data as MDC column.
MDC Fast Delete
Normal row based data delete (Non-MDC)
Runtime to delete 500 million records
(hours) 0.915 3.33
Number of deleted records (million
per hour) 546 150
Table 7: Deletion Performance
Overall Performance of the Data Transfer
As mentioned above, 185 Million records per hour were transferred from a BW InfoCube to the NLS database with 15 processes running in parallel. After that, 546 Million records per hour were deleted with MDC fast delete.
This means that 135 Million records per hour is the overall data transfer rate for NLS data archiving (including the data delete phase) measured in this environment
You can use SAP NetWeaver BW process chains to automate the complete NLS data transfer process using paralle