Towards A General Method for Building Predictive Models
of Learner Success using Educational Time Series Data
Christopher A. Brooks
School of Information University of Michigan Michigan, USA[email protected]
Craig Thompson
Department of Computer Science University of Saskatchewan Saskatchewan, Canada[email protected]
Stephanie Teasley
School of Information University of Michigan Michigan, USA[email protected]
ABSTRACT
This paper presents a pedagogical and instructional-technology general method for building predictive models for education from time series log data. While it is common for models of learner achievement to include cognitive features, we in-stead are data mining only resource accesses in the learning environment. This has benefits in that the approach is inher-ently scalable to new contexts due to its data driven nature. While we have only just begun to apply these methods to our institutional Massive Open Online Course (MOOC) data, it shows promise as both a descriptive modeling technique as well as an engine for creating predictive early alerts.
1.
INTRODUCTION
Predictive models in education generally require intimate knowledge of the domain being taught, the objectives be-ing learned, and the pedagogical circumstances under which the instruction takes place. While there is some work that focuses on removing some of these constraints and focus-ing instead on specific tools or pedagogies (e.g. analysis of discussion forum communication), this limits techniques to only those courses which use a particular technology or ped-agogical approach.
In this paper we present our initial work towards a general method of building predictive models for educational data. Unlike existing work in the area, we aim to build models solely from coarse grained observations of interactions be-tween a student and course resources over time. Our goal is not to build the most predictive model for a particular course, though predictive accuracy is an important aspect of our work. Instead, we aim to enable “one click modelling” of a large variety of educational data systems without the need to involve instructors, pedagogical experts, or learning technologists. These models can then be used to gain insight into how a course operates, build early-warning systems for student success, or characterise how courses relate to one another.
Permission to make digital or hard copies of all or part of this work for personal or classroom use is granted without fee provided that copies are not made or distributed for profit or commercial advantage and that copies bear this notice and the full citation on the first page. To copy otherwise, to republish, to post on servers or to redistribute to lists, requires prior specific permission and/or a fee.
LAK’14, March 24 - 28 2014, Indianapolis, IN, USA Copyright 2014 ACM 978-1-4503-2664-3/14/03 ...$15.00.
A strong motivation for this approach comes from the growing list of educational software systems that collect so-called “clickstream” data about learners. For instance, the BlackBoard and Sakai learning content management sys-tems both collect data on the accesses learners have with various tools and content, the Opencast lecture capture sys-tem collects fine-grained data on access to lecture video and configuration of the playback environment, and the Cours-era massive open online course platform collects web logs of how users have navigated through the course website. All of these systems do this educational data logging in addition to maintaining traditional operations data based on the fea-tures available to learners.
This paper proceeds as follows: In section 2 we provide a more formal definition for our characterisation of educa-tional log data. This is followed in section 3 where we focus on demonstrating how time series data from the Coursera platform can be used to generate predictive models with little effort. We provide discussion of a novel method of mining time series data based onn-gram techniques used in text mining, as well as details on how accurate and reusable models might be for MOOC environments. We conclude the work in section 4 with a discussion of impact and future directions.
2.
EDUCATIONAL DATA
Much of the attention in the technology enhanced learning field has been paid to understanding how people learn from a cognitive perspective. For instance, Anderson’s ACT-R theory of skill knowledge [1], which is used as a basis for many intelligent tutoring systems (see [5]), suggests that cognitive skills can be described as production rules: small operations of data manipulation organized around atomic goals. Firing of correct rules is done repeatedly with the facts available to a learner, causing them to demonstrate a particular higher level cognitive skill. Inability to fire correct rules in such a way that a skill is demonstrated indicates a lack of having the correct rules, and suggests a need for educational intervention (learning) or that the rule matching mechanism needs improvement.
An alternative to this is Ohlsson’s theory of learning based on performance errors, where he argues that it is through making mistakes and correcting them that we demonstrate learning [11]. Providing a correct answer does not signify the learner understands; instead, the learner may just not yet have made a mistake and may have inadvertently answered correctly. It is the times the learner demonstrates mistakes
that indicate learning is happening. This approach is core to the constraint-based modeling family of intelligent tutoring systems such as [10].
Interactions with content and problems are not the only learning theories, and learning through communication with other individuals has been well explored under the theory of social constructivism [6]. While the majority of work in this area has been on peer-to-peer learning through chat or discussion forums, some have also applied intelligent systems in the form of peer matching [4] or tutors based on dialogue systems [7].
In this paper, we refrain from trying to understand, ap-ply, and model learning processes directly, and instead aim to build learning systems that observepatters of interactions
students have with resources. This is a data-driven perspec-tive on the learning process, and we aim to recognize suc-cessful patterns of achievement by virtue of their existence in the learning environment. This has both advantages and disadvantages to traditional methods of learner modeling, with both of these explored in section 4.
We view the learning system as being made up of five pieces: students, resources, interactions, events, and some measurement of outcome. The first of these,students, is a set of individuals who interact with some learning environment. These individuals have characteristics that are known when they first begin interacting with the environment and, for simplification of modelling purposes, these characteristics do not change. For example, demographic variables (e.g. age, gender, ethnicity) as well as prior knowledge (e.g. previous grades or other measures of evaluation) can be associated with an individual, and may be a direct influence on their outcomes. In the results described in the next session we omit from our modeling student characteristics, but we note here that they may be useful (and readily accessible) when creating predictive models.
Students interact with a learning system throughresources. These resources may be web content, discussion forums, lec-ture video, or even intelligent tutoring systems. Resources may be described through different levels of generalization. For instance the coarse grain “lecture” resource may be make up of individual “lectures” each of which may be made up of “segments”. An important distinction between this view of resources and others is that we intentionally conflate peda-gogy, technology, and content into a single item, and do not attempt to disambiguate resources by defining them to be about concepts, methods, or delivery mechanisms.
Aninteraction denotes a singular circumstance in which a student uses a resource, and represents a temporal rela-tionship between the student and resource. For instance, an interaction may be viewing a lecture, submitting a quiz, or reading a discussion forum post. It is expected that individ-ual interactions will be manipulated through aggregation, summation, scaling, or other mathematical functions in or-der to describe different levels of granularity that may be useful in the modelling process. This manipulation is to be applied in an automated manner, and not requirea priori
hypotheses based on the content, concepts, or individuals involved.
Each interaction exists between two events. Events are demarcations of the beginning and end of time-frames of in-terest. Conceptually, events can be hierarchically arranged, and a given set of data might have a start and end time which encompass other events such as assignment deadlines,
examinations, or course beginning and endings. In the in-vestigation section to follow we will focus only on a single set of events that note the beginning and end of a course, but one can readily imagine how it may be useful to predict outcomes for other pairs of events.
Educationaloutcomescan be measured in various ways in-cluding through taxonomies of skill acquisition (e.g. through Blooms taxonomy [3] or the like), grades (which may be content-based or a comparison between students in a co-hort), or student satisfaction (which may be measured through self-reports or through proxy variables such as retention in a program). In our characterization of educational data mod-elling we make no attempt to link specific interactions to outcomes in a theoretical matter. Instead, we argue that correlations found through the data mining process will ei-ther support or not support linkages between interaction patterns and educational theory. Thus, evidence for learn-ing theory is an output of the modelllearn-ing process, which can be reflected upon by practitioners, but theory is not neces-sarily an input to the process. The only constraint we put on the educational outcome is that it be well-defined and measurable so that it can be used as a predictor variable in the data mining process.
3.
INITIAL INVESTIGATION
For an approach to be considered a strong contribution to the fields of learning analytics and educational data mining we outline three criteria: First, the approach must be able to produce accurate descriptive models for different circum-stances (which may include differentoutcomesand/or kinds of differentinteractions). While there is no clear cut-off as to how accurate a model must be to be useful, we find this discussion one of growing important and refer to it as de-scriptive validity. Second, the models generated must have some level of intra-course validity. We recognize that vari-ance exists between courses (or course offerings), and that population changes can have a significant impact on validity of models. We have no clear cut-off as to how applicable a given model must be in new circumstances in order to be valuable for the field. Nonetheless, this is an important is-sue to consider when building predictive models. Finally, in addition to descriptive validity and intra-course validity, it is important to recognize the predictive validity of a given technique. How does the passage of time affect the accuracy of a model trained from previous circumstances? This is a not well understood issue in the field, yet a critical one in being able to compare the results of various techniques.
In this section we describe our initial investigations using the aforementioned characterization of educational data. As our work is ongoing, we have not completely addressed how our approach meets these three criteria. Instead, we pro-vide a work in progress of our initial methods, results, and validation efforts.
3.1
Methodology
In our first application of this approach we have chosen two offerings of a Massive Open Online Course (MOOC) that was delivered through the Coursera platform. Cours-era stores individual page requests in a JSON-encoded click-stream file, which we transformed into a comma separated list of values1. The results are log files where interactions
are in the form (username, timestamp, resource) where the
learner interacting with the system, the timestamp is the server time when a resource was accessed2, and resource is one oflectureview,f orumthread, orquizattemptbased on the URL path being accessed. While more details as to which resources were being viewed are available (e.g. the specific lecture, forum thread, or quiz), we began our inves-tigation with only the coarse grain description of resources being used.
In this investigation we have three research questions we want to answer with this data:
R1 Can we create an explanatory model that describes the patters of interaction that lead to learners achieving a distinction (85% or higher) in final course grade? R2 Can we create a predictive model of learner
distinc-tion (85% or higher in course grade) from interacdistinc-tions in one course that have validity in a second course of-fering?
R3 How accurate is a predictive model of learner distinc-tion (85% or higher in course grade) when applied with limited data (e.g. for the formation of an early alert system)?
To address these questions, we formed predictive mod-els with J48 decision trees using the weka toolkit [8]. For each model, we performed a number of automated transfor-mations to extract features from the set of interactions as described in the next section. We have made the software for creating these features freely available at URL.
3.2
Creating Features from Time Series Data
All of the features here are described in binary; either an access for a particular time existed (f eature= 1) or did not (f eature= 0).3.2.1
Relative Offsets
As we were interested in comparing two courses offered in different calendar months, we changed all accesses to be relative to the start of the course. We also pruned the course interactions to ten weeks (the listed length of the course) from the first day the course was made available to students. Using a single day as our smallest level of granularity, this provided us with 71 attributes for each learner.
3.2.2
Varying Degrees of Granularity
It is difficult to know at what granularity one should con-sider educational time series data. Some applications may generate very fine grained resolution data, such as millisec-onds for kinesthetic learning tasks (e.g. learning to plan a musical instrument), or second and minute resolution for atomic learning tasks (e.g. those used by ACT-R inspired tutoring systems). Given the sparsity of our data, we ag-gregated access into three day long, week long, and month long values for each learner. Thus the feature vector for each learner included 71 daily accesses, 25 three day accesses, 11 week accesses, and 3 month accesses, all relative values from the start of the course. We also included counts of the num-bers of accesses on different days of the calendar week (e.g. Sunday through Saturday), adding another 7 attributes.
1Seehttps://bitbucket.org/umuselab/mooc-scripts for
the open source scripts used for this process.
2We did no modification of these values for the time zone
the learner happened to be in.
3.2.3
Applying N-Grams to Temporal Accesses
The co-occurrence of features based on the time series data may represent patterns that describe success (or lack thereof). For instance, if all students who watch lectures on the six, seventh, and eighth day of the course end up with distinction in the course while those who do not watch lectures these days fail to get distinction then this pattern of behavior is valuable (and would captured by our existing transformations). If, however, a successful pattern of in-teraction was in watching consecutive lectures on any three days, this pattern may be missed by our existing non-pattern features.To capture these kinds of patterns, we apply the well-used n-gram technique from text mining to interactions. An n -gram is a sequence ofnwords, andn-grams features are of-ten used as counts of particular n-grams. For instance, if the words “quick brown fox” occurs twice in a given document, the n-gram (in this case a 3-gram) featurequick brown fox
would have a value of two. In our data we are dealing with accesses to resources such as lecture videos, so an n-gram with the pattern (0,1,0), the label of Week, and count of 2 would indicate that a student had two occurrences of the pattern of not watching lectures in one week, watching in the next week, and then not watching again in the third week.
We generate the set of n-grams ranging from 2-grams to 5-grams covering all permutations of (0,1) from (0,0) to (1,1,1,1,1). We repeat this process for features of days, 3-day lengths, weeks, and months. The n-gram feature counts for a given course dataset were normalized to be values be-tween 0 and 1. Together with the features described in sec-tions 3.2.1 and 3.2.2, we had a total of 1,071 features for training.
3.3
Results
Our dataset was made up of interactions including 87K accesses to the discussion forums, 130K accesses to the quiz system, and 2.8M accesses to the lecture videos. It is well recognized that the vast majority of users who sign up for a MOOC do not participate in evaluation mechanisms. Our educational outcome of interest was whether learners who were actively involved in the course achieved a distinction or not, and we split our dataset on the 85% grade for the course (pruning learners who received a grade of zero), and balanced the two halves through random subsampling. Our final dataset size was of 5,118 users.
3.3.1
An Internal Descriptive Model
Our first interest was in building a descriptive model of the two cohorts (hereafter calledlow achievingandhigh achiev-ing respectively). Such a model could be used by instructors or instructional designers to help guide the development of future courses by identifying the correlations between access patterns and success. After building the model in weka3 us-ing the features described and ten fold cross validation we were able to correctly classify 91% of students, attaining a kappa of 0.8199. Table 1 shows the confusion matrix for this model.
The rules created for this decision tree are fairly simple (Figure 1). The first decision is based on the 3 day quiz
3
All models described in this paper were built with Weka version 3.6 and J48 classifier parameters having a confidence of 0.25 and a minimum leaf node size of 50.
(0, 0, 0, 0, 0) 3 Day Quiz Pattern <= 0.2
| (0, 0, 0) Day Quiz Pattern <= 0.62963: high (2526/275) | (0, 0, 0) Day Quiz Pattern > 0.62963
| | Month 2 Lecture = 0
| | | (0, 0) Day Quiz Pattern <= 0.711111: high (50/17) | | | (0, 0) Day Quiz Pattern > 0.711111: low (120/37) | | Month 2 Lecture = 1: high (200.0/46.0)
(0, 0, 0, 0, 0) 3 Day Quiz Pattern > 0.2: low (2200/73)
Figure 1: The decision tree rules created for an internal descriptive model.
Actual Predicted Class
Class low achievement high achievement
low achievement 2,206 342
high achievement 117 2,431
Table 1: Confusion matrix for internal descriptive model.
access pattern of (0, 0, 0, 0, 0), which represents the number of times a given student has not accessed quizzes in a 15 day period (i.e. 5 consecutive three day periods where quizzes were not accessed). This value is normalized to the dataset4, and those students who have more than a value of 0.2 were largely unable to achieve distinction (2,200 students had this pattern in the training set). Students who had a less than or equal to 0.2 value for this attribute were next distinguished by whether they had a high (0.62963 or higher) three single day quiz patterns of (0, 0, 0), with 2,526 students being classified as high achievement on this alone. The last two patterns look at whether the students viewed lectures in the second month of the course offering and, if not, further patterns related to quiz usage. While we are not learning designers, one might infer from this that attempting the quizzes is perhaps sufficient in order to gain distinction in this course.
3.3.2
Intra-Course Predictive Validity
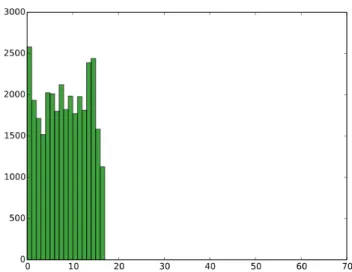
We were interested in testing how valid the model de-scribed in Figure 1 would be at predicting distinction achieve-ment in subsequent offerings of the same course. This is a challenging issue for predictive analytics, as changes in the population or the circumstances by which they interact with course resources will reduce the efficacy of the model. We naively applied our previously trained model to a subsequent course offering with 4,776 users, and correctly classified 65% of the students, achieving a kappa of 0.307. An investigation of resource utilization revealed that accesses to the quiz and forum resources for the second course offering were much dif-ferent than in the first offering, with zero access to quiz con-tent after the third week of the course. Figures 4a through 4f show histograms of the access to resources between the two courses.
While the details as to why the second offering of this course showed different accesses were not available in time for workshop publication (e.g. system log failure, dramatic change in pedagogy, etc.), this does demonstrate an
im-4
The student with the most number of (0, 0, 0, 0, 0) quiz attempt patterns would have a count of 1, and the student with the least number of these patterns would have a count of 0. Thus the closer a students’ count is to zero the more rare this pattern is in their interaction history.
portant issue when building automated predictive models. Namely, that there should be some metric by which the time series data of two courses can be compared in order to deter-mine the appropriateness of applying a particular model. In this case, access to lecture videos (Figures 4e and 4f) in the courses appears roughly similar, while the access to quizzes and forum messages does not.5
We retrained the predictive model for the first offering of the course using onlylectureview resource events. We omit the confusion matrix for brevity, and show several of the rules that were generated in Figure 2. We applied this model to the second course offering data, and were able to correctly classify 78.1% of instances, achieving a kappa of 0.563. Not only was this significantly better than the application of the original model trained on all of the resources, but a kappa of this magnitude is reasonable when developing low risk interventions.
3.3.3
Midterm Intra-Course Predictive Validity
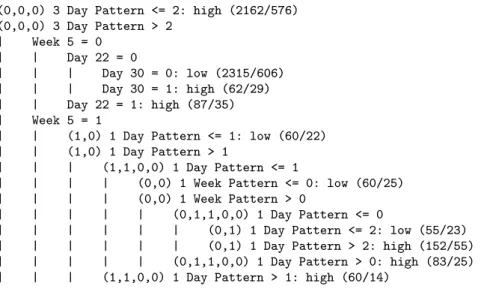
Reflecting on patterns of success for a course after it has finished can be a useful endeavor for course design, and the patterns of success generated for one course may be indica-tors of success for similar courses (as shown in the previous section). However, there is much interest within the learn-ing analytics community to build models that can be used to predict academic risk so that automated interventions can take place while the course is being offered (e.g. [2, 9]. To investigate the suitability of a time series analysis approach to the task of early warning, we trained a predictive model from the first course offering based on five weeks worth (half) of interaction data with lectures, using the same notion of success (85% or higher).When applied to the first five weeks of the second course offering, we were able to correctly classify 68.69% of the students, a kappa of 0.374. Table 2 shows the confusion matrix for this prediction; note the roughly balanced level of misclassification, suggesting the model is roughly equally good (or bad) at predicting whether people will fall below or above the 85% mark. The rules for this model, given in Figure 3, show a variety of decisions of patterns of smaller length, suggesting that large patterns may be more useful with an increase in time frame.
5
Despite the apparent similarity of these histograms, a two-sampled Kolmogorov–Smirnov test of goodness of fit be-tween the samples did not suggest that they were drawn from the same population. It may be that this test is too sensitive with this many data points, or that the samples were indeed different populations at ap = 0.01 level. Re-gardless, the demonstrated value of the model as described in the remainder of this section suggests that other measures of similarity may be needed.
(0, 0, 0, 0, 0) 3 Day Lecture Pattern <= 0.15 | Month 2 Lecture = 0
| | 3 Day Lecture starting on Day 19 = 0
| | | (0, 0, 0, 0, 1) 1 Day Lecture Pattern <= 0.4: low (50/18) | | | (0, 0, 0, 0, 1) 1 Day Lecture Pattern > 0.4: high (134/51) | | 3 Day Lecture starting on Day 19 = 1: 85 (201/32)
| Month 2 Lecture = 1: high (1832/239) (0, 0, 0, 0, 0) 3 Day Lecture Pattern > 0.15 | Month 2 Lecture = 0
| | Week 8 Lecture = 0: 0 (2471/412)
| | Week 8 Lecture = 1
| | | (1, 1, 0, 0) 1 Day Lecture Pattern <= 0: high (59/16) | | | (1, 1, 0, 0) 1 Day Lecture Pattern > 0: low (55/23) | Month 2 Lecture = 1: high (294/87)
Figure 2: The decision tree rules created using only the lecture resource.
(0,0,0) 3 Day Pattern <= 2: high (2162/576) (0,0,0) 3 Day Pattern > 2 | Week 5 = 0 | | Day 22 = 0 | | | Day 30 = 0: low (2315/606) | | | Day 30 = 1: high (62/29) | | Day 22 = 1: high (87/35) | Week 5 = 1
| | (1,0) 1 Day Pattern <= 1: low (60/22) | | (1,0) 1 Day Pattern > 1
| | | (1,1,0,0) 1 Day Pattern <= 1
| | | | (0,0) 1 Week Pattern <= 0: low (60/25)
| | | | (0,0) 1 Week Pattern > 0
| | | | | (0,1,1,0,0) 1 Day Pattern <= 0
| | | | | | (0,1) 1 Day Pattern <= 2: low (55/23)
| | | | | | (0,1) 1 Day Pattern > 2: high (152/55)
| | | | | (0,1,1,0,0) 1 Day Pattern > 0: high (83/25)
| | | (1,1,0,0) 1 Day Pattern > 1: high (60/14)
Actual Predicted Class
Class low achievement high achievement
low achievement 1,672 716
high achievement 779 1,609
Table 2: Confusion matrix for internal descriptive model.
4.
CONCLUSIONS AND FUTURE WORK
In this paper we have framed the activity of creating pre-dictive educational models as one of modelling time series events inherent in educational log data. This contrasts sig-nificantly with theory-driven methods of modelling learners in that we consider no cognitive processes explicitly, and just analyze the observations of interactions that learners have with learning resources. Our approach is largely enabled by the near-ubiquitous interaction level logs kept by modern educational technology environments, and the growing size of educational datasets available.
A significant cost in learner modeling is the amount of time and sophistication required to map both the cogni-tive and subject domains onto the learning tools being made available. We aim to ease this by requiring no explicit knowl-edge of learning process in order to form predictive models. These models are based solely on the interactions learners have with resources in the learning environment. Our end goal is to enable course-specific predictive modeling based on historic data without requiring the input of subject matter experts or learning designers.
While no trained educator is required to apply this tech-nique, historical data is needed. Thus in situations where historical data is not available (e.g. a new course offering), other forms of modeling learners must be used. Further, we know of no clear measure by which two courses (or more properly, two sets of learner interactions with resources) can be compared to determine their similarity. Thus it is un-clear how one might determine whether it is appropriate to apply an existing models to a new circumstance. We point to this as being a significant issue in moving forward with this approach.
This work is in its infancy, and we have presented here only a basic investigation of how educational time series data can be used to predict student success. There are a num-ber of compelling questions which we are considering going forward, including:
• How much data is required in order to build robust pre-dictive models? In this paper we used data from a MOOC offered on the Coursera platform. Is this tech-nique only appropriate for extremely large datasets, or is the data available from traditional course manage-ment systems suitable as well?
• Can more sophisticated temporal manipulations increase the accuracy of models? For instance, does describing a time period as if it were a continuous distribution with a given skew and kurtosis create a useful interac-tion pattern?
• Can date patterns be generated from the underlying data instead of through top down direction as we have done? We chose combinations of days, three day se-quences, weeks, and months as levels of granularity for feature extraction, but it does not seem unreasonable
that other segments may also be useful. Is it possi-ble to derive this from the interaction data directly, leading to less arbitrary time divisions?
5.
REFERENCES
[1] J. Anderson. Rules of the mind. 1993.
[2] K. E. Arnold and M. D. Pistilli. Course signals at purdue: Using learning analytics to increase student success. In Proceedings of the 2Nd International Conference on Learning Analytics and Knowledge, LAK ’12, pages 267–270, New York, NY, USA, 2012. ACM.
[3] B. S. Bloom, M. Engelhart, E. J. Furst, W. H. Hill, and D. R. Krathwohl. Taxonomy of educational objectives: Handbook i: Cognitive domain.New York: David McKay, 19:56, 1956.
[4] S. Bull, J. E. Greer, G. I. McCalla, L. Kettel, and J. Bowes. User modelling in i-help: What, why, when and how. InUser Modeling, pages 117–126, 2001. [5] Carnegie Learning. The Cognitive Tutor: Applying
Cognitive Science to Education. Technical report, Carnegie Learning, Inc., Pittsburgh, PA, USA, 1998. [6] K. J. Gergen. The social constructionist movement in
modern psychology.American psychologist, 40(3):266, 1985.
[7] A. C. Graesser, P. Chipman, B. C. Haynes, and A. Olney. Autotutor: An intelligent tutoring system with mixed-initiative dialogue.Education, IEEE Transactions on, 48(4):612–618, 2005.
[8] M. Hall, E. Frank, G. Holmes, B. Pfahringer, P. Reutemann, and I. H. Witten. The weka data mining software: An update.SIGKDD Explor. Newsl., 11(1):10–18, Nov. 2009.
[9] E. J. M. Laur´ıa, E. W. Moody, S. M. Jayaprakash, N. Jonnalagadda, and J. D. Baron. Open academic analytics initiative: Initial research findings. In
Proceedings of the Third International Conference on Learning Analytics and Knowledge, LAK ’13, pages 150–154, New York, NY, USA, 2013. ACM.
[10] B. Martin. Constraint-based modelling: Representing student knowledge.New Zealand Journal of
Computing, 7(2):30–38, 1999.
[11] S. Ohlsson. Learning from performance errors.
(a) Histogram of quiz accesses by day for the first course offering.
(b) Histogram of quiz accesses by day for the second course of-fering. Note the lack of data starting around day 17, leading to inaccurate predictions from the original trained model.
(c) Histogram of forum accesses by day for the first course offering.
(d) Histogram of forum accesses by day for the second course offering. Note the lack of data starting around day 17, leading to inaccurate predictions from the original trained model.
(e) Histogram of lecture video accesses by day for the first course offering.
(f) Histogram of forum accesses by day for the second course of-fering. Note the rough similarity in shape of the history compared to Figure 4e, (left) suggesting feature extraction for this resource may be appropriate.
Figure 4: Histograms of resource accesses for the two courses. The histograms on the left side represent the accesses for the first course, which were used to create the original predictive model. The histograms on the right side represent access for the subsequent course. The three resource, quizzes, forum messages, and lecture views, are read from top to bottom. Of particular note is that only the histograms for the lecture resource (Figures 4e and 4e) appear to be similar, suggesting a model trained on all resources would have a low predictive accuracy.