Contents
Executive Summary 1
1. Introduction and Background 11
2. State of the Nation: Debt and Household Incomes 13
Debt and gender differences 16
Debt and family size 17
3. Identifying Financially Vulnerable, Low Income Households 19
Financial vulnerability and debt 21
Households facing mortgage difficulties 23
Households in arrears and/or facing financial difficulty 24
Structural arrears and repayment difficulties 27
The link between high levels of debt, financial vulnerability and savings 28
The role of unsecured debt in financial vulnerability 28
Making ends meet - the role of credit 29
Financial awareness and financial vulnerability 30
Developing an overall picture of financial vulnerability 30
4. Prospects for Financially Vulnerable and Low Income Households 35
Impact on incomes 36
Impact of changes to the UK tax and benefit system 37
Impact of inflation on financially vulnerable groups 38
Impact of potential interest rate rises on homeowners 39
UK storing up problems for the future as household debt projected to rise 41
5. Consumer detriment and Policy Interventions 43
Better lending practices and risk assessment 43
Better regulation of consumer credit 43
The need for early intervention 45
The role of debt advice 45
The need for better intelligence 46
ANNEX I: DETAILED PROFILE OF CCCS CLIENTS 48
ANNEX II: SUMMARY OF FINANCIALLY VULNERABLE HOUSEHOLDS 50
INTRODUCTION AND BACKGROUND (SECTION 1)
• National debt charity Consumer Credit Counselling Service (CCCS) commissioned a series of three reports called Debt and The Family which will look at the impact of debt and changing economic conditions on financially vulnerable households in the UK. This first report - Debt and Household Incomes – looks at the position of the two main groups of households who seem most at risk – benefit reliant/ lowest income households and lower-medium income households (sometimes referred to the ‘squeezed middle’). The focus is on household incomes as this determines levels of debt and ability to service debt costs. However, we have also looked at the position of specific groups in society such as lone parents, the unemployed, households who rent, and consumers with low levels of financial capability as this can be a more effective way of structuring any necessary policy interventions.
• The next report, called Debt and the Generations, follows in September 2011, with the last in the series, Debt in the Regions, in December 2011. The regular contact CCCS has with thousands of people provides it with a unique insight into how living with debt affects financially vulnerable households. It is hoped that these reports stimulate debate about the role of debt in society and, critically, inform the formulation of policy so these groups get the help and support they need.
STATE OF THE NATION: DEBT AND HOUSEHOLD INCOMES (SECTION 2)
• Consumer credit is a necessary and useful part of modern living - when managed well. However,
in the decade in the run up to the financial crisis, many UK households accumulated huge levels of personal debt. Total UK personal debt stood at over £1.4 trillion at the end of 2010. £1.24 trillion (85%) was accounted for by secured debt (primarily mortgages) along with £216 billion (15%) of unsecured debt.
• Growth in total personal debt has stalled and indeed fallen slightly since the peak in January 2010. However, debt as a proportion of household incomes is set to rise if the official forecaster the Office for Budget Responsibility (OBR) is right in its projections. The OBR is projecting total personal debt to rise from the current level equal to 160% of household incomes to 175% of household incomes by 2015.
• Dealing with this legacy of personal debt is now one of the major public policy challenges facing government, policymakers, regulators, the financial services industry, charities who look after the interests of vulnerable households and, of course, consumers themselves.
• As a nation, in the medium-long term, we face a major challenge converting the UK from a debt culture to a savings culture. The debt legacy will act as a drag on the wider economy and the personal finances of many households undermining their ability to save for the future or build up a pension. We estimate the average interest rate paid on this debt to be 4.6% - as a nation the UK is paying £67 billion in interest payments alone. But the growth in average earnings is not expected to keep up with inflation leading to real fall in earnings. So, in
effect, the earnings growth of many households will not even keep pace with the accumulating interest on loans.
• However, the more pressing problem – and the focus of this report – is the plight of households who are financially vulnerable because of overindebtedness and/ or whose financial circumstances are likely to deteriorate as a result of changing economic conditions such as unemployment, high inflation, reduced real incomes, increases in borrowing costs and deficit reduction measures.
• It is important to note that households are not homogenous and are affected by debt in different ways. Most households are not affected by overindebtedness – indeed the debt position for many households (especially those with variable rate mortgages) has improved due to the fact the benchmark base interest rates have been held at 0.5% for more than two years now. Moreover, 30% of households do not have any credit and most households do not have a mortgage (11.3 million mortgages in a population of 27 million households).
• Nevertheless, it is clear that a significant proportion of households appear to be seriously overindebted. Moreover, while higher income households, not surprisingly, have more debt outstanding, lower income households are significantly more ‘leveraged’ – that is, their debts are much greater as a proportion of their incomes. Indeed, some of the levels of debt are quite astonishing. For example, households on incomes of £13,500 or less had total debts worth 6.4 times income (as at end 2009). In comparison, households with incomes between
£30,000-£50,000 had total debts worth just under two times income.
• Analysis of CCCS data shows that households with incomes of £13,500 and under have an unsecured gearing ratio (that is, total unsecured debt to net income) of 120%1. So, their unsecured debts are worth 20% more than their annual net income. The gearing ratio for households earning between £25,000-£50,000 is 95%.
• The figure is even more striking when it comes to households with secured debt. According to CCCS data, clients with incomes of £13,500 and under have total debts worth 14 times their net incomes. By comparison, the figure for clients with incomes between £25,000-£50,000 is just over six times.
• There are significant gender differences in terms of the levels of debt owed by women and men. Analysing CCCS data shows that the median unsecured debt owed by male clients is just over £15,000 compared to £11,800 owed by female clients. Male clients owe £115,000 secured debt compared to £102,000 for female clients. • Another important indication of
over-indebtedness is debt servicing costs – ie. what proportion of their incomes households are spending servicing debts. Research by the Bank of England estimates that 13% of households are spending more than 35% of their incomes on debt repayments. Other government research has found that 18% of households with unsecured debt are spending more than one-fifth of their incomes servicing unsecured debt repayments.
IDENTIFYING VULNERABLE HOUSEHOLDS (SECTION 3)
• The purpose of this report is to identify households most financially vulnerable as a result of overindebtedness and/ or deteriorating economic and financial circumstances. To do this we have analysed existing research studies to estimate how many households could be defined as vulnerable in terms of being in financial difficulties or at risk of getting into financial difficulty. The indicators we focused on include: households with high debt-income ratios (secured and unsecured); high debt servicing costs; households in arrears; or struggling to pay debt and other bills. We also identified specific vulnerable groups including: low income households; households with no/ little savings to fall back on; single parent households; the unemployed; households who rent; and consumers with low levels of financial awareness/ capability.
• We have provided estimates of the number of households affected in each category but it is worth highlighting some key points. Overall, analysing the available research leads us to conclude that some 6.2 million households are either already in financial difficulty (3.2 million) or at risk of getting into financial difficulty (three million).
• In terms of specific vulnerable groups, we estimate that: two million households with low incomes (under £13,500); 4.3 million households with no savings and 1.1 million households with savings under £1,000; 2.2 million debtors in mortgage; 2.9 million renters; around 600,000 lone parent families; and 1.1 million unemployed are financially vulnerable. It is important to note that the numbers of
vulnerable households in these specific groups do not add up to the overall total as individual households can fall into a number of categories. • Households with mortgages are a worrying
category and we believe that the number of mortgages in financial difficulty is seriously underestimated. Comprehensive data is difficult to obtain. However, we have analysed published FSA data and we estimate that of the 11.3 million outstanding mortgages, 1.2 million (11%) are in some form of distress – whether in arrears, already repossessed or subject to forbearance by lenders. This is much greater than the 2.5-3% of mortgages considered to be in arrears or repossessed that is widely quoted. That we should have this many mortgages underperforming in a sustained low interest rate environment is a real cause for concern. Households with high loan-to-value (LTVs) appear to be particularly vulnerable. Research by the Bank of England estimates that between 2009 and 2010 the proportion of households with high LTV mortgages with unsecured debt rose from 68% cent to 92%2. • Sub prime mortgage borrowers (more likely to
be on low or uncertain incomes) are especially vulnerable. According to FSA data, 28.5% of mortgages sold to credit impaired borrowers and 23.5% of loans sold by specialist lenders between 2005-09 are in arrears or repossession compared to 6.5% for mortgages overall, sold over the same period.
• The fact that benchmark base interest rates have been at 0.5% for more than two years now has protected many overstretched homeowners. Our analysis shows that a rate rise of 1% would hit a typical borrower with an average mortgage
for an extra £77 per month. CCCS data shows a clear decline in the monthly budget positions of homeowners in the lowest income group from 2005-10, from an average (or median) surplus of £51 (£65) in 2005, to -£450 (-£261) in 2010 (their position gets progressively worse year on year. From 2007, clients in the £13,500-£25,000 income band start finding themselves with a monthly deficit). Many households are just about breaking even and even a small increase in monthly expenditure would tip them into recurring debt unless they are able to make savings elsewhere.
• Analysis of CCCS data, suggests that since the recession, people in the lowest income bands have slipped even further away from being able to repay their unsecured debts – ie. they have a deficit at the end of the month. Low-income households are far more highly geared (as measured by debt-income ratios) than debtors higher up the income scale. With nothing left at the end of the month, they are particularly vulnerable to further rate hikes on unsecured loans forcing them into arrears.
• Similarly, a quarter of those in the medium-higher income band (£25k - £50k) are struggling to make their unsecured debt repayments (the first quartile income surplus/ deficit figure has hovered around £0 for the past few years). Homeowners in this income band have struggled even more, with almost a quarter struggling to meet mortgage payments and seem to be almost constantly on the verge of needing some kind of forbearance with their mortgage. • ‘At risk’ clients are living hand-to-mouth on
credit much more than those already in financial
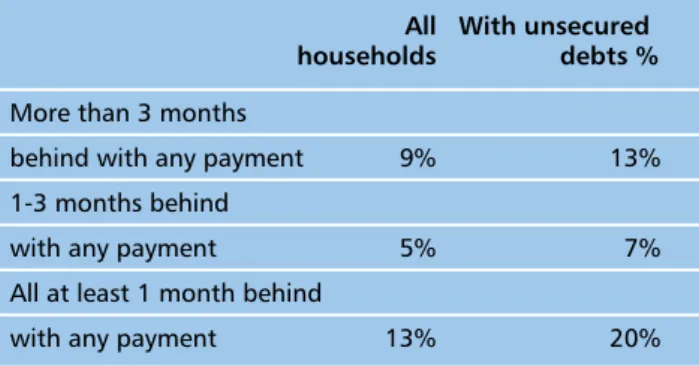
difficulties (ie. in structural arrears). They are significantly more likely to be constantly overdrawn or use credit “all the time” while being much less likely to seek debt advice (7% vs 22%). A high level of unsecured debt is a clear indication of financial vulnerability. Households with unsecured debts are much more likely to be more than three months behind with a payment than households generally.
THE FUTURE IS NOT BRIGHT (SECTION 4)
• Much of the existing research is, by nature, historical. However, we also wanted to explore how the future looks for financially vulnerable households. Although the position of many households worsened last year, we seemed to be living through a ‘phoney war’ during 2010. The much feared large rise in overindebtedness, mortgage arrears, and repossessions did not materialise as expected given the record levels of personal debt as we entered the financial crisis. However, there is no room for complacency. The lower level of arrears and repossessions is not due to the fact that consumers were less exposed to high levels of debt than previously feared (this is clearly not the case). Seriously higher levels of arrears and repossessions have been averted through a combination of unprecedented, concerted interventions by the government, regulators and Bank of England (at the macro-economic level through sustained low levels of interest rates and quantitative easing, and micro-level through various schemes to protect borrowers such as the Support for Mortgage Interest scheme) and, of course, welcome forbearance by lenders.
• According to research by the Department for Business Innovation and Skills (BIS), 40% of
households said their financial circumstances had got a bit or much worse in the past six months (2009/10). But we fear that vulnerable households are at greater risk from a number of factors including: sustained, higher levels of inflation; the interest rate cycle changing with interest rates rising to control inflation; reduced real wages and incomes (which according to the Governor of the Bank of England will see a fall in real earnings not seen since the 1920s); and a range of deficit reduction measures amounting to the tightest period for public spending since World War II.
• Income inequality in the UK grew over past the decade, driven by trends at the very top and bottom of the income scale. Real median earnings grew by 56% over the period from 1978-2008 (equal to 1.49% per annum). However, real earnings for the 90th percentile doubled over the same period (equal to 2.3% per annum over the period), while earnings at the tenth percentile grew by only 27% (equal to 0.8% per annum) – barely keeping pace with inflation. It would seem that living standards have been supported by a greater reliance on personal debt.
• Moreover, the gap would have been more pronounced without tax and benefit changes offsetting the widening gaps in wages and earnings. Recently, there has been a temporary reduction in income inequality. Moreover, according to the Institute for Fiscal Studies (IFS), average household incomes actually rose during recession, as the fall in earnings from employment was more than offset by rise in benefits. However, we may now see a significant fall in real incomes over coming years for
vulnerable households while inequality in real incomes is expected to widen again due to cuts in benefits and tax credits and different inflation rates experienced by different households. • Moreover, a survey published in 2011 suggests
11.3 million UK households (44%) are dependent on more than one salary to cover bills, and of the 6.6 million UK households with dependent children, four million are reliant on two or more salaries (60%). It would seem reasonable to assume that many lower-medium and medium income households’ incomes have been keeping their heads above water as a result of having two salaries to rely on. If the household loses one of these salaries, this could have a disproportionate impact given the level of outstanding debts to be repaid.
• Changes to the UK tax and benefit system announced in recent budgets will have varying impacts on different households. There are concerns that these will hit lowest income households hardest. This is borne out by analysis undertaken by the IFS. It shows that, with the exception of households in the highest income decile, tax and benefit changes will indeed hit lower-medium income households harder than medium-higher income households. The poorest households are projected to see their household incomes reduced by 3.5% in 2012/13 compared to 2.1% for households with incomes in the fifth decile. The position for the poorest households gets worse with incomes falling by 6.3% in 2013/14 compared to 3.8% for the fifth decile incomes households.
• Inflation is also a concern. The Consumer Price Index (CPI) is forecast to rise to 5% by the
end of 2011. However, it is important to note that different households experience different levels of inflation. Poorer households spend proportionately more on necessity goods such as food and fuel and so are limited in their ability to cut back on spending if finances deteriorate. According to the most recent data, benefit reliant households spend 17.4% of their household budgets on food compared to 10.1% for other households, and 7.1% of budgets on fuel compared to 4.1% for other households3. Households in the lowest income decile spent on average 16.4% of their budget on food, compared with 7.9% for those in the highest income decile. Lowest income decile households spent 11% of their household budget on utilities (water, gas, and electricity, and other fuels) compared to 4% for the highest decile. In contrast, lowest income deciles spent 12% of budgets on leisure goods and services compared to highest income deciles that spent 23.8%.
• According to Consumer Focus, on average, lower-income households experienced higher inflation rates over the last decade than higher-income households. The second lowest higher-income decile experienced the highest average inflation rate over the period 2000 to 2010, with a rate of 3.5% compared to the highest income decile, which experienced an inflation rate of 2.9 per cent (the lowest rate)4. Inflation as measured by the CPI is forecast to rise to 5% by the end of 2011. However, the concern is that due to rising commodity and fuel prices, the inflation rate for necessity goods will be comparatively higher in the future as well so disadvantaging even further households on lower income groups. For example, electricity prices are projected to rise
by 14.5%, with gas prices increasing by 19.7% in real terms from 2010-2015.
• As a result of the financial crisis and to avoid the risk of further economic slowdowns, the Bank of England has maintained base rates at 0.5% for over two years. This has clearly benefited many households with a mortgage. Households with a typical mortgage have been saving £76 a month. Households with mortgages that fall in line with benchmark interest rates have seen their payments fall by nearly £160 per month. However, even though many homeowners have been making considerable savings due to low interest rates, significant numbers of households are reporting housing payment problems. The proportion of households reporting payment problems is close to the level seen in 1995 – even though the benchmark Libor rate is around five percentage points lower now than it was in 1995. We modelled how much extra homeowners would pay if mortgage costs rose by various amounts. We estimate that if rates rise by 1%, then the typical borrower with an ‘average’ mortgage would pay an extra £77 per month.
• This may not seem like a major increase in payments. However, as the available research presented in the report shows, significant numbers of households appear to be just ‘getting by’ as they are already struggling to pay bills and/ or have very high debt repayment-income ratios. Worryingly, as the detailed analysis of CCCS data suggests, an increase in mortgage costs of this level would badly affect the most financially vulnerable households. The lowest income households are already in deficit on their monthly income/ expenditure so their
3 See IFS Commentary C119, The spending patterns and inflation experience of low-income households over the past decade, http://www.ifs.org.uk/comms/comm119.pdf
position would be exacerbated. The median household with mortgage debt in the lower-medium income (£13,500 - £25,000) band is just about breaking even – any increase in mortgage costs would push these households into deficit each month unless they could find savings elsewhere.
• Households on medium-higher incomes (£25,000 - £50,000) do have a cushion to withstand increases in mortgage rates. However, even then, one-quarter of households in this band have zero income left at the end of the month (as identified by quartile one) so an increase in mortgage rates would also push this group into monthly deficit.
CONSUMER DETRIMENT AND POLICY INTERVENTIONS (SECTION 5)
• As well as being at risk of overindebtedness, financially vulnerable households will be increasingly exposed to a range of detrimental market practices including: poor arrears management practices in the sub-prime market; aggressive targeting by commercial debt management providers; poor compliance and regulation of debt management firms; weak consumer credit regulation generally – advertising of consumer credit, licensing, monitoring and enforcement; and limited access to fair, affordable credit availability and an increase in sub-prime lending, or worse illegal lending. At this critical juncture, there is a risk of a regulatory hiatus as the Financial Services Authority (FSA) and Office of Fair Trading (OFT) undergo major transformation, while not-for-profit debt advice providers other than CCCS are under pressure as a result of resource constraints.
• A significant number of households in the UK are either already in serious financial difficulties or on the way to getting into financial difficulties. This raises some important and challenging questions: are financially vulnerable consumers getting the advice they need when they are in financial difficulty? And, are policymakers and the advice sector doing enough to identify and intervene early and effectively to prevent financially vulnerable households from getting into serious financial difficulty?
• Despite the best efforts of debt advice charities, the majority of financially vulnerable consumers for a number of reasons are not actually getting professional debt advice – even those who seem to be in serious financial difficulty. According to BIS research, only 7% of respondents to a survey who said they had some difficulties keeping up with bills and payments in 2009/10 sought professional debt advice in the preceding six months. For those who said they were constantly struggling or were falling behind with payments the figure was 13%.
• We estimate that 6.2 million households in total could be classified as financially vulnerable. In terms of the largest categories, around 4.3 million households with no savings, 2.9 million households who are renting, 2.2 million with a mortgage, and two million with incomes under £13,500 are financially vulnerable. However, the major debt advice charities dealt with an estimated 1.3 million clients in 2010.
• The single biggest reason why households had not sought debt advice appears to be that the person in difficulty does not feel s/he needs advice. Lack of awareness of the availability of
services does not appear to be the major barrier. Of course, many individuals will be perfectly capable of resolving their own problems. However, it must be cause for concern that so many households in that position are not either seeking advice or are not being reached by debt advice charities. More work is required to understand: why ‘self-treating’ is such the preferred option; how well those households are ‘self-treating’; the type of remedial action taken by those households and how successful the action is; and why professional advice from debt charities is not sought by so many – what are the barriers to access, attitudes and preferences and so on.
• The causes of overindebtedness have been debated in great detail elsewhere. There is a shared responsibility for the state we are in – lenders and agencies such as credit rating agencies can be criticised for allowing reckless and irresponsible lending; government and regulators failed to manage the availability of credit in a sustainable way; and of course, consumers themselves must share some blame for not behaving responsibly.
• But, the question must be asked: how could so many financially vulnerable, low income households end up with such high levels of debt gearing and multiple credit commitments which have left them in a seriously vulnerable position? It points to a failure of lenders’ risk assessment systems and regulation when it comes to vulnerable households.
• Whatever the causes, we need to develop a policy response to deal with the levels of overindebtedness and protect millions of financially vulnerable
households who are vulnerable to consumer detriment. Therefore, we are proposing a range of interventions including better statutory and self-regulation, public awareness initiatives and government interventions.
• A priority is for the FSA to disclose in more detail data on arrears, repossessions, numbers of borrowers participating in various mortgage support schemes, and in forbearance. The current approach followed by the Council of Mortgage Lenders (CML) which focuses on mortgages in arrears understates the scale of households in financial distress with their mortgage. This data should be profiled according to household income, region, length of mortgage, and age. To improve lending practices and encourage responsible behaviours by consumers, CCCS should work with lenders to gain a better understanding of how so many households – especially on low-medium incomes - were able to obtain such high levels of credit and/ or multiple credit commitments.
• Commercial debt management plan providers have been a real source of concern for campaigners due to the high level and structure of charges, and in some cases, unfair practices. The potential for future detriment is huge given the level of overindebtedness and financial vulnerability of millions of households identified in the report. Current regulation of debt management plans (DMP) is ineffective. New regulation is urgently needed including regulating the level of charges and pricing structure with tougher controls on the marketing and promotion of DMPs. All lenders should commit to ‘hot-key’ borrowers to debt advice charities, not to commercial DMP providers.
• A new approach to regulating consumer credit is needed to protect financially vulnerable consumers. Financially vulnerable consumers are more likely to be excluded from financial markets in the first place; if they do have access, they are more likely to be ripped off and suffer greater detriment disproportionate to their incomes; the ‘solutions’ to their problems can often compound the original detriment (for example, commercial DMPs) and/or sub-prime loans; and they are less likely to be aware of and obtain due redress.
• Access to fair and affordable credit is a major issue. Significant numbers of low and low-medium income households rely on credit for everyday expenses but have been rejected for credit. This raises grave concerns about the vulnerability of these households to aggressive marketing by legal sub-prime lenders (such as payday lenders) and, worse, illegal loan sharks. • Overall, the regulatory regime that protects
vulnerable financial consumers is much weaker than that available to better off consumers who buy products and services from FSA regulated providers. There is a clear contrast between the level of consumer protection given to consumers under the FSA/ FSMA 2000 regulatory regime and that afforded to consumers who use consumer credit markets under the OFT/ Consumer Credit Act regime with regards to authorisation/ licensing, ongoing ‘conduct of business’ rules, enforcement powers, and regulatory resources. • The proposed Financial Conduct Authority
(FCA) should become the single regulator for consumer credit. All consumer credit providers should be subject to the same authorisation
and conduct of business regulations relating to marketing and selling of consumer credit as lenders currently regulated by the FSA.
• In the interim period, there is a risk of a regulatory hiatus as regulators deal with major transitional challenges. Therefore, we urge the OFT to publish tougher guidance on treating borrowers fairly, increase monitoring and surveillance of the consumer credit markets, and place a greater focus on tougher enforcement of existing regulation. The FSA, OFT, Financial Ombudsman Service (FOS), industry trade bodies and consumer groups should work together to develop best practice compliance statements covering marketing and selling, relationships with consumers, and treating customers fairly. These compliance statements would make it clear the behaviours and practices considered acceptable in retail financial services. These would help consumers and their representatives understand their rights. We believe the market would work better and firms have more confidence if they were able to identify practices which are likely to breach regulations and legislation. Firms should display on their websites: policies and practices; compliance with best practice compliance statements; and remedial actions where breaches have been identified.
• Many lenders should be commended for their fair treatment of borrowers in financial difficulty. However, the approach followed by lenders is inconsistent. Self regulation has an important role to play here. Therefore, we urge CCCS work with lenders and regulators (statutory and self-regulatory) to develop a Be Fair! Charter for lenders based on a set of measures building on
regulatory requirements to ensure borrowers are treated fairly.
• Policymakers, regulators, and debt advice charities should place more emphasis on prevention as well as continuing the important work of helping consumers already in financial difficulty. A small minority of households who are at risk of getting into financial difficulty are seeking advice. Therefore, CCCS, the new Money Advice Service (MAS), government and regulators, and partner charities should set up a debt awareness and debt advice task force with the following objectives:
- identify with more precision those
households who are ‘at risk’ and understand the barriers that prevent those households seeking advice;
- identify new ways of reaching hard-to-reach groups;
- raise awareness of the benefits of getting advice;
- improve the understanding of financial behaviours which cause consumers to become overindebted;
- identify effective early interventions to promote positive behaviours and prevent ‘at risk’ households from getting into financial difficulty; and
- specifically, given the established link between overindebtedness and lack of savings, identify interventions to promote savings.
• We have concerns about the robustness of some of the published research data. Even though the numbers of households who are spending significant amounts of incomes on servicing debts is already large, we are concerned that there may be a degree of under-reporting
on this – particularly on the part of lower income households with low levels of financial awareness. Analysis of CCCS database found simply astonishing levels of debt and leverage ratios in all income ranges but especially amongst lower income groups. The fact that there are twice as many mortgages in forbearance as declared to be in arrears also leads us to fear that the scale of overindedbtedness is seriously underestimated. Therefore, we recommend that government and regulatory authorities (FSA and OFT) undertake and publish a detailed audit of lenders’ loan books, credit rating agency files and a large scale sample of household finances to establish with more precision the scale of overindebtedness and profile of households which are at risk of financial difficulty.
• Data on consumer debt is one of the key themes to emerge from this research. The absence of sufficiently granular data limits detailed comparisons of the current experiences of different households, their potential vulnerability to changing financial circumstances and how those experiences change during different economic cycles. Policymakers and regulators have limited understanding of the consequences of macro or high level policy decisions such as decisions to increase base rates, it inhibits the targeting of finite resources on the most financially vulnerable households and the ability of regulators to pre-empt and prevent market abuse by identifying vulnerable consumers and target interventions. Therefore, we strongly recommend that policymakers, regulators, lenders and CCCS work together to establish comprehensive databases to allow time series monitoring and analysis of household debt.
CCCS is the UK’s leading debt advice charity, best known for providing advice and counselling to individual borrowers in financial difficulty. It has commissioned this series of reports out of recognition that dealing with the existing legacy of personal debt in the UK will be one of the most difficult public policy challenges over the coming years for policymakers, financial regulators, the financial services industry, consumer groups, debt advice charities, and, of course, consumers themselves.
The regular contact CCCS has with thousands of people means the charity has access to invaluable data on how debt is affecting vulnerable households. It intends to leverage this research to raise the profile of some of the most vulnerable households and communities, stimulate debate and influence the policy agenda.
The changing economic environment means that life is likely to get even worse for many vulnerable consumers, large numbers of whom will already be at risk of overindebtedness. The financial health of these vulnerable consumers will be shaped by a range of socio-economic factors such as high inflation, reduced real household incomes and the impact of deficit reduction measures5.
Without the right support and advice, overindebtedness can be devastating for people leading to serious financial and psychological distress. But, overindebtedness has a wider impact on households too. It affects their living standards, ability to save and build up assets, provide for a pension, afford insurance or get on the housing ladder.
As the UK’s leading debt advice charity, protecting and improving the financial health of vulnerable consumers by making sure they get the help they need, developing the necessary policies to protect their interests and, importantly, ensuring their plight is not forgotten is CCCS’s priority.
Central to this mission is good research to identify who is most at risk. The impact of overindebtedness and changing economic conditions will be felt in different ways by specific groups of consumers. The two main categories that seem most obviously vulnerable are:
• Lowest income, benefit reliant households; and • lower to medium income households (sometimes
called the ‘working poor’ or the ‘squeezed middle’).
If we are to target interventions to greatest effect, it is important that more is known about which specific groups of consumers are likely to be worst affected by changing economic conditions.
Therefore, CCCS has asked the Financial Inclusion Centre (The Centre) to produce a series of three major linked reports on the theme of Debt and The Family.
The Debt and The Family series will consist of the following specific reports:
• Debt and household incomes - to be published in July 2011
• Debt and the generations - to be published in September 2011
• Debt in the regions - to be published in December 2011
This report is structured as follows.
5 For a fuller assessment of the economic conditions see CCCS Statistical Yearbook 2010,
1. IntRoDUCtIon AnD BACKGRoUnD
Section 2 provides a synopsis of the available research on the debt profile of different households in the UK with a focus on the lowest income/ benefit reliant groups and lower-medium income groups. This is based on published research along with detailed analysis of CCCS data.
Section 3 identifies those households who are most financially vulnerable. We have categorised financially vulnerable households into two groups: • Financially vulnerable – that is, financial
vulnerability is due to low incomes, high levels of debt, current financial circumstances or potential deterioration in circumstances; and • Socially vulnerable – that is, the financial
vulnerability is associated with specific group characteristics such as lone parents, unemployment, renters, low levels of financial awareness and so on. This report is focused on household incomes but in terms of policy interventions it may be better to use group characteristics as it creates the potential for partnership work with charities that represent the interests of these vulnerable groups.
Various indicators of financially vulnerability are used to estimate the number of households who are already in financial difficulty or at risk of getting into financial difficulty. This includes households with high debt-income ratios, high debt repayment-income ratios, households in arrears on payments, households with no or little savings and/or who rely on credit to make ends meet.
Section 4 considers the prospects for financially vulnerable households at risk from a number of factors including:
• sustained, higher levels of inflation;
• the interest rate cycle changing with interest rates rising to control inflation;
• reduced real wages and incomes (which according to the Governor of the Bank of England will see a fall in real earnings not seen since the 1920s); and
• a range of deficit reduction measures (cuts in benefits / tax credits) amounting to the tightest period for public spending since World War II. Finally, Section 5, proposes some policy interventions to protect the interests of the vulnerable groups identified during the research.
Annex I contains a summary of key facts from the CCCS databases. Annex II contains a synopsis of the financially vulnerable groups we have identified. Annex III contains additional tables and charts we refer to in the report. This is produced as a separate statistical Annex. All CCCS figures in the report are based on clients counselled by the charity via the telephone in 2010.
The report was researched and written by Mick McAteer, Gareth Evans, and Anna Gavurin of The Financial Inclusion Centre with additional support from Mark Haslam and Joseph Surtees from CCCS. We welcome any comments on the research and conclusions. Please contact:
Before considering the impact of personal debt on financially vulnerable households, it is worth reminding ourselves how we got to the position we are in. Chart 1 below shows how total household personal debt has grown over the past 15 years to 2010.
Total household debt as at the end of 2010 stood at £1.45 trillion and has been showing signs of levelling off. Indeed there has been a slight decline from the peak of £1.46 trillion which was reached in January 2010. However, as we will show, total debt is forecast to rise again considerably by the official forecasters the Office for Budget Responsibility (OBR) – see Section 3.
The bulk of total personal debt is made up of debt secured on property (mainly mortgages). Outstanding mortgage debt makes up £1,238 billion (85%) of total household debt, with total unsecured debt amounting to £216 billion (15%). Chart 1: Total personal debt reached £1.45 trillion by 2009 but has levelled off
Source: Bank of England, Credit Action
However, it is important not to look at the growth of debt in isolation. The growth in total personal debt has far outstripped the growth in average earnings (see Chart 1, Annex III).
Total outstanding personal debt increased by around 220% over the 15 years to 2010 (an annualised rate of 8.1% per annum), yet average earnings grew by 75% over the same period (an annualised rate of 3.8% per annum). So, personal debt grew at more than twice the rate of average earnings over the period. Households have become significantly more leveraged.
Care must be taken when comparing growth in debt with growth in average earnings. The ability to service debt is important along with total exposure to debt. For example, there has been a growth in the number of households with two earners which means that some households would have been able to cope with greater amounts of debt. Moreover, benchmark interest rates (and therefore mortgage rates) have been at historically low levels with base rates having been held at 0.5% for 24 months. This makes greater levels of debt more manageable. Furthermore, some would argue that household assets should be taken into consideration when assessing the overall vulnerability of UK households to overindebtedness. However, we would argue that this is not particularly helpful. To begin with, much of the assets held by UK households are in the form of unrealised property gains. The debt/ assets relationship is generationally skewed, that is, older households have lower debts and greater assets as a result of unrealised property gains.
Moreover, to a large extent, much of these property related assets are not ‘real’ in the sense that they have to be realised in some way to have any tangible benefit for households. The nominal value of property wealth can fall in value very quickly in response to market conditions.
However, debt doesn’t disappear unless it is actually written off. It used to be a widely held view that debt could be ‘inflated away’ through high inflation. But, this only really works if wages rise faster than inflation so as to reduce the burden of debt as a proportion of real incomes. However, as we set out below, in this current economic
environment, wages are unlikely to keep pace with inflation over the next few years.
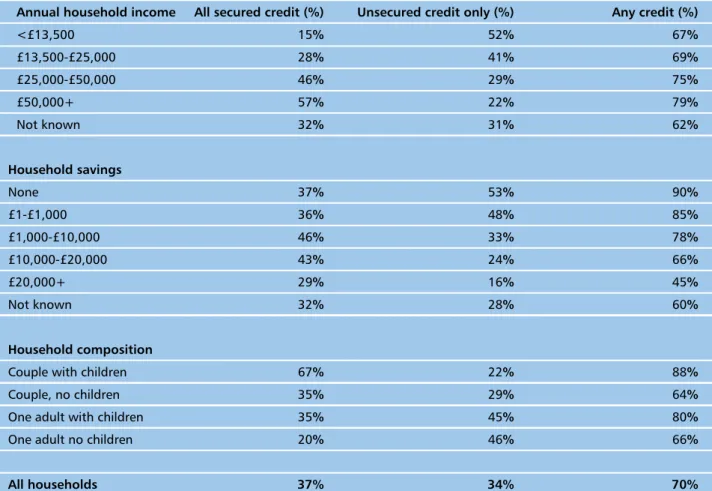
It is also important to acknowledge that households are not homogenous and the debt ‘burden’ is being felt very differently by different households as are risks of being exposed to detrimental practices. It is worth saying that debt is not a major issue for the majority of households in the UK. The majority of households in the UK do not have a mortgage. There are 11.3 million mortgages outstanding in a population of 27 million households.
Table 1: Use of secured and unsecured credit
Annual household income All secured credit (%) Unsecured credit only (%) Any credit (%) <£13,500 15% 52% 67% £13,500-£25,000 28% 41% 69% £25,000-£50,000 46% 29% 75% £50,000+ 57% 22% 79% Not known 32% 31% 62% Household savings None 37% 53% 90% £1-£1,000 36% 48% 85% £1,000-£10,000 46% 33% 78% £10,000-£20,000 43% 24% 66% £20,000+ 29% 16% 45% Not known 32% 28% 60% Household composition
Couple with children 67% 22% 88%
Couple, no children 35% 29% 64%
One adult with children 35% 45% 80%
One adult no children 20% 46% 66%
All households 37% 34% 70%
On the other hand, many lower income households which rent in the social housing or private sector may not have a mortgage but have disproportionately high unsecured debts – often from the sub-prime or illegal lending sector.
There are also generational issues to consider. There is a clear debt lifecycle evident with debt
as a proportion of earnings reducing over time as borrowers pay off debts and/or benefit from earnings growth. This generational element will be dealt with in the next report, Debt and the Generations. There are also regional differences to be considered. Similarly, these will be dealt with in the last report in the series, Debt and the Regions.
CASE STUDY – ROBERT*, 42, (LONDON)
Robert lost his job in November 2011. His limited savings were quickly eaten up through his ongoing living costs.
“My income went right down almost overnight but my outgoings stayed exactly the same.”
Being single he had no other income to fall back on. He applied and now receives Job Seekers Allowance: “This gives me about £132 each week
but I was earning over £1,250 a month, so my income has dropped by nearly two thirds. I’ve always budgeted and was managing to keep up with my credit repayment which came straight out of my bank account. Almost three quarters of my wages went on my repayments and my bills.”
Robert has six credit cards with four different banks totalling over £13,000.
“As soon as I lost my job I contacted all my creditors, cancelled my direct debits and tried to work out what I could afford to pay each of them. Some were happy but one or two just didn’t understand and were not willing to accept my repayment.”
He had taken out Payment Protection Insurance but has been told that he is unable to claim, which he feels really angry and frustrated about. In terms
of his financial future, he says he must find work but it is a very difficult climate: “I’m looking for
work but there’s nothing out there that pays a similar level to what I was earning. It’s definitely an employers’ market.”
He is also concerned about the cost of living:
“The VAT hike and inflation are both major issues. Shopping feels so much more expensive than a year ago. The same basket of shopping that would have been £70 or £80 is now over £100. I’m not taking about luxuries, everyone’s got to eat!”
The impact of his financial situation has left Robert feeling worried about the future: “It’s a
hard situation. I’m worried about my debts and the constant phone calls and letters threatening debt collectors. I’m always thinking about how I will pay the next bill.”
Robert saw the commercial adverts on the TV offering help with debts: “They say they’ll help
you out but it costs a lot.”
So his brother recommended speaking to CCCS:
“It was free and they gave good advice. I could go bankrupt but I couldn’t afford the fee, so I’ve decided to make token payments until I get back into work and can pay off the credit card.”
Of those households that are in debt, 33% have debts greater than their annual household income. 20% of all households with debt have debts worth more than twice their annual household income (see Table A5, Annex III).
Households with higher incomes have on average higher total amount of debt. For example, households with annual household incomes over £60,000 have average total debts of £81,000, whereas households with incomes between £9,500 and £17,500 have debts of £19,000 (see Table A1, Annex III).
This is not surprising as households with higher incomes should have higher living standards to maintain and access to greater nominal levels of credit than lower income households. However, nominal outstanding levels of debt do not tell us much about financial vulnerability. Once household incomes are factored in, lower income groups are more exposed to personal debt (i.e. they owe more debt as a proportion of income than medium or higher income groups).
This is reflected in the income profile of CCCS clients. Two thirds of CCCS clients have net incomes of £20,000 per annum or less, 27% of CCCS clients have a household income of less than £10,000 per annum - the medium income in the UK is currently £24,000 per annum (see Table A2, Annex III). The higher leverage of lower income clients, especially with regards to unsecured debt, is covered in more detail below. However, analysis of Bank of England and CCCS data demonstrates that while clients on higher incomes have higher outstanding debts, lower income clients have much higher gearing ratios as measured by debt-income ratios. The conclusion that lower income households
are more highly geared is supported by detailed analysis of CCCS databases (see Section 3). The level of gearing of low income clients is quite striking in some cases.
The ‘median’ lowest income client has total unsecured debts worth 20% more than their annual income. For the lowest income clients with secured debts, the figure is even more striking. The median lowest income client has unsecured debts worth 90% more than their annual income. When secured household debt is taken into account for those households, the total debts outstanding are a staggering 14 times their annual income. The gearing ratios for the lowest income clients are far in excess of the ratios for medium to higher income clients.
DEBT AND GENDER DIFFERENCES
Analysis of the CCCS database shows significant differences between the levels of debt owed by men and women. In almost every category of debt we looked at, men owe significantly more than women. The exception is the median credit card debt owed by women earning under £13,500, which is over £7,000 compared to over £4,000 for men (see Table A3, Annex III).
There may be a number of possible explanations for the higher debts owed by men:
• This may reflect the reality that the main earners in most UK households are men and therefore they will apply for credit in their name;
• It may be that men and women exhibit very different financial behaviours when it comes to debt with men being more ‘reckless’ and women more cautious; or
• It may be that women are more willing to recognise problem debts at an earlier stage and approach CCCS to get support.
It would be interesting to undertake further analysis on this to see if there are real gender differences in financial behaviours.
Of course, it is important to note that while women appear to have less debt outstanding than men (certainly based on analysis of CCCS data), single parent households are amongst the most financially vulnerable groups and these households are predominantly headed by women (specific vulnerable groups are considered in more detail in Section 3).
DEBT AND FAMILY SIzE
Not surprisingly, the number of children in a household is closely linked to the level of debt held by the household. Households with three dependent children carry over £13,000 of unsecured debt for three months compared to £7,000 for households with no children (see Table A6, Annex III).
LOwER INCOME, HIGHER GEARING
Lower income households have significantly higher levels of gearing than medium and higher income household groups. It is also important to consider the impact of unsecured debt together with secured debt to fully understand the total gearing of lower income households. As Chart 2 shows, as of 2009, households on incomes of less than £15,500 with secured debt have debt-to-income ratios (DTI) of around 5.5 to one, rising to 6.4 to one when unsecured debt is included. Households in the £30,000 - £50,000 bracket had DTIs of 1.1 to one on secured only basis and 1.95 including unsecured debt.
The ratio of total debt-to-income is important. It gives an indication of the total exposure of households to changes in financial circumstances
(such as higher interest rates) or the extent to which debt affects ability to save for the future and so on. However, a more useful indicator of immediate vulnerability is the cost to households of servicing existing debts.
Of course, the two indicators should be considered together. Cuts in interest rates will reduce debt servicing costs, significantly so and for sustained periods, as we have seen with the maintenance of bank base rates for more than two years. Conversely, rises in interest rates will usually increase debt servicing costs.
Even if debt servicing costs are reduced, this does not necessarily reduce the total amount of debt outstanding (i.e. the traditional escape route provided by inflating away outstanding debt does not seem to be there at the moment) unless households use the opportunity provided by lower debt servicing costs to pay down outstanding debts.
Chart 2: Unsecured debt needs to be included to understand real levels of gearing as measured by debt-to-income (DTI) ratios
Source: NMG, FSA calculations, 2009
It is difficult to establish whether households generally are paying down debt. However, if the
OBR is to be believed, UK households generally will continue to have to rely on credit to maintain levels of consumption and as a result personal debt as a proportion of household disposable income is expected to grow from the current 160% level to 175% by 2015 (see Section 4 below).
The OBR’s projections on household debt are somewhat contentious as the level of household debt as a proportion of income would be significantly greater than that evident before the lead up to the financial crisis and subsequent recession.
Even so, it should be noted that the overall interest rate paid on outstanding debt in the UK is around 4.6% per annum (leaving aside any repayments of principal). ‘Average’ earnings are not keeping pace with the rate at which debt interest is accumulating. So it may be sensible to assume that households may, at the aggregate level, be forced to look to increase levels of debt to maintain consumption. This suggests that in terms of policy intervention, greater efforts would need to focus on encouraging households with high levels of debt to reduce the stock of debt outstanding to avoid storing up problems for the future. This is in addition to dealing with the immediate problems facing households already in financial difficulty.
One-fifth of households with mortgages appear to be spending more than 20% of their gross income on debt total repayments. 13% are spending more than 35% on debt repayment costs, and 6% have debt-repayment ratio greater than 50% ie. debt repayments take up more than 50% of their household incomes (see Table A7, Annex III)6. Given that there are 11.3 million mortgages, it
implies that 1.5 million households have debt cost income ratios of 35% - with 680,000 spending more than 50% of household incomes servicing mortgage and unsecured debts.
Of course, it may well be that these households are temporarily at risk and their financial circumstances may improve with time. Indeed, age may be a factor here. That is, older households spend progressively proportionately less of their household incomes on debt servicing as they pay off mortgages and/ or see their incomes increase over time. We will be considering this in a future report called Debt and the Generations.
However, with deteriorating financial circumstances on the horizon for many households, those spending that proportion of gross incomes on debt servicing must be considered vulnerable.
For those households with unsecured debt, Bank of England research suggests that 14% are spending more than one-fifth (20%) of gross incomes servicing unsecured debts (see Table A7, Annex III). However, BIS research suggests 18% of households with unsecured debt are spending more than one-fifth of incomes servicing unsecured debts (see Table A8, Annex III).
Considering unsecured debt separately is important as financially vulnerable households (such as those on lowest incomes or benefit reliant) would appear to have more debt problems in relation to unsecured debt than mortgage related debt. The debt cost-income ratios quoted above relate to the general population. As we come on to explain, the relative debt burden for many lower income households can be much greater.
6 A debt cost-income ratio of more than 35% is taken to signify financial vulnerability. A debt cost-income ratio of more than 50% certainly signifies a household at serious
Those in society who are most vulnerable to debt problems or feeling burdened by debt will come as no surprise to those who deal with problem debt. Financially vulnerable high risk consumers can be considered in two groups:
• Financially vulnerable – that is, the vulnerability is due to high levels of debt, current financial circumstances or potential deterioration in financial circumstances.
• Socially vulnerable – that is, vulnerability is associated with group characteristics such as lone parents, high risk of illness and so on.
FINANCIAL VULNERABILITY AND DEBT
Lower income and low to medium income households are significantly more leveraged and therefore more vulnerable to debt problems than medium to higher income groups – especially in relation to unsecured debts. Higher income groups may be more exposed to mortgage debt than lower income groups. However, the fact that lower income groups will tend to be paying rent rather than a mortgage must be taken into consideration. The research from various public sources and new CCCS data presented throughout the report makes the forceful point that a significant proportion of the financially vulnerable households seem to be in a precarious financial position due to debt.
Many households are trapped in a vicious cycle, facing very high debt servicing costs that eat up a significant share of the household’s disposable income thus making it difficult to make ends meet. Similarly, any deterioration in household financial circumstances can exacerbate debt related
problems. Repayment-income ratios rise or, in some cases, lead to households being forced to borrow yet more to make ends meet.
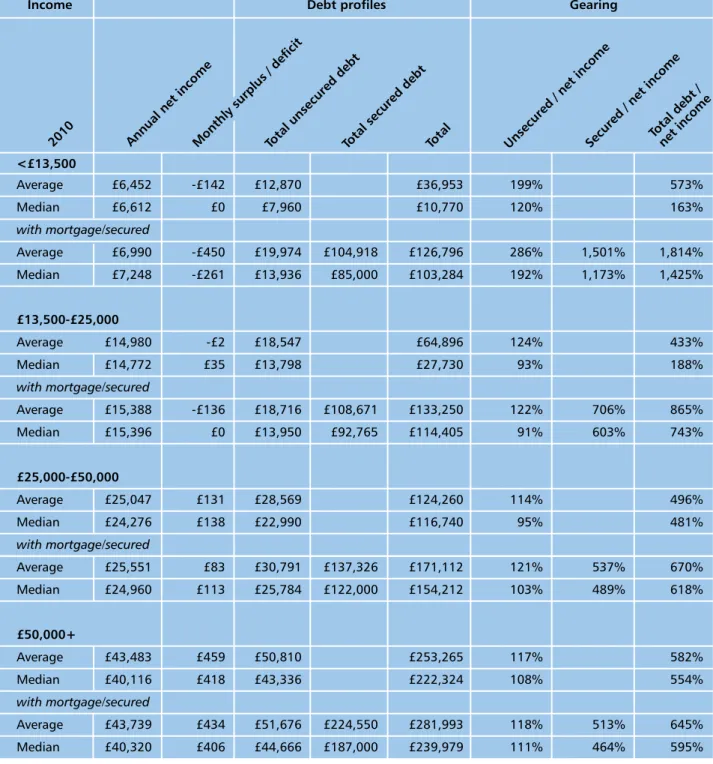
Analysis of CCCS data shows that the levels of gearing, whether in terms of total debt, mortgage debt, or unsecured debt of low income clients is quite striking. Of course, CCCS data relates to consumers who are already overstretched and have contacted the charity. Nevertheless, the gearing levels taken on by those consumers who are clients is worrying. Moreover, the BIS view is that CCCS data is representative of consumers who are in financial difficulty.
As Table 2, below, shows the median lowest income CCCS client has total unsecured debts worth 20% more than their annual income. For lowest income clients with secured debts, the figure is even more shocking. The median lowest income client has unsecured debts worth 90% more than their annual income. When secured household debt is taken into account for those households, the total debts outstanding are a staggering 14 times annual income. The gearing ratios for the lowest income clients are far in excess of the ratios for medium to higher income clients.
What has not been possible to tell is whether these high gearing ratios are as a result of over lending from the outset or clients experiencing serious reductions in their incomes since loans were taken out. It would be very informative to undertake further work on this issue to inform regulatory policy and good lending practices.
3 IDentIFYInG FInAnCIALLY VULneRABLe, LoW InCoMe
HoUseHoLDs
Table 2: Profile of CCCS clients by gross income band
Income Debt profiles Gearing
<£13,500 Average £6,452 -£142 £12,870 £36,953 199% 573% Median £6,612 £0 £7,960 £10,770 120% 163% with mortgage/secured Average £6,990 -£450 £19,974 £104,918 £126,796 286% 1,501% 1,814% Median £7,248 -£261 £13,936 £85,000 £103,284 192% 1,173% 1,425% £13,500-£25,000 Average £14,980 -£2 £18,547 £64,896 124% 433% Median £14,772 £35 £13,798 £27,730 93% 188% with mortgage/secured Average £15,388 -£136 £18,716 £108,671 £133,250 122% 706% 865% Median £15,396 £0 £13,950 £92,765 £114,405 91% 603% 743% £25,000-£50,000 Average £25,047 £131 £28,569 £124,260 114% 496% Median £24,276 £138 £22,990 £116,740 95% 481% with mortgage/secured Average £25,551 £83 £30,791 £137,326 £171,112 121% 537% 670% Median £24,960 £113 £25,784 £122,000 £154,212 103% 489% 618% £50,000+ Average £43,483 £459 £50,810 £253,265 117% 582% Median £40,116 £418 £43,336 £222,324 108% 554% with mortgage/secured Average £43,739 £434 £51,676 £224,550 £281,993 118% 513% 645% Median £40,320 £406 £44,666 £187,000 £239,979 111% 464% 595%
Source: Financial Inclusion Centre analysis of CCCS data
UNSECURED DEBT AND FINANCIAL VULNERABILITY
Other research on households with unsecured debt also shows the much higher levels of gearing experienced by lower to medium income households.
Table 3 summarises some of the key findings from research commissioned by BIS relating to unsecured debt. This shows that households with higher incomes have higher levels of outstanding unsecured debt. However, in keeping with other findings, this confirms the point that lower income Table 3: Households vulnerable to unsecured debt
Unsecured debts Unsecured debts Debt-income ratio Repayment-income > £10,000 > £20,000 > 60% ratios > 30% Annual household income
< £13,500 27% 9% 41% 20% £13,500 - £25,000 32% 11% 29% 14% £25,000 - £50,000 36% 15% 15% 8% £50,000+ 46% 20% 6% 5% Household savings None 40% 19% 29% 16% £1 - £1,000 37% 14% 25% 13% £1,000 - £10,000 35% 11% 15% 9% £10,000 or more 30% 12% 11% 6% Not known 24% 7% 15% 5% Housing status Mortgage 36% 15% 16% 10% Rented 36% 13% 27% 12% Household composition
Couple with children 33% 15% 15% 11%
Couple, no children 34% 14% 17% 9%
Single adult, with children 23% 9% 21% 18%
Single adult, no children 39% 13% 29% 12%
One or both adults unemployed 37% 14% 37% 18%
All households with unsecured credit 35% 13% 20% 11%
households and other financially vulnerable households have greater leverage as a proportion of incomes (debt-to-income ratios) and higher repayment to income ratios.
For example, 41% of households with incomes under £13,500 have debt-to-income ratios of more than 60% compared to 15% of households with incomes between £25,000 and £50,000. Similarly, one in five (20%) households with incomes under
CASE STUDY – JOHN*, 52 (LIVERPOOL)
“The crux of the matter is I lost my job, I was made redundant and I knew it was batten down the hatches time.”
John was earning almost £45,000 a year but when he became unemployed, his income fell dramatically: “Nobody is taking on staff, let alone
senior staff in the recruitment industry.
“My biggest mistake was not being fully aware of our commitments, especially my credit card. I owed about £18,000, and was happily paying back about £350 a month. I’d never missed a payment before but when I lost my job, I took it back to the minimum payment, about £60, £70 a month. The introductory interest free period finished and the rate rocketed and took it to more than £450. We couldn’t afford the payments.”
John contacted the credit card company to explain his situation: “They don’t understand, they told
me they are not there to help me but to get me to make repayments. They try and put the frighteners on you from day one. Phone calls from India at 6.30, 7 in the morning, Saturday, Sunday, to put pressure on you. They know what they’re doing!”
The increasing cost of living has been a big factor according to John: “We’ve had to cut right
back and re-prioritise, even started shopping at
FarmFoods. We’ve looked at every part of our finances to find ways to pinch pennies. Cancelled the house insurance. That became a luxury. I can’t even afford to get my teeth seen and I have prescriptions I can’t afford to take.”
The biggest impact has been on his wife who now suffers from stress: “I’m a pretty traditional guy, I
was the breadwinner. But if it wasn’t for my wife, we would have been homeless. She has two part-time jobs paying minimum wage so we don’t get benefits and we’ve used all her inheritance.”
John explained the impacts on his wife’s health:
“The worry and strain has been a big. She’s been to the doctors, surprised she’s not had a breakdown. It must be a massive strain on the NHS all this debt up and down the country.”
John starts a new job next week so he is feeling more confident about his situation: “But it’s about
£21,000 a year and I have to travel to Manchester. That’ll cost £60, £70 a month, so we’ll only just about make ends meet.”
John explained that this is not the end of the problem: “It’ll be 6 weeks before I get paid so it’s
going to take a while to get back onto my feet. I’ve had to open a new bank account so that they don’t take all my wages straightaway.”
£13,500 have repayment to income ratios of more than 30% compared to 8% of households with incomes between £25,000 and £50,000.
Not surprisingly, lower income households with unsecured debts report that repayments of unsecured debts are a burden.
As Table 4 shows, there is a clear relationship between household incomes and the degree to which debt repayment is a burden. The proportion of benefit-reliant households who reported that debt repayments are a heavy burden was 26%, twice the proportion of all households (13%). Of course, this research was undertaken in 2009 and base rates have remained at 0.5% since that period with beneficial effects for those on mortgages. So it may be that the number of households with a mortgage which now say that debt repayments are a burden may have reduced as a result.
It is important to recognise that mortgage rate reductions are unlikely to be as much benefit to lowest income households and benefit-reliant households. These categories of households are less likely to have mortgages and if they do, these mortgages will probably be sub-prime mortgages. Rates on sub-prime mortgages do
not seem to have come down as much as rates on mainstream mortgages. Moreover, they are also disproportionately exposed to unsecured debt where interest rate margins have widened considerably - in other words as base rates fell, loan rates stayed the same or have actually risen.
HOUSEHOLDS FACING MORTGAGE DIFFICULTIES
One particular group of great interest are households who may be facing difficuty meeting mortgage payments. This group is not necessarily the largest by number, but the consequences can be devastating for households which cannot meet repayments. Early intervention is particularly important therefore for these households.
It is difficult to establish with real accuracy the number of households with mortgages facing immediate danger. The evidence base is improving but it remains patchy.
Another problem is that the most widely understood and quoted measure – arrears and repossessions – does not paint the whole picture of the total number of mortgages that may be in some form of distress (not performing). The totality of the problem is concealed by the fact that significantly more mortgages are in forbearance7 than in arrears or been repossessed.
7 Forbearance can include a number of strategies including: capitalising existing arrears on the mortgage into the balance to remove
Table 4: Lowest income groups face disproportionate debt burden on unsecured debt Proportion reporting whether debt repayment is a burden
Debt burden Benefit- Lower Medium
reliant Earners (LMEs) Higher earners All households
None 41% 51% 60% 54%
Some 33% 33% 32% 33%
Heavy 26% 16% 8% 13%
Forbearance is not necessarily a bad thing. It allows the lender to provide welcome respite until the financial position of the borrower recovers. However, it should be recognised that generally forbearance is an indication of a borrower facing financial difficulty.
Table 5: Breakdown of UK residential mortgages in arrears or subject to forbearance
% of total Forbearance 15%
1-3 months in arrears 15%
3-6 months in arrears 7%
Over 6 months in arrears or in possession 15%
Source: FSA Prudential Risk Outlook, 2011, p64, http://www.fsa. gov.uk/pubs/other/pro.pdf
(n.b. arrears are as at end 2009, forbearance is for period April 2009 to March 2010).
Forbearance accounts for nearly two thirds (63%) of the total of mortgages in arrears or subject to forbearance. From this it is possible to estimate the total number of mortgages that are likely to be facing some form of problem.
According to CML data, there were 11.3 million outstanding mortgages as at end 20108. FSA research indicates that 1.6% of mortgages were 6 months in arrears or in possession9 equating to around 180,000 mortgages.
From the respective percentages set out in Table 5, we can estimate that around 760,000 mortgages were in some form of forbearance and that the total number of mortgages in arrears or subject to forbearance is 1.2 million. This equates to nearly 11% of total outstanding mortgages in some form of distress.
This is quite a worrying figure especially given the widespread view that the UK mortgage market is not facing significant problems with regards to arrears and repossessions. We should emphasise that these are estimates and more work should be done to more accurately establish the true figure. However, it should be noted that 10% of households with a mortgage are reported to be in financial difficulties with 13% ‘at risk’ of getting into financial difficulty (see Table 11). The fact that so many homeowners are in trouble at a time when interest rates have been so low for so long must be cause for concern.
The position of different household income groups needs to be analysed further. Unfortunately, we do not have access to sufficient income related data to do this. However, it is worth considering the position of households with sub-prime mortgages. This is not a perfect proxy for low incomes but it is generally accepted that lower income or financially vulnerable households are more likely to use sub-prime or specialist lenders.
According to FSA estimates, 6.5% of all mortgages sold between 2005 and 2009 are in arrears or repossession. However, this figure rises to 28.5% of mortgages sold to credit impaired borrowers and 23.5% of mortgages sold by specialist lenders10. HOUSEHOLDS IN ARREARS AND/ OR FACING FINANCIAL DIFFICULTY
Although the focus of the report is the level of overindebtedness amongst different households, the research has also considered the number of households which are facing financial difficulties, such as being in arrears or finding it difficult to make ends meet. This is clearly important as these households may find themselves getting into debt
8 http://www.cml.org.uk/cml/media/press/2914
9 See, Chart C12: Arrears and possessions on residential mortgages, FSA, Prudential Risk Outlook 2011, http://www.fsa.gov.uk/pubs/other/pro.pdf