Comparative Analysis of Feature Selection
Method to Predict Customer Loyalty
Heni Sulistiani 1, Aris Tjahyanto2
AbstractThe growth of Fast Moving Consumer Goods (FMCG) industry is still showing double-digit and Indonesia becomes a potential market for the products FMCG, so that the competition between companies will be intense. The company have to attempted to survive, one of the way is to maintain customer loyalty. Data mining techniques can be used to predict customer loyalty. In data mining pra-processing, feature selection is one of the important thing to reduces the number of features, removes irrelevant, redundant, or data noise, and brings the immediate effects for applications: speeding up a data mining algorithm, improving mining performance such as the accuracy of the prediction and the comprehensive result. This paper aims to identify the relevant factors that affect the performance of the classification of customer loyalty with several feature selection method and to compare the classification performance in customers loyalty prediction of FMCG products. Data was obtained from the results of fast moving consumer goods customers questionnaires towards several brands of instant noodles in Lampung that was ranked TOP Brand Award Phase 1 2016, using nonprobability sampling method and convenience sampling technique. The result in this paper, chi square feature selection methods with threshold > 0.01 showed the best results, it is indicated by the highest accuracy of random forest classification algorithm, that is 83.2% for thirteenth features.
Keywordsclassification, customer loyalty, feature selection.
I.INTRODUCTION1
he main problem in discovering knowledgeprocess is to identify representative data as the basis of the built classification models [1]. Research on the partial defection of behaviorally loyal clients was proposed using classification method such as logistic regression, neural networks ARD and random forest [2]. In that research, regression analysis method is used for feature selection process by doing rank. Characteristics of loyal customers in the fast moving consumer goods products, as follows make a purchase on a regular basis, do not buy in out the product line, reject other products, and not easily affected by the attraction of similar products from competitors [3]. In this paper, the parameters used in the measurement of customer loyalty are make purchases continuously, recommend to a friend, colleague and family, and give positive comments on the brand of instant noodles commonly.
Feature selection can be found in many areas of data mining such as classification, clustering, association rules, regression [4]. In data mining pra-processing, feature selection is one of the important thing [5] to reduces the number of features, removes irrelevant, redundant, or data noise, and brings the immediate effects for applications: speeding up a data mining algorithm, improving mining performance such as the accuracy of prediction and the comprehensive result [6]. Often, when the mining process are presented with a number of attributes that are not small, many not useful attributes that are used for prediction.
1Heni Sulistiani is with Department of Information System, STMIK
Teknokrat, Lampung, 35142, Indonesia. E-mail: [email protected].
2Aris Tjahyanto is with Department of Information System, Institut
Teknologi Sepuluh Nopember, Surabaya, 60111, Indonesia. E-mail: [email protected].
In applications that implement a data mining typically uses a number of features, hope can give a good performance accuracy [7]. Features with large numbers will impact on expensive and complex computing. However, features with large numbers did not always guarantee a good performance. Features selected must have a correlation in discriminating against classes that are processed.
There are two points of feature selection with machine learning approach that are choose the features that will be used and explain the concept of how to combine these features to produce the concept of induction correct or appropriate result [8]. Selection feature is used to provide the characteristics of the data [9]. Phase of selection feature is certainly very critical. If the selected features have value small in discrimination, than the classification established design has a poor performance. Otherwise, if the feature has great value discrimination, than the classification established design has a good performance.
Feature selection technique using Information Gain and
Gain Ratio proposed with threshold 0.01 to reduce the dimension of student data and then applied to a rule-based classification algorithms, tree-based, function-based and bayes-based. The research proposed by [10] using the feature selection method of information gain and multiple classification algorithms, namely Decision Tree, Random Forest, ANN, SVM, and Naive Bayes. The results showed that the implementation of feature selection techniques can improve accuracy values because irrelevant features to the target of classification has been reduced. Association rules also used for feature selection and model was developed using neural network (NN) and decision tree (DT) in the prediction of customer churn in Multimedia on Demand (MOD) [11].
The growth of Fast Moving Consumer Goods (FMCG) industry is still showing double-digit and Indonesia becomes a potential market for the products FMCG [12], so that competition between companies will be intense. The company have to attempted to survive, one of the way is to maintain customer loyalty [13]. This paper aims to identify the relevant factors that affect the performance of the classification of customer loyalty with several feature selection method. This research applies several feature selection methods, namely Information Gain, Gain Ratio,
and Chi Square with threshold > 0.01, and then do comparative performance random forest classification in predicting customer loyalty of FMCG products in Lampung.
This paper is organized as follows. Section 2 describes research method of the proposed methods. Section 3 describes the result and discussion. Section 4 concludes this paper. Section 5 further works from this paper.
II. METHOD
In this research, the data used to build the predictive models of classification contains 26 feature and 1 feature as a class label (as shown in Table 1). The feature consists of numerical and non-numeric features.
TABLE 1. DESCRIPTION OF FEATURE
Feature Description Feature Description
f1 Age f14 Switch brands
f2 Expenses f15 Reason to switch
f3 Consumption
average
f16 Behavior back
f4 The other brands
consumption
f17 Satisfaction of price
f5 Address f18 Recomendation
f6 Marital status f19 Comment
f7 Job status f20 Number of buying
f8 Education f21 Number of
consumption per once
f9 Brands f22 Gender
f10 Promotion media f23 Status of residence
f11 Reason to consumption f24 Point of purchase f12 Duration of consumption f25 Display products f13 Distance purchases f26 Brands satisfaction
The data was obtained from the results of fast moving consumer goods customers questionnaires towards several brands of instant noodles in Lampung that was ranked TOP Brand Award Phase 1 2016, using nonprobability sampling method and convenience sampling technique to determine who will be the respondent. By using this method, respondents were entitled to fill out a questionnaire depends entirely on ease of researchers [14]. Due to the number of population is not known, then to determine the minimum number of samples using the formula Lemeshow [15], equation (1) showed the formula of Lemeshow:
𝑛 =𝑃(1−𝑃)(𝑍1−∝/2)2
𝑑2 (1)
Based on the formula in equation (1), thisresearch’s using 386 of total respondens, that comprises of 284 respondents labeled ‘loyal’ and 102 respondents labeled ‘no loyal’. The stages of methods in this study are from data collected applied three different feature selection methods (Information Gain, Gain Ratio, and Chi Square with
threshold > 0.01), and then classifies the data using random forest algorithms, after that measuring the performance of the classifier and the last step is doing a comparative analysis based on the results of performance measurement. In general, the research method is shown in figure 1.
A. Random Forest
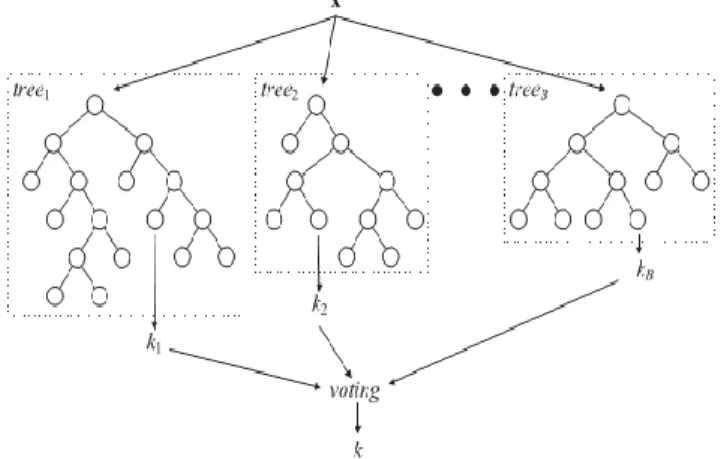
Random forests has become a popular technique for classification, prediction, studying variable importance, variable selection, and outlier detection [16]. Random Forests are ensembles of tree-type classifiers, that use a similar but improved method of bootstrapping as bagging [17]. The random refers to the way each tree is trained [18]. Each split on each node in each tree is based on a random subset of the features in the training data. The number of variables, each node considers when deciding a split, is usually kept much smaller than the full feature space for the data set, this is done to keep the correlation between trees low. A random forest is a classifier consisting of a collection of treestructured classifiers {h(x,Θk ), k=1, ...} where the {Θk} are independent identically distributed random vectors and each tree casts a unit vote for the most popular class at input x [19].
In random forests, a decision tree, i.e. CART (classification and regression trees), is used as a weak learner. When solving classification problems, the random forests prediction is the un-weighted majority of class votes. As the name suggests, random forests combines many classification trees to produce more accurate classifications [20]. By-products of the random forests calculations include measures of variable importance and measures of similarity of data points that may be used for clustering, multidimensional scaling, graphical representation, and missing value imputation. Fig. 2 presents a general architecture of random forests.
The random forests algorithm (for both classification and regression) is as follows [21]:
a. Draw ntree bootstrap samples from the original data; b. For each of the bootstrap samples, grow an unpruned
classification or regression tree, with the following modification: at each node, rather than choosing the best split among all predictors, randomly sample mtry of the predictors and choose the best split from among those variables. (Bagging can be thought of as the special case of random forests obtained when mtry = p, the number of predictors);
Predict new data by aggregating the predictions of the ntree trees (i.e., majority votes for classification, average for regression).
Figure 1. Research Method
B. Feature Selection
Feature selection is one of the important phase in pre-processing of the data mining with choosing a subset of the original feature spaces according to discrimination capability to improve the quality of data [22]. Feature selection methods have been widely used to obtain important information in a dataset for spesific target. There are 2 division in feature selection is supervised and unsupervised feature selection. feature Selection which included in the supervised category namely Chi-Square (CS), Information Gain (IG), Gain Ratio (GR) and Mutual Information (MI), whereas the feature selection which included in the unsupervised category namely Term Strength (TS), Term Contribution (TC), Entropy-based Ranking (En) and Document Frequency (DF) [23]. In general, there are three types of feature selection methods: embedded, wrapper and filter [24]. Compared with embedded and wrapper methods, filter methods are less time consuming and can solve the problem of over-fitting caused by classifier dependency [25]. Filter methods in feature selection is as follow:
Figure 2. A General Architecture of Random Forests
1) Gain Ratio
Gain ratio is a normalization of information gain that takes into account entropy of the probability distribution subset after the partition process [26]. Gain ratio is a modification of the information gain that reduces its bias [27]. Gain ratio takes number and size of branches into account when choosing an attribute. The gain ratio is calculated as follows:
𝐺𝑎𝑖𝑛𝑅𝑎𝑡𝑖𝑜(𝑋) = 𝐺𝑎𝑖𝑛(𝑋)
𝑆𝑝𝑙𝑖𝑡𝐼𝑛𝑓𝑜(𝑋) (2)
where SplitInfo(X) is the entropy of the entire probability distribution subset after do partitioning (splitting).
𝑆𝑝𝑙𝑖𝑡𝐼𝑛𝑓𝑜(𝑋) = − ∑((|𝑇𝑖|
𝑇 ) ∗ 𝑙𝑜𝑔2(
|𝑇𝑖|
|𝑇|)) (3)
where |Ti| is the cardinality of the subset Ti in data training
T.
2) Chi Square
Chi-square is a popular feature selection method, will evaluate genes individually with respect to the classes [28]. Chi-square is a supervised feature selection that can eliminate a lot of features without reducing the level of accuracy [29]. Chi-squared is based on comparing the obtained values of the frequency of a class because of the split to the expected frequency of the class. Of the N
examples, let Nij be the number of samples of the Ci class within the jth interval and MIj is the number of samples in the jth interval. The expected frequency of Nij is Eij = MIj
|Ci|/N. The Chi-squared statistic of a gene is then defined as: 𝑋2= ∑ ∑ (𝑁𝑖𝑗−𝐸𝑖𝑗)2 𝐸𝑖𝑗 𝐼 𝑗=1 𝐶 𝑖=1 (4)
where I is the number of intervals. The larger the X2 value, the more informative the corresponding gene is.
3) Information Gain
Another key concept of information theory is information gain [30]. Information gain can also be defined with mutual information. In particular, information gain IG(A) is the reduction in the entropy that is archived by learning a variable A:
𝐼𝐺(𝐴) = 𝐻(𝑆) − ∑ 𝑠𝑖
𝑠𝐻(𝑠𝑖)
𝑖 (5)
where H(S) is the entropy of the given dataset and H(Si) is the entropy of the ith subset generated by partitioning S
based on feature A.
In machine learning, information gain can be used to help ranking the features. Usually a feature with high information gain should be ranked higher than other features because it has stronger power in classifying the data.
III.RESULT AND DISCUSSION
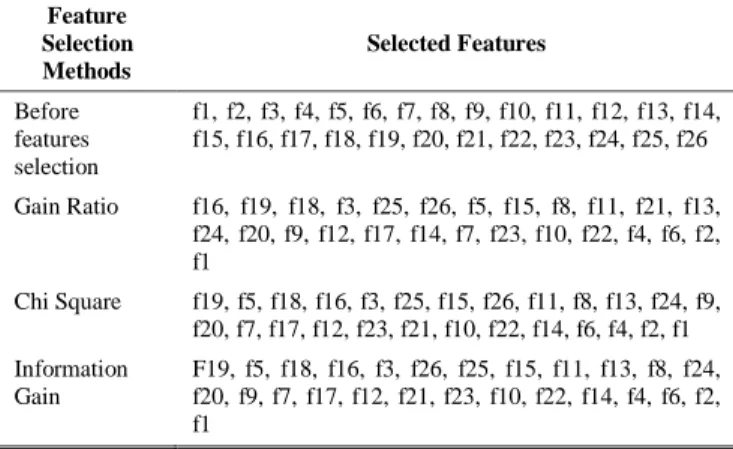
The Random Forest classification predictions model was processed by Weka. Random forest algorithms with three different feature selection methods namely gain ratio, information gain and chi square was applied to the experiment steps. Experiments implementation was done by all the features (before being applied feature selection method) and after using feature selection method (gain ratio, information gain and chi square) based on ranking attribute with the threshold (threshold > 0.01). The results of rank from feature selection methods show in Table 2. Based on Table 2, there are four features that are always selected, if the number of the features is limited to five features. These features are comment (f19), recomendation (f18), behavior back (f16) and consumption average (f3). It is means that the four of these features affected to customer loyalty.
TABLE 2.
THE RANK OF FEATURES SELECTION
Feature Selection Methods Selected Features Before features selection f1, f2, f3, f4, f5, f6, f7, f8, f9, f10, f11, f12, f13, f14, f15, f16, f17, f18, f19, f20, f21, f22, f23, f24, f25, f26 Gain Ratio f16, f19, f18, f3, f25, f26, f5, f15, f8, f11, f21, f13, f24, f20, f9, f12, f17, f14, f7, f23, f10, f22, f4, f6, f2, f1 Chi Square f19, f5, f18, f16, f3, f25, f15, f26, f11, f8, f13, f24, f9, f20, f7, f17, f12, f23, f21, f10, f22, f14, f6, f4, f2, f1 Information Gain F19, f5, f18, f16, f3, f26, f25, f15, f11, f13, f8, f24, f20, f9, f7, f17, f12, f21, f23, f10, f22, f14, f4, f6, f2, f1
While the random forest classification model is validated by 10 fold cross validation method. The performance evaluations were performed using the value of accuracy. The testing of performance classification comparison was conducted to determine the performance of the classifier, which generated predictions with the smallest error value. The results comparison of the classification prediction accuracy of each method of feature selection can be seen in Figure 3.
Figure 3. Comparison of The Accuracy of Random Forest
Based on figure 3, if the previous value of accuracy compare to the following feature selection method, it was found that the third of feature selection methods have an influence to the increase in the value of accuracy. Especially the chi square feature selection method with a threshold > 0.01 showed the best results, it is indicated by the highest accuracy of random forest classification algorithm, that is 83.2% for thirteenth features.
TABLE 3.
CONFUSION MATRIX DECISION TREE ALGORITHM
Test Result Customer Loyalty
Loyal Not Loyal
Positive 280 15
Negative 50 41
By applying the chi square for feature selection methods, it can be seen that the relevant features affected the performance of random forest algorithm, that are comment (f19), address (f5), recomendation (f18), behavior back (f16), consumption average (f3), display products (f25), reason to switch (f15), brands satisfaction (f26), reason to
consumption (f11), education (f8), distance purchases (f13), point of purchase (f24) and brands (f9). From a number of 386 data at thirteenth selected features, the 321 data (83.2%) can be classified correctly, whereas 65 data (16.8%) were incorrectly classified (as shown in Table 3). Table 3 is confusion matrix for amount of data test of estimated loyal customers is 295. A number of 280 customers is predicted correctly as loyal customer (true-positive/ TP), whereas 15 customers predicted incorrectly (false-positive/ FP) by the classifier of decision tree. The testing on the non-loyal customers yield 41 customers (true-negative/ TN) predicted correctly and customers are not loyal, otherwise 50 customers (false-negative/ FN) predicted incorrectly as a not loyal customer.
IV.CONCLUSIONS
Based on the trials that have been conducted in this research, the conclusions is that the implementation of feature selection methods can affect the accuracy of random forest classification algorithms to predict customer loyalty.
Chi square feature selection methods with threshold > 0.01 showed the best results in this research, it is indicated by the highest accuracy of random forest classification algorithm, that is 83.2% for thirteenth features. By applying
Chi square feature selection methods, it can be seen that the relevant features affected the performance random forests algorithm, namely are comment (f19), address (f5), recomendation (f18), behavior back (f16), consumption average (f3), display products (f25), reason to switch (f15), brands satisfaction (f26), reason to consumption (f11), education (f8), distance purchases (f13), point of purchase (f24) and brands (f9).
FURTHER WORKS
The data in this study have heterogeneous features, the transformation should be performed to becomes homogeneous features before making feature selection. Because, datasets with heterogeneous features can affect to feature selection results that are not appropriate. Other feature selection methods such as feature selection method based on mutual information which is capable of measuring the relationship between the label feature class can also be proposed for further research.
REFERENCES
[1] E. Osmanbegović, M. Suljić, and H. Agić, “Determining Dominant
Factor for Students Performance Prediction by Using Data Mining,” TRANZICIJA, vol. 17, no. 34, pp. 147–158, 2014.
[2] W. Buckinx and D. Van den Poel, “Customer base analysis: partial defection of behaviourally loyal clients in a non-contractual FMCG retail setting,” Eur. J. Oper. Res., vol. 164, no. 1, pp. 252–268, 2005.
[3] Winarso Kukuh, “Kepuasan dan loyalitas pelanggan pada produk susu bayi menggunakan service quality dan path analysis,” Manaj. Teor. dan Terap., vol. 3, no. 1, pp. 81–104, 2010.
[4] H. Liu, L. Yu, S. S. Member, L. Yu, and S. S. Member, “Toward integrating feature selection algorithms for classification and clustering,” Knowl. Data Eng. IEEE Trans., vol. 17, no. 4, pp. 491– 502, 2005.
[5] A. L. Blum and P. Langley, “Selection of relevant features and examples in machine learning,” Artif. Intell., vol. 97, no. 1–2, pp. 245–271, Dec. 1997.
[6] V. Ramesh, P. Parkavi, and K. Ramar, “Predicting Student Performance : A Statistical and Data Mining Approach,” Int. J. Comput. Appl., vol. 63, no. 8, pp. 35–39, 2013.
[7] E. Prasetyo, Data Mining Mengolah Data Menjadi Informasi Menggunakan Matlab. Yogyakarta: Andi Offset, 2014.
[8] L. Portinale, L. Saitta, D. Informatica, and P. Orientale, Feature Selection Feature Selection : State of the Art. 2002.
[9] A. S. Sukardi and C. Supriyanto, “Klasifikasi Spam Email Menggunakan Algoritma C4.5 Dengan Seleksi Fitur,” J. Teknol. Inf., vol. 10, no. 1, pp. 19–30, 2014.
[10] B. Nurina Sari, “Implementasi Teknik Seleksi Fitur Information Gain Pada Algoritma Klasifikasi Machine Learning Untuk Prediksi Performa Akademik Siswa,” Semin. Nas. Teknol. Inf. dan Multimed. 2016, p. 6, 2016.
[11] C.-F. Tsai and M.-Y. Chen, “Variable selection by association rules for customer churn prediction of multimedia on demand,” Expert Syst. Appl., vol. 37, no. 3, pp. 2006–2015, 2010.
[12] Musriadi, “Riset Indonesia Pasar Potensial Produk FMCG,” 2014.
[Online]. Available:
http://www.antarabengkulu.com/berita/27470/riset-indonesia-pasar-potensial-produk-fmcg. [Accessed: 01-Jan-2015].
[13] T. B. Santoso, “Analisa Dan Penerapan Metode C4.5 Untuk Prediksi Loyalitas Pelanggan,” J. Ilm. Fak. Tek. LIMIT’S, vol. 10, no. 1, pp. 33–36, 2014.
[14] Abubakar, “Pengukuran Persepsi Penumpang tentang Efektivitas
Strategi Pencegahan Kejahatan TransJakarta,” Universitas
Indonesia, 2009.
[15] S. Lemeshow, D. W. Hosmer Jr, J. Klar, and S. K. Lwanga, Adequacy of Sample Size in Health Studies. Chichester: John Wiley & Sons Ltd, 1990.
[16] A. Verikas, A. Gelzinis, and M. Bacauskiene, “Mining data with random forests: A survey and results of new tests,” Pattern Recognit., vol. 44, no. 2, pp. 330–349, 2011.
[17] P. O. Gislason, J. A. Benediktsson, and J. R. Sveinsson, “Random Forests for land cover classification,” 2006.
[18] S. R. Joelsson, J. A. Benediktsson, and J. R. Sveinsson, “Feature Selection for Morphological Feature Extraction using Random Forests,” in Proceedings of the 7th Nordic Signal Processing Symposium - NORSIG 2006, 2006, pp. 10–13.
[19] L. Breiman, “Random forests,” Mach. Learn., vol. 45, pp. 5–32, 2001.
[20] D. R. Cutler et al., “Random Forests for Classification in Ecology,” Ecology, vol. 88, no. 11, pp. 2783–2792, 2007.
[21] a Liaw and M. Wiener, “Classification and Regression by randomForest,” R news, vol. 2, no. December, pp. 18–22, 2002. [22] H. Liu, J. Sun, L. Liu, and H. Zhang, “Feature selection with
dynamic mutual information,” Pattern Recognit., vol. 42, no. 7, pp. 1330–1339, 2009.
[23] T. Liu, S. Liu, Z. Chen, and W. Ma, “An evaluation on feature selection for text clustering,” in Proceedings of the Twentieth International Conference on Machine Learning (ICML-2003), 2003, pp. 488–495.
[24] G. Doquire and M. Verleysen, “Mutual information-based feature selection for multilabel classification,” 2013.
[25] K. Zhang, Y. Li, P. Scarf, and A. Ball, “Feature selection for high-dimensional machinery fault diagnosis data using multiple models and Radial Basis Function networks,” Neurocomputing, vol. 74, no. 17, pp. 2941–2952, 2011.
[26] W. Julianto, R. Yunitarini, and M. K. Sophan, “Algoritma C4.5 Untuk Penilaian Kinerja Karyawan,” Scan, vol. Vo. IX, no. No. 2, pp. 33–39, 2014.
[27] R. P. Priyadarsini, M. L. Valarmanthi, and S. Sivakumari, “Gain Ratio Based Feature Selection Method for Privacy Preservation,” ICTACT J. Soft Comput., vol. 1, no. 4, pp. 201–205, 2011. [28] X. Jin, A. Xu, R. Bie, and P. Guo, “Machine Learning Techniques
and Chi-Square Feature Selection for Cancer Classification Using SAGE Gene Expression Profiles,” in Data Mining for Biomedical Applications: PAKDD 2006 Workshop, BioDM 2006, J. Li, Q. Yang, and A.-H. Tan, Eds. Berlin, Heidelberg: Springer Berlin Heidelberg, 2006, pp. 106–115.
[29] C. Sun, X. Wang, and J. Xu, “Study on feature selection in finance text categorization,” 2009 IEEE Int. Conf. Syst. Man Cybern., vol. 3, no. October, pp. 5077–5082, 2009.
[30] B. Sui, “Information gain feature selection based on feature interactions,” University of Houston, 2013.