NBER WORKING PAPER SERIES
THE PERFORMANCE OF REVERSE LEVERAGED BUYOUTS
Jerry Cao
Josh Lerner
Working Paper 12626
http://www.nber.org/papers/w12626
NATIONAL BUREAU OF ECONOMIC RESEARCH
1050 Massachusetts Avenue
Cambridge, MA 02138
October 2006
Chris Allen and Lauren Walker provided excellent research support. We thank Harvard Business Schools'
Division of Research and a private equity investor for research support. Edie Hotchkiss, Ludovic Phalippou,
and Per Stromberg provided helpful comments. All opinions, errors, and omissions, though, are solely
attributable to the authors. The views expressed herein are those of the author(s) and do not necessarily
reflect the views of the National Bureau of Economic Research.
© 2006 by Jerry Cao and Josh Lerner. All rights reserved. Short sections of text, not to exceed two
paragraphs, may be quoted without explicit permission provided that full credit, including © notice,
is given to the source.
The Performance of Reverse Leveraged Buyouts
Jerry Cao and Josh Lerner
NBER Working Paper No. 12626
October 2006
JEL No. G23,G24,G34
ABSTRACT
Reverse leveraged buyouts (RLBOs) have received increased public scrutiny but attracted little systematic
study. We collect a comprehensive sample of 496 RLBOs between 1980 and 2002 and examine
three-and five-year stock performance of these offerings. RLBOs appear to consistently outperform other
IPOs and the stock market as a whole, with economically and statistically meaningful positive returns.
There is no evidence of a deterioration of returns over time, despite the growth of the buyout market:
RLBOs performed strongly in the late 1980s, the mid-1990s, and the 2000s. Large RLBOs that are
backed by private equity firms with more capital under management perform better. We also find the
so-called quick flips--when private equity firms sell off an investment within a year after acquisition--underperform.
Jerry Cao
Carroll School of Management
140 Commonwealth Avenue
Chestnut Hill, MA 02467
caoxi@bc.edu
Josh Lerner
Harvard Business School
Morgan Hall, Room 395
Cambridge, MA 02163
and NBER
Introduction
In recent years, intense public scrutiny has surrounded the phenomenon of reverse leveraged buyouts (RLBOs), or initial public offerings (IPOs) of firms that had previously been bought out by professional later-stage private equity investors. This paper seeks to understand the long-run performance of these offerings, in order to understand whether these concerns are justified.
To date, much of the discussion of these offerings has focused on a few troubled RLBOs, such as Refco, which Thomas H. Lee Partners bought a majority stake in for more than $500 million in 2004 and took the company public at more than double the price a year later. In one of the more than a dozen lawsuits filed after the collapse of the firm soon after its IPO, the plaintiffs asserted “there are substantial questions to be answered concerning the structure, cost and effects of the investment in Refco by Thomas H. Lee Partners in June of 2004, and Refco's IPO in August of 2005."2
More generally, observers have argued that buyout groups push overleveraged companies too quickly into the public market. For instance, the New York Times (Sorkin, 2005) observed:
[S]everal high-profile quick flips have left critics wondering whether buyout firms were using such offerings simply to line their pockets, rather than using the proceeds to support companies. Earlier [in 2005], the Blackstone Group sold a German chemicals company, the Celanese Corporation, to the public after owning it for less than 12 months. The firm quadrupled its money and all of the proceeds from the offering were used to pay out a special dividend to Blackstone. Mr. Kravis's firm, Kohlberg Kravis Roberts & Company, also quadrupled its money by flipping PanAmSat, the satellite company it owned for less than a year.
A recent Wall Street Journal article on RLBOs (Cowan, 2006) noted that “while some debt is fine, when it is taken on to finance things that only benefit some shareholders— such as special dividends—new investors are buying hobbled companies.”
2http://lbo.djnewsletters.com/exclusives.asp?s=DEALBOOK&sid=NIQPOPOQMHI
But it is plausible to wonder whether buyout groups would find such a strategy productive. Buyout groups typically hold large equity ownership in firms prior to their IPOs, and continue to retain large ownership stakes subsequent to the offerings. Thus, the post-IPO long-run performance of RLBOs will have substantial wealth implications for the private equity investors. More importantly, as repeated players in IPO market, buyout groups will suffer reputation losses if its RLBOs turn out to be failures.
These discussions suggest the desirability of a systematic look at the long-run performance of RLBOs. Surprisingly, these offerings have attracted little attention in the academic literature in recent years, despite the considerable attention devoted to the performance of venture capital-backed IPOs (Brav and Gompers, 1997; Gompers and Lerner, 1999; Hamao, Packer, and Ritter, 1999; Jain and Kini, 2000; Masulis and Li, 2005; and many others).
Several papers in the earlier literature, however, are quite relevant to this one. First, there is a literature on the evolution of LBOs. Kaplan (1992) examined 183 large leveraged buyouts executed between 1979 and 1986, and documented that a significant fraction of firms undergoing LBOs went public once again: the RLBOs in his sample remained private for a median time of 6.82 years. Muscarella and Vetsuypens (1990) examined 72 RLBOs between 1983 and 1987, and documented substantial increases in profitability and temporary increases in leverage when compared to the same firms prior to the LBO.
Most relevant are four studies. DeGeorge and Zeckhauser (1993), examining 62 RLBOs between 1983 and 1987 (though much of the analysis is based on a smaller sample), find that the accounting performance of these firms exceeds their peers prior to going public, and then deteriorates thereafter. They find no evidence, however, that these offerings’ stock prices underperform the market. Holthausen and Larcker (1996) examine 90 RLBOs between 1983 and 1988, and argue that there is no evidence of either poor performance when either accounting or stock market measures are employed. Chou, Gombola and Liu study the earning management around RLBOs and find positive and
significant discretionary current accruals coincident with offerings of RLBOs. Finally, Mian and Rosenfeld (1993) examine 85 RLBOs over roughly the same period and find that the offerings slightly outperform their stock market peers.
The absence of scrutiny of RLBOs since the 1980s is especially striking due to the changes in the market since these years. As discussed in the next section of the paper, the buyout market of the 1990s and 2000s is very different from that of the 1980s, both in terms of the amount of capital deployed and the degree of competitiveness of these transactions. It is natural to ask whether the earlier patterns still characterize this market.
This analysis also provides an opportunity to understand the drivers of cross-sectional differences in RLBO performance. The modest number of offerings studied limited the ability of earlier authors to draw systematic conclusions about the considerations that made RLBOs particularly successful.
In this paper, we examine 496 RLBOs between 1980 and 2002. The following conclusions emerge from the analysis:
• RLBOs appear to consistently outperform other IPOs and the market as a whole. The positive returns appear to be economically and statistically meaningful. • No evidence of a deterioration of returns appears over time, despite the growth of
the buyout market. RLBOs performed strongly in the late 1980s, the mid 1990s (less consistently), and the 2000s.
• RLBOs sharply outperform the market in the first, fourth, and fifth year after going public; performance in other years is more ambiguous.
• Much of the outperformance seems associated with the larger RLBOs, but this may be driven by the apparently superior returns of RLBOs by groups with more capital under management at the time of the offering.
• There is no evidence that more leveraged RLBOs perform more poorly than their peers.
The plan of this paper is as follows. Section 1 briefly reviews the evolution of the leveraged buyout market since the 1980s. In Section 2, we discuss the construction of the data-set employed in the study. Section 3 presents the basic analyses of long-run performance. Several supplemental analyses examining cross-sectional differences in RLBO returns are discussed in Section 4. The final section concludes the paper.
1. The Evolution of the Leveraged Buyout Market
During the 1980s, the U.S. buyout industry was comprised of a relatively small number of organizations. These groups identified transactions through personal contacts with executives in key industries and various intermediaries. When they identified a transaction, they would often have weeks or months to analyze the proposed deal. They would then structure the transaction using high degrees of leverage: often as much as 85% or 90% of the total purchase price would be in the form of debt. As a result, even a modest increase in the value of the firm—which could be due to the overall growth in the stock market, inflation, and operating improvements—would lead to substantial profits for the equity-holders.
As Kaplan (1997) notes:
In the first half of the 1980s, the LBO insights led to great success. As documented in Kaplan (1989) and Kaplan and Stein (1993), buyout companies experienced improved operating profits and few defaults. Adjusting for the overall stock market or industry, these early buyouts generated abnormally positive returns. Because the overall stock market increased over this period, buyout sponsors earned substantial nominal returns.
Subsequent years have more challenging for buyout groups. The buyout industry today is far larger than it was during the years when it enjoyed its greatest returns. Fundraising by U.S. buyout funds was six times greater in 1998 than it was in 1987, and by 2005, it was nine times the level in 1987.
At the same time, the returns from these investments deteriorated. For instance, while average buyout fund established between 1980 and 1985 earned a rate of return of 47%, those established between 1986 and 1999 earned an average IRR of slightly less
than 10%.3 This observation is corroborated by a correlation analysis, which shows a very strong negative correlation between fundraising and returns in private equity.4
Most observers attributed the deterioration of returns as capital under management has increased to increased competition for transactions. Over time, there were increasingly fewer opportunities to buy companies at relatively low prices without competition. Sellers of firms—having become aware of the numerous potential buyers— increasingly hired investment banks, who conducted auctions between leveraged buyout groups. As a result of the increased competition, buyers were required to pay more for transactions. Auctions also had another, less direct cost: that of “dry holes.” When assessing a proposed transaction arranged through close contacts where there is only one private equity group involved, the general partners can be confident that if they decide to go ahead with the transaction, they will be able to complete the transaction. In an auction where there are a dozen or more groups bidding, the dynamics are very different. Even if it wants to undertake the transaction, the private equity group has a low probability of success. Hence, the risks are much greater in this scenario.
These changing dynamics have been widely recognized by sophisticated practitioners. For instance, Rick Rickertsen of Thayer Capital commented in 2001:
Capital has always been a commodity, but never has it been more plentiful than it is today. Have management availability and expertise been growing at the same rate? Very unlikely. This means the ratio of capital to expertise is increasing dramatically.
It might be anticipated that these changes would have affected the market performance of RLBOs as well, if, as press accounts suggested, competitive pressures were leading firms to take more marginal and more leveraged firms public.
3These calculations are based on the VentureXpert database (http://vx.thomsonib.com/NASApp/VxComponent/VXMain.jsp, accessed May 23, 2006). Returns are computed as of December 31, 2005. Data are continuously updated, and therefore subject to change.
4The correlation coefficient between the leveraged buyout fundraising and the average returns from 1980 to 2002 is -0.67. Because Venture Economics only reports aggregated data for the returns of buyout funds in vintages years 1980 through 1983, we use the average annual fundraising in this period in the correlation analysis.
2. Data
We sought to build as comprehensive a collection of RLBOs between 1980 and 2002 as possible. We chose the former cut-off date because the earlier literature suggests that there were essentially no such offerings previously. We employed the latter date to ensure that we had at least three years of performance data for each offering.
A. Identifying the RLBO Sample
One of the main barriers to research in this area is the identification and characterization of the RLBOs. The difficulty in identifying the buyout-backed IPOs arises from two factors.
• The first is the secretive nature of buyout organizations. Unlike venture capital organizations, these groups rarely disclose new investments on web sites or in press releases. As a result, the coverage of the major databases is considerably less complete than that of venture-backed transactions.
• Another complication comes from the fact that the boundaries between venture capital and buyout investments are increasingly blurred. For example, private equity firms that typically make buyout investments have in the past decade also often made venture capital type of investments. Hence, one cannot infer the deal type by just looking at the attributes of the investors. This gives rise to ambiguity in identifying the Reverse Leveraged Buyouts among the private equity-backed IPOs.
Since we wish to understand the performance of RLBO transactions, we choose to eliminate transactions that are ambiguous. In particular, we insist that the transactions satisfy two criteria:
• That the financing was undertaken by a buyout group. We compile a list of buyout firms/funds that primarily engage in buyout activities from VentureXpert and Capital IQ. Any IPOs that are not backed by at least one organization on this list was regarded as non-buyout backed and eliminated from the sample.
• That the investment was characterized by the use of leverage. To help screen out investments by buyout organizations that more closely resemble venture capital, we search press accounts via the Factiva, as well as financial sponsor home pages and SEC filings, to understand the features of the transaction.
We identify RLBOs from several sources. The first of these is Securities Data Company’s (SDC) Corporate New Issues database. The database flags IPOs with an identifier indicating that it had previously conducted a leveraged buyout. This gives us a sample of 229 RLBOs for the period from 1980 through the middle of 1998. SDC, however, does not flag any RLBOs after 1998. Moreover, it appeared that the list was incomplete in earlier years.
The second approach was to search databases of LBOs, and seek to identify whether any transactions subsequently went public. RLBOs were determined by examining both the entries in the databases indicating the outcomes of the transactions (which are frequently incomplete), as well as through our own searches of news stories and the SDC Corporate New Issues database. To do this, we employed SDC’s VentureXpert and SDC Mergers and Acquisitions databases, as well as Standard and Poors’ Capital IQ. While the Capital IQ database is more comprehensive, it only extends back to 1998. In each case, the databases identify a large number of transactions that could be better characterized as venture capital investments, which we eliminate using the criteria described above. These three sources generate an additional 267 RLBOs, leaving us with a final sample of 496.
Table 1 presents the distribution of the sample by year. It highlights the increase in RLBO activity in the 1990s and the 2000s. It also highlights that the level of RLBO activity remains modest (at least until the final two years of the sample) in relation to that of LBOs, venture capital-backed IPOs and that of IPOs as whole: overall, only 8% of the IPOs by number and 13% of the IPOs by market value between 1980 and 2002 are RLBOs. In total, the number of RLBOs represent 13% of the LBOs conducted during this period. While almost 150 private equity groups are represented, the bulk of the offerings
are by well-known groups such as Kohlberg, Kravis, Roberts, Forstmann Little, Citicorp Venture Capital, T.H. Lee, and Warburg Pincus.
Despite our efforts to be as comprehensive as possible, our sample may be subject to potential selection effects. Large and visible RLBOs are more likely to be included in the sample due to the fact that the buyout groups’ attempts at secrecy are less effective here. Although one cannot check ex post whether the sample used in this work is representative of the universe of RLBOs or not, we did two “sanity checks.” First, we asked several buyout firms to check whether our sample includes all the RLBOs that they have backed in practice. Second, we compared our sample those used in the existing literature to see whether it is consistent. Our sample performed well in the above two checks.
B. Supplemental Data
In addition, we use a variety of data on private equity returns in this study. This is drawn from the databases of the Center for Research into Security Pricing (CRSP) with the following exceptions:
• Benchmarks based on industry and size and book-to-market matched (5 X 5) portfolios are taken from Kenneth French’s website (http://mba.tuck.dartmouth.edu/pages/faculty/ken.french/index.html).5
• The benchmark of non-buyout backed IPOs is based on the SDC Corporate New Issues database, which reports 11,004 IPOs from 1980 through 2002. After eliminating American Depository Receipts, Real Estate Investment Trusts, closed-end funds, unit offerings, and spin-offs, as well as IPOs with an offering size smaller than $1.5 million, firm assets less than $5 million, or an offering price of
5French’s website contains a detailed description of the industry portfolio’s construction. The 5 X 5 portfolios, which are constructed at the end of each June, are the intersections of five portfolios formed on market capitalization and five portfolios formed on the ratio of book equity to market equity. The size breakpoints for year t are the NYSE market equity quintiles at the end of that June. The book-to-market for June of year t is the book equity for the last fiscal year end in t-1 divided by market capitalization for December of t-1. The BE/ME breakpoints are NYSE quintiles. All firms that have issued equity in the previous five years in either an IPO or a seasoned equity offering are not included.
under $5 per share, we have a final sample (including the 496 RLBOs) of 6,202 IPOs, of which 5,265 are listed in CRSP.
• The lead underwriters of all IPOs were identified from SDC Corporate New Issues database. (We also obtain from this database other information on the characteristics of the firm prior to the IPOs, such as assets and leverage.) The corresponding underwriter reputation measures are from Jay Ritter’ website
(http://bear.cba.ufl.edu/ritter/ipodata.htm), which are in turn based on Carter and Manaster (1990) and subsequent papers.
In addition, for our returns analysis, we require the RLBOs to be listed in CRSP, which reduces our sample to 428 RLBOs. In some analyses, we further require that all IPOs have information in SDC on the offering’s lead underwriter, and in Compustat on leverage and assets after the time of the offering. This reduces the sample to 364 RLBOs and 3,799 total IPOs.
Finally, we collect some information for the RLBOs exclusively. For the buyout group sponsoring the transaction, we determine the year of formation of its first fund and its total capital raised from its first fund to the most recent fund before the RLBO. This information was hand-collected from the SDC VentureXpert database. When multiple groups were investors, we used the information on the oldest or largest group (lead buyout firms), since we believed it would be critical in certifying the firm to investors. In addition, we manually collected from the prospectuses that the RLBOs filed with the U.S. Securities and Exchange Commission (SEC) information on the representation of the buyout group on the board of the firms and the buyout organization’s and management’s ownership holdings prior to and after the IPOs. This step further reduces our sample to a final sample of 251 RLBOs. The smaller sample of 251 is used whenever IPO ownership and governance data is analyzed. Otherwise, the larger sample of 364 RLBOs (COMPUSTAT-CRSP-SDC matched) or 428 (CRSP matched) is used.
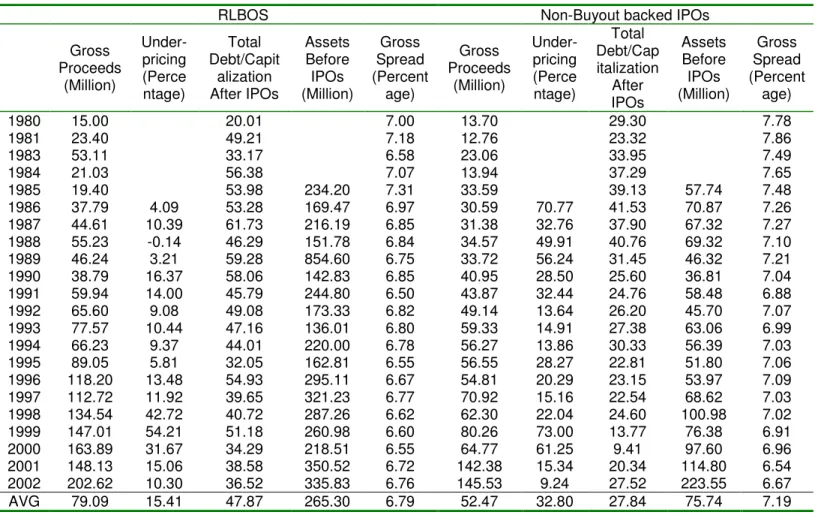
Tables 2, 3 and 4 summarize some of the key information collected. As Table 2 reports, the RLBOs are considerably larger than the other IPOs (again, excluding unit offering, ADRs, closed-end funds, REITs, and smaller offerings based on share prices,
assets, and offering size). These offerings are less underpriced: their first-day return is less than half that of the other offerings. There are also considerably more leveraged after the IPOs (this ratio is the book value of debt to the sum of the book value of debt and the market value of equity) and considerably more assets beforehand. Finally, at least partially reflecting the greater size of the offerings, the gross spread is lower for the RLBOs.6
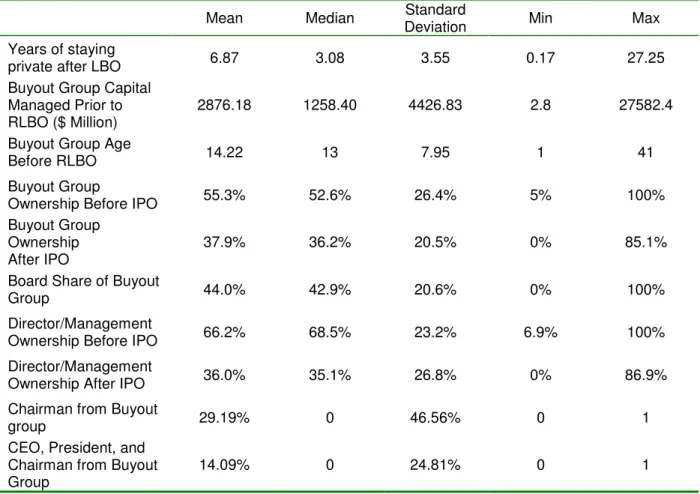
Table 3 provides some specific information about the RLBOs. The RLBO firms remain private for more than six years after LBOs. This is consistent with Kaplan (1992). The buyout groups’ total capital7 managed before the year of RLBO averages $2.9 billion, but with a tremendous range. Similarly, buyout groups are on average 14 years old at the time of the RLBO, but with a great deal of diversity. As noted, above, both measures will be used as a proxy for buyout group reputation. The buyout group (or groups, if multiple investors are present) typically holds a majority ownership of 55% in the RLBO firms before the IPO and the ownership stake decreases to 38% after the offering, largely due to the effect of dilution from new share issues.8 Managers and directors also take large equity stakes: their ownership decreases from 66% pre-IPO to 36% post-IPO. The buyout groups not only have large stakes in the RLBOs, but also actively monitor the managers. About 44% of the boards of directors are from or affiliated with buyout groups and 30% of RLBO firms have their chairman from buyout groups. In 14% of the cases, the president, CEO, and chairman (some of whom may hold multiple titles) are from or are affiliated with the buyout group.
Table 4 summarizes the characteristics and accounting performance of the RLBOs shortly after the offering. The RLBO firm characteristics include the following: equity
6The accounting data in this table are taken from SDC. In subsequent analyses, all accounting data employed is from Compustat.
7We replicate the analyses below using different measures of capital under management, and find the results are robust to their use.
8All ownership stakes are calculated on a common share equivalent basis: that is, convertible preferred shares are converted into common stock at the ratio then in effect (typically at the time of the IPO, all classes of preferred stock are converted into common shares).
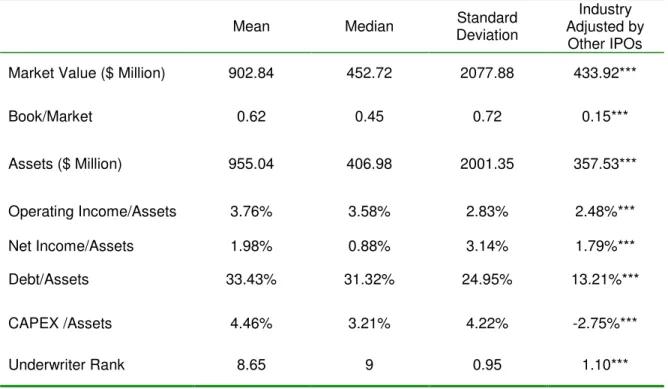
market capitalization, book-to-market ratio, assets, the ratio of operating income to assets, the ratio of net income to assets, the debt-to-assets ratio, the capital expenditures-to-assets ratio, and the underwriter reputation. For each measure (except the reputation measure), we obtain data from the quarter immediately after IPO or the end of the quarter of the IPO. We then report the cross-sectional summary statistics. The last column reports sample mean, adjusted by the industry averages, which we compute for each two-digit industry using the Standard Industrial Classification scheme.
Consistent with findings by DeGeorge and Zeckhauser (1993) and Holthausen and Larcker (1996), RLBOs have better financial performance than other IPOs. RLBO firms on average outperform the industry average. The operating return on assets (ROA) is 1.68% higher than the industry-adjusted average of other IPOs. Similar results hold for the ratio of net income to assets, which is 0.95% above the industry. Consistent with the earlier LBO literature, RLBO firms are more levered than others: their total debt to asset ratio is 30%, more than 9% above the industry median. Moreover, RLBOs are backed by more reputable underwriters than other IPOs; differences are again statistically significant.
3. Analysis of RLBO Performance
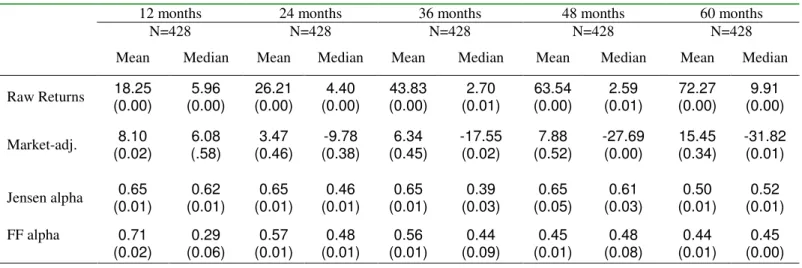
Panel A of Table 5 turns to the question at the heart of this study: whether RLBOs create value for investors. The table summarizes the cross-sectional mean and median performance measures of RLBOs within five years following the IPOs. The measures are the raw (unadjusted) buy-and-hold returns, the buy-and-hold returns adjusted by market (the value-weighted NYSE/AMEX/NASDAQ index), and the alphas (excess returns) from the capital asset pricing (CAPM) model (also known as Jensen’s alpha) and from a three-factor Fama-French model.9
9In the Fama-French regression, we employ as independent variables (in addition to the alpha, or constant term) RMRF, the value weighted market return on all NYSE/AMEX/NASDAQ firms (RM) minus the risk free rate (RF) that is the one-month Treasury bill rate, SMB (small minus big), the difference each month between the return on small- and large-capitalization firms, and HML (high minus low), the difference each month between a portfolio of high market stocks and the return on a portfolio of low book-to-market stocks.
The RLBOs deliver a raw buy-and-hold return of 18.25% over one year, 43.83% over three years, and 72.27% over five years after the IPOs. When this return is adjusted by value-weighted buy-and-hold market return, the mean remains positive, but is only statistically different from zero in the first year. (The previous study by Holthausen and Larcker (1996) did not find significant first year returns.) Risk-adjusted returns from the CAPM or Fama-French models are positive and significant over all the years after the IPOs. The coefficients on the alpha terms suggest that the offering outperform the market by between 0.4% and 0.6% per month in the five years after the offering.
In Table 5, the market–adjusted RLBO performance has the median sharply below the mean. When we run regressions and compute the Jensen and Fama-French alpha, the mean does not differ significantly from median. A potential explanation is the large dispersion in the RLBO returns: there are many negative returns as well as very large positive returns. Simialrly, the market adjusted return has a very negative median but the mean is dominated by the very large positive returns. While we estimate regressions, the magnitude of such outliers is limited by the control variables, substantially reducing the differences between the mean and median.
The evidence from Table 5 suggests that RLBOs outperform the market generally, but the extent depends on the evaluation methods. Panel B and C in Table 5 address the concerns in the literature (Mian and Rosenfeld (1993)) that performance of RLBOs is driven by premium paid for RLBOs which are acquired subsequent to the offerings. Panel B reports the performance of RLBOs for the sub-sample of firms that survive five years following the IPOs. Panel C reports the performance of sub-sample of firms that are merged within 60 months after the RLBOs. There are 252 firms that survive 60 months after the RLBOs. This sub-sample outperforms the market. For the surviving firms, the market-adjusted return is positive and significant after one year, two years, and three years following the RLBOs, but less consistently statistically significant thereafter. Panel C shows that the merged RLBO sub-sample consistently outperforms the market.
Over time, there have been “LBO waves,” where private equity groups have done a series of transactions in a single industry: for instance, many LBOs and RLBOs were in the 1980s were concentrated in the food retailing industry (Denis (1994), Chevalier (1995)). Moreover, different buyout groups have different industry foci.10 As a result, the industry mixture could be important factor to control for. More generally, Barber and Lyon (1997) argue that matching sample firms to control firms of similar size and with similar book-to-market ratios yield well-specified test statistics in the long-run performance studies.11 It might be particularly important to control for size and book-to-market since RLBOs are larger and have high book-to-book-to-market ratios than other firms, as Table 3 showed.
Figure 1 shows the geometric average returns for RLOBs over three years after going public. The bar shows the distribution of returns and the line is the fitted normal distribution. Two patterns emerge from the graph: (a) the bulk of the RLBO geometric returns are positive, with a positive median, and (b) the distribution of the geometric average returns is skewed, with fat tail at the left. These two patterns suggest that overall performance of RLBOs is positive and that poorly-performing RLBOs have strong impact on the distribution.
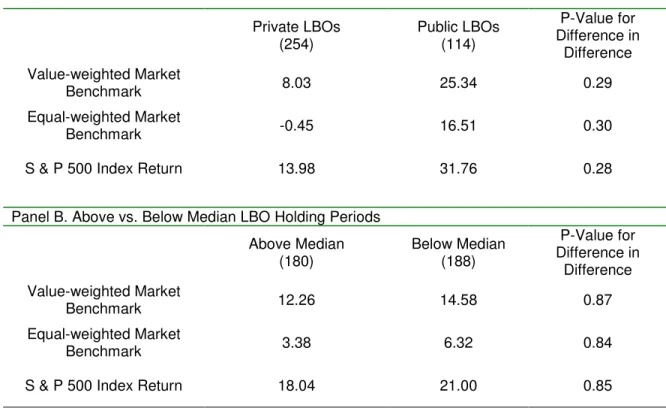
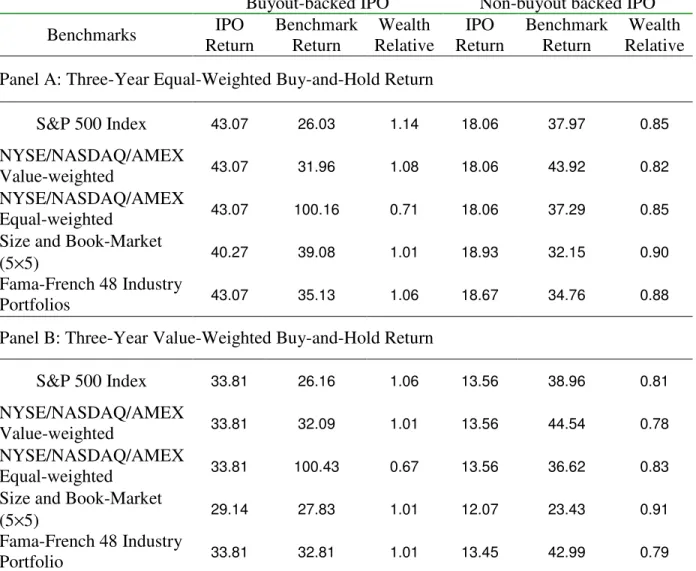
Table 6 looks at the performance of various sub-groups of R:BOs. Much of the discussion in the business press about the performance of RLBOs has focused on offerings that went public soon after being bought out, as well as public firms that were taken private and then returned to the public marketplace. This table breaks down the offerings by whether the firm at the time of the LBO was private or public, the months the firm kept private between the LBO and the RLBO, the use of proceeds as debt reduction or other. The public LBO firms perform better than their private counterparts when they go public. The difference, though economically large, is not statistically significant.
10For instance, the Carlyle Group established its initial reputation through transactions in defense industry, while Silver Lake Partners focuses on high-technology firms.
11Brav and Gompers (1997) find that after size and book-to-market ratios are controlled for, IPOs do not outperform the market, as the initial analyses in the literature suggested.
We also divide the sample according to the months after the LBO and before the RLBO. If a firm was kept private longer than median holding period of 37 months, it actually performs slightly worse than the ones kept private shorter. But when we examine the “quick flips”--the 53 RLBOs that went public within a year after the LBO—these RLBOs perform much worse than those firms kept longer than one year by buyout groups. The differences are not statistically significant, though. The evidence provides a partial support for the claim that “flipping” LBOs does not provide much value.
Panel D in Table 6 reports the sub-sample performance according to the use of proceeds to reduce debt or not. For the firms that use the funds from RLBOs to reduce or retire debt, performance is much better. The differences are not statistically significant when using the value-weighted market benchmark or S&P 500 index returns. For the equal-weighted benchmark, the differences are significant at 10% level. The evidence suggests that debt reduction seems to create value for RLBO firms.
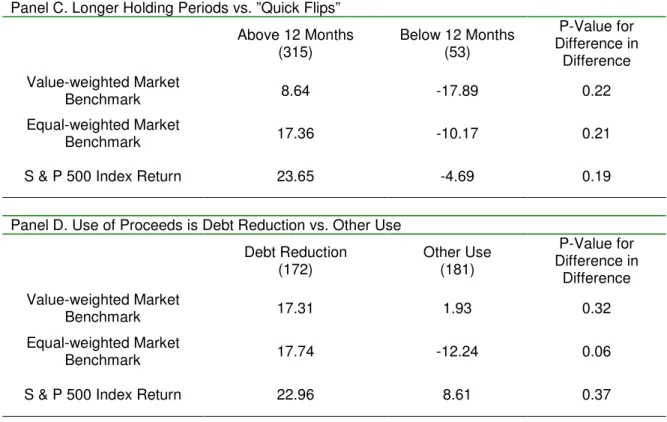
The analysis in the Table 7 uses different benchmarks to examine the three-year RLBO performances using monthly data. The benchmarks include the return of the S&P 500 index, equal- and value-weighted market portfolio, 5 X 5 Size and Book-to-Market portfolio returns, and the Fama-French 48 Industry portfolio. The performance measure employed is the wealth relative12 for the portfolios if RLBO firms, which is defined as
Wealth Relative= (1+Ri,T)/ (1+RBench i,T),
where Ri,T is the buy-and-hold return on IPO i for period T and RBench i,T is the
buy-and-hold return on the benchmark portfolio over the same period. Whenever a firm is delisted within 36 months, we calculated the buy-and-hold return up to the delisting date.
Panel A of Table 7 shows that when we equal-weight the RLBOs (that is, we treat each offering the same, regardless of size), they outperform various benchmarks, while
other IPOs underperform them by a considerable extent. The wealth relatives of the RLBOs are bigger than one for all benchmarks except for equal-weighted market portfolio, which is likely to be dominated by small (and presumably high-risk) NASDAQ companies.
Panel B shows the value-weighted RLBO performance. We form the weights in this and subsequent tables using first-available market value of the RLBOs from Compustat, which is from the end of the quarter of the IPO. The value-weighted RLBOs continue to perform at least as well as the market in general, and considerably better than other offerings, though the effects are not as dramatic.
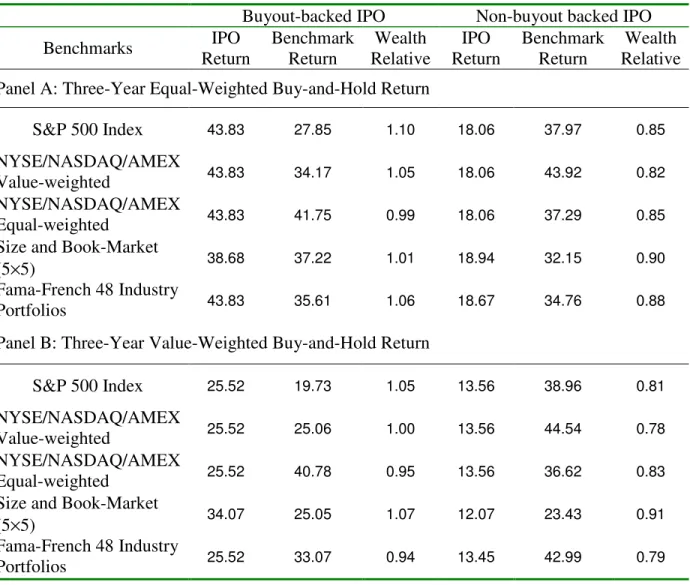
We explore the robustness of the results in several ways. We use daily, rather than monthly, returns data and compute five-year (rather than three-year) returns. Both sets of analyses, which lead to few substantial differences, are reported in the Table 8 and 9.
A natural question is whether the performance of RLBOs has varied over time. For instance, do offerings perform well initially, and then encounter difficulties? Have particular time periods been especially good or poor for RLBOs?
Figure 2 shows the event-time average excess returns for each of the five years following the RLBOs. Panels A and B report the market adjusted returns, and Panels C and D report the adjusted returns using 5 X 5 Size and Book-to-Market portfolios. RLBOs have positive excess returns over the first year, forth and fifth years after the IPOs. When equal weighted, RLBOs underperform in years 2 and 3, but value-weighted RLBOs always have positive excess returns.
Table 10 reports the three-year buy-and-hold returns for the RLBOs that took place in each calendar year. The long-run returns show great variation over the time. Performance tends to cluster together; the worst performances are concentrated in the mid- to late 1990s. There is, however, no regular pattern in long-run performance of other IPOs. Panel B of Table 10 shows that the value-weighted RLBOs perform better, with an
average wealth relative to S&P 500 of 1.26.13 This implies that following a buy-and-hold strategy, for every dollar earned holding the S&P 500 index, an investor would get 1.26 dollars if instead investing in the RLBOs. Again, the poorest performing years are in 1997 and 2000.
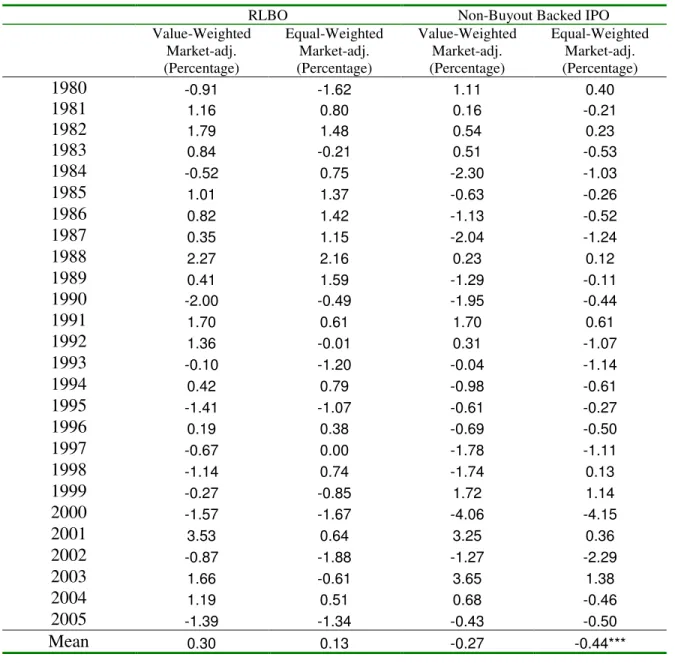
Tests of long-run performance with buy-and-hold returns are subject to a variety of measurement problems, which are discussed by Barber and Lyon (1997) among others. One way to address this issue is to analyze the returns in calendar time, which is somewhat different from that in Table 10. Rather than computing the subsequent returns for the RLBOs that went public in a given year, the returns are computed for each year for a portfolio of the RLBOs that went public in recent years. In Table 11, the portfolio is formed by including returns within three years following the IPOs. Once again, we equal- and value-weight the observations.
As the table reports, the equal-weighted portfolios have monthly excess returns of 0.30%, while other IPOs under-perform the market on average. The value-weighted RLBO calendar-time portfolios outperform the market strongly. The monthly excess returns adjusted by value- and equal-weighted market index are 1.29% and 1.03%, both statistically significant at 1% level. The market-adjusted RLBO return is positive in most years, with the negative returns clustering in the 1990s. Other IPOs show marked under-performance compared to the market. The excess returns adjusted by equal- and value-weighted market are –0.59% and –0.76% respectively, significant at 1% level. In contrast to the RLBOs, other IPOs only outperform the market in a few years (including 1998 and 1999, the Internet Bubble period).
We run both CAPM and Fama-French regressions and report the results in the Table 12. Consistent with the former univariate tests, we find value-weighted RLBOs outperform the market significantly. Alphas from CAPM and Fama-French are about 1% per month, significant at 1% level. RLBOs have positive exposures to firm size (SMB) factor; the SMB coefficient is 0.7, significantly different from zero at the 1% level of
statistical significance. The book-to-market (HML) factor coefficient is not significant. By way of contrast, other IPOs under-perform the market consistently. Consistent with Ritter and Welch (2002), non-buyout backed IPOs have a market beta of 1.38. Coefficients to SMB and HML factors are slightly smaller than those in Ritter and Welch paper. Both SMB and HML coefficients are significant in these estimates.
4. Cross-Sectional Differences across RLBOs
A natural next question has to do with the differences across offerings. What roles do buyout groups play in post-RLBO long-run performance? Does equity ownership and governance structure have any impact on post-RLBO long-run performance? Moreover, does the financial situation of the firm post-offering affect its subsequent performance, as one of the initial quotes suggested?
In this section, we seek to answer these questions with multivariate analyses that explain performance of RLBOs in the three years after going public. We find that the performance of RLBOs is cross-sectionally associated with ownership, governance, and the buyout group reputation proxies.
Table 13 reports the multivariate regression results conditional on the offering being an RLBO. The dependent variable is the natural logarithm of the three-year wealth relative, defined as above, where the benchmark is the value-weighted buy-and-hold return of the market. The right-hand side variables include the two proxies for buyout group reputation: the natural logarithm of the buyout firm’s capital under management and age at the RLBO date. In addition, we employ a dummy variable denoting whether the chairman of the firm is from the buyout group, the percentage of board controlled by the buyout group at the time of the IPO, the buyout firm’s equity ownership immediately after the firm’s IPO, the logarithm of the equity market capitalization at the end of the quarter of the IPO, the debt-to-total capitalization ratio after the IPO at the end of the quarter of the IPO (again computed as the book value of all outstanding debt divided by the sum of the book value of debt and the market value of equity), and the underwriter reputation. All variables except for the underwriter rank are computed using data from
the quarter immediately after IPO or the end of the quarter of the IPO. Columns 1 through 4 report the results from basic regressions; columns 5 through 8 with year and industry fixed effects.
When we first look at the buyout group reputation proxies without controls, we find that RLBOs by younger groups perform better. Changes in buyout group size, however, is associated with no change in performance. Contrary to the claims in the quote in the introduction, more levered offerings perform better, not worse. While greater representation of the buyout group on the board is positively (if insignificantly) associated with performance, companies with a buyout group affiliate as their chair perform poorly. One possibility is that in these firms, the transition to a public firm is more wrenching (typically, buyout groups’ representatives sever their ties to the companies at some point after the IPO).
We know, however, that the relative performance of IPOs differs across time periods. Moreover, as noted above, the industry composition of these buyouts has changed over time. It thus makes sense to add industry and offering year controls to the regressions.
When we do add these controls in the final four regressions in Table 13, we find that the negative coefficient on age disappears. The coefficient in the earlier regressions may have reflected the fact that offerings in the 1980s, when buyout groups were disproportionately young, did particularly well. Similarly, the coefficient on leverage is no longer significant. What is positive and significant in the final regression is the coefficient on buyout group size, while the coefficient for the market capitalization of the RLBO has no significant explanatory power. This result suggests that large RLBOs do particularly well because they are sponsored by large buyout groups.14
14In unreported regressions, we also add controls for the LBO group sponsoring the transaction. Once this control is added, the other independent variables are uniformly insignificant. This suggests the RLBOs of buyout groups that eventually become large outperform through the group’s life-span, and not just once they raise substantial amounts of funds.
5. Conclusions
In this paper, we take a comprehensive view of RLBOs over the past 25 years. The rapid growth in the private equity industry, and the changes in the industry’s structure in the past two decades, suggest the desirability of understanding the performance of offerings since the 1980s.
Examining a sample of nearly 500 offerings between 1980 and 2002, we find: • On average, RLBOs are much larger in size, have more leverage and higher
book-to-market ratios, are more profitable, and are backed by more reputable underwriters.
• Unlike other IPOs, LBOs, by and large, create wealth for equity holders in the long run. Value-weighted calendar time portfolios strongly outperform the market. When we explore the robustness of the results, CAPM and Fama-French models deliver the same results.
• The RLBO outperformance is especially strong in the first year, fourth and fifth years after the IPOs.
• The superior performance is not confined to a single time period, but has been found in the 1980s, 1990s, and 2000s.
• Larger RLBOs appear to perform better, but this seems driven by their sponsorship by larger buyout groups.
• Greater leverage after the IPO does not lead to poorer performance.
This research leaves a number of questions open, which we hope to explore in later work. First, we have taken an initial look at the buyout groups’ involvement with their portfolio firms and how it impacts value accretion of RLBOs. Characterizing in more detail the extent of the buyout groups’ involvement, and understanding the consequences of those connections, is challenging. But if these relationships can be tracked more carefully (as has been done in research on venture capital), they should help us enhance our understanding of the buyout process. Second, we have focused here exclusively on offerings that have gone public. The outcome of buyout investments more
generally, and the types of firms selected for each form of exit, remain surprisingly poorly understood.
References
Barber, Brad M., and John D. Lyon, 1997, Detecting Long-run Abnormal Stock Returns: the Empirical Power and Specification of Test Statistics, Journal of Finance, 43, 341-372.
Brav, Alon, and Paul A. Gompers, 1997, Myth or Reality? The Long-Run Underperformance of Initial Public Offerings: Evidence from Venture and Nonventure Capital-Backed Companies, Journal of Finance, 52, 1791-1821.
Chou, De-Wai, Michael Gombola, and Feng-Ying Liu, 2006, Earnings Management and Stock Performance of Reverse Leveraged Buyouts, Journal of Financial and Quantitative Analysis, forthcoming.
Cowan, Lynn, 2006, “Big Debt Often Lurks Behind IPOs,” Wall Street Journal, May 15, C4.
Degeorge, Francois; Zeckhauser, Richard, 1993, “The Reverse LBO Decision and Firm Performance: Theory and Evidence,” Journal of Finance, 48, 1323-48.
Holthausen, Robert W., and David F. Larcker, 1996, “The Financial Performance of Reverse Leveraged Buyouts,” Journal of Financial Economics, 42, 293-332.
Gompers, Paul, and Josh Lerner, 1999, "Conflict of Interest in the Issuance of Public Securities: Evidence from Venture Capital," Journal of Law and Economics, 42, 1-28. Hamao, Yasushi, Frank Packer, and Jay R. Ritter, 2000, “Institutional Affiliation and the Role of Venture Capital: Evidence from Initial Public Offerings in Japan,” Pacific-Basin Finance Journal, 8, 529-58
Jain, Bharat, and Omesh Kini, 2000, “Does the Presence of Venture Capitalists Improve the Survival Profile of IPO Firms?,” Journal of Business Finance and Accounting, 27, 1139-1183.
Kaplan, Steven N., 1989, “The Effects of Management Buyouts on Operating Performance and Value,” Journal of Financial Economics, 24, 217-254.
Kaplan, Steven N., 1997, "The Evolution of U.S. Corporate Governance: We are All Henry Kravis Now," Journal of Private Equity, 1, Fall, 7-14.
Kaplan, Steven N., and Jeremy C. Stein, 1993, “The Evolution of Buyout Pricing and Financial Structure in the 1980s,” Quarterly Journal of Economics, 108, 313-357.
Mian, Shehzad, and James Rosenfeld, 1993, “Takeover Activity and the Long-Run Performance of Reverse Leveraged Buyouts,” Financial Management, 22, Winter, 46-57
Muscarella, Chris J., and Michael R. Vetsuypens, 1990, “Efficiency and Organizational Structure: A Study of Reverse LBOs,” Journal of Finance, 45, 1389-1413.
Rickertsen, Rick, 2001, Buyout: The Insider's Guide to Buying Your Own Company, New York, Amacom.
Sorkin, Andrew R., 2005, “The Great Global Buyout Bubble,” New York Times, November 13, Section 3, 1 ff.
Table 1. Year Distribution of Reverse Leveraged Buyouts
The sample includes all RLBOs and other IPOs from January 1980 to December 2002. Column 2 and 3 present the numbers of RLBOs and LBOs for each year. Column 4 shows the yearly distribution of number of venture capital-backed IPOs. Column 5 shows the total number of IPOs, excluding American Depository Receipts, Real Estate Investment Trusts, closed-end funds, unit offerings, and IPOs with an offering size smaller than $1.5 million, firm assets less than $5 million, or an offering price of under $5 per share. Columns 6 and 7 compute RLBOs as percentage of LBOs and VC-backed IPOs, and Column 8 and 9 show RLBO as percentages of total IPOs in value and in number.
Year RLBOs LBOs Backed
VC-IPOs Total IPOs
RLBO as fraction of LBOs RLBO Share of VC-Backed IPOs RLBO Value Share of All IPO Value RLBO Share of All IPOs 1980 3 17 31 73 17.65% 9.68% 1.43% 4.11% 1981 1 15 77 189 6.67% 1.30% 2.45% 0.53% 1982 0 15 30 73 0.00% 0.00% 0.00% 0.00% 1983 10 46 138 475 21.74% 7.25% 0.73% 2.11% 1984 3 112 58 190 2.68% 5.17% 9.78% 1.58% 1985 11 153 46 198 7.19% 23.91% 16.17% 5.56% 1986 26 235 99 456 11.06% 26.26% 9.87% 5.70% 1987 34 212 75 305 16.04% 45.33% 2.15% 11.15% 1988 3 298 39 116 1.01% 7.69% 6.94% 2.59% 1989 5 299 40 113 1.67% 12.50% 13.87% 4.42% 1990 12 191 42 97 6.28% 28.57% 60.21% 12.37% 1991 39 181 113 227 21.55% 34.51% 40.47% 17.18% 1992 67 218 124 299 30.73% 54.03% 14.41% 22.41% 1993 40 180 176 473 22.22% 22.73% 4.15% 8.46% 1994 28 178 121 340 15.73% 23.14% 9.49% 8.24% 1995 18 209 178 389 8.61% 10.11% 10.96% 4.63% 1996 26 194 253 565 13.40% 10.28% 10.74% 4.60% 1997 37 202 127 417 18.32% 29.13% 15.96% 8.87% 1998 28 177 71 272 15.82% 39.44% 17.26% 10.29% 1999 33 183 261 440 18.03% 12.64% 12.28% 7.50% 2000 29 296 219 349 9.80% 13.24% 2.99% 8.31% 2001 22 167 44 75 13.17% 50.00% 11.24% 29.33% 2002 21 154 32 71 13.64% 65.63% 16.12% 29.58% Total 496 3915 2,394 6,202 12.67% 20.72% 13.17% 8.00%
Table 2. Summary Statistics for RLBOs and Other IPOs
The sample consists of 496 RLBOs and 5,706 other IPOs between January 1980 and December 2002. We exclude American Depository Receipts, Real Estate Investment Trusts, closed-end funds, unit offerings, and IPOs with an offering size smaller than $1.5 million, firm assets less than $5 million, or an offering price of under $5 per share. Mean characteristics for RLBOs and non-buyout backed IPOs are provided. Summary statistics include the mean gross proceeds, under-pricing (first-day return), leverage immediately after the IPOs (the ratio of the book value of all outstanding debt to the sum of equity market capitalization and the book value of debt), firm assets immediately prior to the IPOs, and gross spread. Information on underpricing is not available from SDC prior to 1986; that on assets is unavailable prior to 1985.
RLBOS Non-Buyout backed IPOs
Gross Proceeds (Million) Under-pricing (Perce ntage) Total Debt/Capit alization After IPOs Assets Before IPOs (Million) Gross Spread (Percent age) Gross Proceeds (Million) Under-pricing (Perce ntage) Total Debt/Cap italization After IPOs Assets Before IPOs (Million) Gross Spread (Percent age) 1980 15.00 20.01 7.00 13.70 29.30 7.78 1981 23.40 49.21 7.18 12.76 23.32 7.86 1983 53.11 33.17 6.58 23.06 33.95 7.49 1984 21.03 56.38 7.07 13.94 37.29 7.65 1985 19.40 53.98 234.20 7.31 33.59 39.13 57.74 7.48 1986 37.79 4.09 53.28 169.47 6.97 30.59 70.77 41.53 70.87 7.26 1987 44.61 10.39 61.73 216.19 6.85 31.38 32.76 37.90 67.32 7.27 1988 55.23 -0.14 46.29 151.78 6.84 34.57 49.91 40.76 69.32 7.10 1989 46.24 3.21 59.28 854.60 6.75 33.72 56.24 31.45 46.32 7.21 1990 38.79 16.37 58.06 142.83 6.85 40.95 28.50 25.60 36.81 7.04 1991 59.94 14.00 45.79 244.80 6.50 43.87 32.44 24.76 58.48 6.88 1992 65.60 9.08 49.08 173.33 6.82 49.14 13.64 26.20 45.70 7.07 1993 77.57 10.44 47.16 136.01 6.80 59.33 14.91 27.38 63.06 6.99 1994 66.23 9.37 44.01 220.00 6.78 56.27 13.86 30.33 56.39 7.03 1995 89.05 5.81 32.05 162.81 6.55 56.55 28.27 22.81 51.80 7.06 1996 118.20 13.48 54.93 295.11 6.67 54.81 20.29 23.15 53.97 7.09 1997 112.72 11.92 39.65 321.23 6.77 70.92 15.16 22.54 68.62 7.03 1998 134.54 42.72 40.72 287.26 6.62 62.30 22.04 24.60 100.98 7.02 1999 147.01 54.21 51.18 260.98 6.60 80.26 73.00 13.77 76.38 6.91 2000 163.89 31.67 34.29 218.51 6.55 64.77 61.25 9.41 97.60 6.96 2001 148.13 15.06 38.58 350.52 6.72 142.38 15.34 20.34 114.80 6.54 2002 202.62 10.30 36.52 335.83 6.76 145.53 9.24 27.52 223.55 6.67 AVG 79.09 15.41 47.87 265.30 6.79 52.47 32.80 27.84 75.74 7.19
Table 3. Summary Statistics for Buyout Firms.
The sample consists of 496 RLBOs between January 1980 and December 2002. The table reports summary statistics for the buyout firms sponsoring the RLBOs and the RLBOs themselves. The variables include years between the buyout and the RLBO, the total capital raised by the buyout group prior to the RLBO date, the buyout group’s age at the time of the offering (the years between buyout group’s first fund and RLBO year), the share of equity held by buyout group or groups and the management and directors as a whole before and after the IPO, the share of the board filled by representatives of the buyout group at the time of the IPO, dummy variables indicating whether the chairman of the firm was from (or was previously affiliated with) the buyout group and whether the CEO, president and chairman of the firm was from (or was previously affiliated with) the buyout group.
Mean Median Deviation Standard Min Max
Years of staying
private after LBO 6.87 3.08 3.55 0.17 27.25
Buyout Group Capital Managed Prior to
RLBO ($ Million) 2876.18 1258.40 4426.83 2.8 27582.4
Buyout Group Age
Before RLBO 14.22 13 7.95 1 41
Buyout Group
Ownership Before IPO 55.3% 52.6% 26.4% 5% 100%
Buyout Group Ownership
After IPO 37.9% 36.2% 20.5% 0% 85.1%
Board Share of Buyout
Group 44.0% 42.9% 20.6% 0% 100%
Director/Management
Ownership Before IPO 66.2% 68.5% 23.2% 6.9% 100%
Director/Management
Ownership After IPO 36.0% 35.1% 26.8% 0% 86.9%
Chairman from Buyout
group 29.19% 0 46.56% 0 1
CEO, President, and Chairman from Buyout
Table 4. Summary Statistics for RLBOs
The sample consists of 496 RLBOs between January 1980 and December 2002. The table reports summary statistics for the RLBO firms. The RLBO firm characteristics include the following: equity market capitalization, book-to-market ratio, assets, the ratio of operating income to assets, the ratio of net income to assets, the debt-to-assets ratio, the capital expenditures-to-assets ratio, and the underwriter reputation (on a zero to nine scale, with 9 being the highest). All variables except for the underwriter rank are computed using data from the quarter immediately after IPO or the end of the quarter of the IPO. The last column reports the industry-adjusted sample averages. Test statistics are based on Wilcoxon tests comparing the means of RLBOs and other IPOs.
Mean Median Deviation Standard Adjusted by Industry
Other IPOs
Market Value ($ Million) 902.84 452.72 2077.88 433.92***
Book/Market 0.62 0.45 0.72 0.15*** Assets ($ Million) 955.04 406.98 2001.35 357.53*** Operating Income/Assets 3.76% 3.58% 2.83% 2.48%*** Net Income/Assets 1.98% 0.88% 3.14% 1.79%*** Debt/Assets 33.43% 31.32% 24.95% 13.21%*** CAPEX /Assets 4.46% 3.21% 4.22% -2.75%*** Underwriter Rank 8.65 9 0.95 1.10***
Table 5. Event-Time Stock Performance
The sample consists of 496 RLBOs between January 1980 and December 2002. The raw returns are the buy-and-hold returns starting the day after the IPO and ending 12, 24, 36, 48, and 60 months after the IPO date. The market-adjusted returns are the buy-and-hold raw returns minus the buy-and-hold value-weighted NYSE/AMEX/NASDAQ index computed over the same 12-, 24-, 36-, 48- and 60-month time periods. Jensen alphas are the intercepts estimated by running firm-specific time-series regressions of monthly firm excess returns on the value weighted NYSE/AMEX/NASDAQ excess returns for 12, 24, 36, 48, and 60 months after the IPO. FF alphas are similar intercepts estimated using Fama-French factors as independent variables. If the sample firm delists, the raw return, market-adjusted return, Jensen’s alpha, and FF alpha are set equal to zero after the delisting date. The two-tailed significance levels reported in parentheses below the means are based on the one-sample t-test and the two-tailed significance levels reported below the median are based on the one-sample Wilcoxon test. All four stock return measures are expressed in percentages. Panel B is restricted to firms that remained listed for sixty months after the RLBO; Panel C is limited to firms acquired within sixty months of the RLBO.
Panel A: Total sample of RLBOs
12 months 24 months 36 months 48 months 60 months
N=428 N=428 N=428 N=428 N=428
Mean Median Mean Median Mean Median Mean Median Mean Median Raw Returns (0.00) 18.25 (0.00) 5.96 (0.00) 26.21 (0.00) 4.40 (0.00) 43.83 (0.01) 2.70 (0.00) 63.54 (0.01) 2.59 (0.00) 72.27 (0.00) 9.91 Market-adj. (0.02) 8.10 (.58) 6.08 (0.46) 3.47 (0.38) -9.78 (0.45) 6.34 -17.55 (0.02) (0.52) 7.88 -27.69 (0.00) (0.34) 15.45 -31.82 (0.01) Jensen alpha (0.01) 0.65 (0.01) 0.62 (0.01) 0.65 (0.01) 0.46 (0.01) 0.65 (0.03) 0.39 (0.05) 0.65 (0.03) 0.61 (0.01) 0.50 (0.01) 0.52 FF alpha 0.71
Panel B: Sample of Reverse Leveraged Buyouts still listed 60 months after month of IPO
12 months 24 months 36 months 48 months 60 months
N=251 N=251 N=251 N=251 N=251
Mean Median Mean Median Mean Median Mean Median Mean Median Raw Returns (0.00) 17.59 (0.00) 7.31 (0.00) 28.29 (0.00) 8.02 (0.00) 48.66 10.16 (0.00) 66.48 (0.00) (0.00) 9.08 (0.00) 87.85 (0.00) 9.35 Market-adj. (0.03) 9.32 (0.27) 0.22 (0.06) 9.09 (0.90) -7.56 (0.06) 13.85 -14.59 (0.31) (0.12) 12.7 -28.35 (0.12) (0.15) 12.95 -32.54 (0.09) Jensen alpha (0.06) 0.64 (0.03) 0.83 (0.06) 0.64 (0.03) 0.52 (0.06) 0.43 (0.03) 0.39 (0.06) 0.51 (0.03) 0.48 (0.06) 0.50 (0.03) 0.43
FF alpha (0.09) 0.61 (0.25) 0.01 (0.33) 0.22 (0.42) 0.25 (0.08) 0.32 (0.09) 0.22 (0.09) 0.28 (0.14) 0.25 (0.06) 0.29 (0.02) 0.12 Panel C: Sample of Reverse Leveraged Buyouts acquired within 60 months of the IPO
12 months 24 months 36 months 48 months 60 months
N=139 N=139 N=139 N=139 N=139
Mean Median Mean Median Mean Median Mean Median Mean Median Raw Returns (0.00) 19.18 (0.00) 5.92 (0.01) 42.05 (0.02) 26.27 (0.00) 56.93 30.97 (0.00) 68.23 (0.00) (0.00) 33.66 (0.00) 79.26 (0.00) 37.08 Market-adj. (0.04) 12.22 (0.32) 2.59 (0.03) 18.11 (0.31) -1.83 (0.02) 22.43 (0.34) 1.62 24.35 (0.05) (0.32) 0.43 (0.04) 29.43 (0.26) 5.08 Jensen alpha (0.03) 0.87 (0.03) 0.76 (0.02) 1.46 (0.08) 0.89 (0.00) 1.42 (0.00) 0.78 (0.00) 1.45 (0.00) 1.05 (0.00) 1.51 (0.00) 1.05 FF alpha (0.17) 0.75 (0.12) 0.52 (0.09) 1.62 (0.06) 0.97 (0.00) 1.62 (0.00) 0.95 (0.00) 1.57 (0.00) 1.18 (0.00) 1.32 (0.00) 1.02
Table 6. Three-Year Market-Adjusted Performance for Sub-Samples
The sample consists of 496 RLBOs* between January 1980 and December 2002. For each IPO, the returns are calculated by compounding monthly returns for 35 months after the IPO, less the buy-and-hold return on the benchmark over the same period. If the IPO is delisted before 35th month we compound the return until the delisting date. The last column reports the P-value of the difference between two sub-samples. Observations are divided by whether the firm was public or privately held prior to the LBO, the holding period between the LBO and the RLBO, and the use of proceeds as debt reduction.
Panel A. Private LBOs vs. public LBOs
Private LBOs (254) Public LBOs (114) P-Value for Difference in Difference Value-weighted Market Benchmark 8.03 25.34 0.29 Equal-weighted Market Benchmark -0.45 16.51 0.30
S & P 500 Index Return 13.98 31.76 0.28
Panel B. Above vs. Below Median LBO Holding Periods Above Median (180) Below Median (188) P-Value for Difference in Difference Value-weighted Market Benchmark 12.26 14.58 0.87 Equal-weighted Market Benchmark 3.38 6.32 0.84
S & P 500 Index Return 18.04 21.00 0.85
Panel C. Longer Holding Periods vs. ”Quick Flips” Above 12 Months (315) Below 12 Months (53) P-Value for Difference in Difference Value-weighted Market Benchmark 8.64 -17.89 0.22 Equal-weighted Market Benchmark 17.36 -10.17 0.21
S & P 500 Index Return 23.65 -4.69 0.19
Panel D. Use of Proceeds is Debt Reduction vs. Other Use Debt Reduction (172) Other Use (181) P-Value for Difference in Difference Value-weighted Market Benchmark 17.31 1.93 0.32 Equal-weighted Market Benchmark 17.74 -12.24 0.06
S & P 500 Index Return 22.96 8.61 0.37
Table 6 reports only 368 RLBOs in Panel A, B, C and reports 353 RLBOs in Panel D, which are smaller than the CRSP matched RLBOs sample of 428. This results from the missing information on LBOs/IPOs in our sample.
Table 7. Three-Year Unadjusted and Benchmark Performance using Monthly Returns
The sample consists of 496 RLBOs and 5,706 other IPOs between January 1980 and December 2002. Three-year equal- and value-weighted returns for IPOs are computed using alternative benchmarks. The value-weighted returns in Panel B are formed using the market value of the firm at the end of the quarter of its IPO. For each IPO, the returns are calculated by compounding monthly returns for 35 months after the IPO. If the IPO is delisted before 35th month we compound the return until the delisting date. Wealth relatives are calculated as W= (1+Ri,T)/ (1+RBench i,T), where Ri,T is the buy-and-hold return on IPO i for period T and
RBench i,T is the buy-and-hold return on the benchmark portfolio over the same period.
Buyout-backed IPO Non-buyout backed IPO Benchmarks Return IPO Benchmark Return Relative Wealth Return IPO Benchmark Return Relative Wealth Panel A: Three-Year Equal-Weighted Buy-and-Hold Return
S&P 500 Index 43.83 27.85 1.10 18.06 37.97 0.85 NYSE/NASDAQ/AMEX
Value-weighted 43.83 34.17 1.05 18.06 43.92 0.82
NYSE/NASDAQ/AMEX
Equal-weighted 43.83 41.75 0.99 18.06 37.29 0.85
Size and Book-Market
(5×5) 38.68 37.22 1.01 18.94 32.15 0.90
Fama-French 48 Industry
Portfolios 43.83 35.61 1.06 18.67 34.76 0.88
Panel B: Three-Year Value-Weighted Buy-and-Hold Return
S&P 500 Index 25.52 19.73 1.05 13.56 38.96 0.81 NYSE/NASDAQ/AMEX
Value-weighted 25.52 25.06 1.00 13.56 44.54 0.78
NYSE/NASDAQ/AMEX
Equal-weighted 25.52 40.78 0.95 13.56 36.62 0.83
Size and Book-Market
(5×5) 34.07 25.05 1.07 12.07 23.43 0.91
Fama-French 48 Industry
Portfolios 25.52 33.07 0.94 13.45 42.99 0.79
The Size and Book-Market Portfolio requires RLBO sample to have data/information on Size and Book-to-Market ratio. We drop those RLBOs that have missing Book-to-Market ratio.
Table 8. Three-Year Unadjusted and Benchmark Performance using Daily Returns
The sample consists of 496 RLBOs and 5,706 other IPOs between January 1980 and December 2002. Three-year equal- and value-weighted returns on IPOs are compared with alternative benchmarks. The value-weighted returns in Panel B are formed using the market value of the firm at the end of the quarter of its IPO. For each IPO, the monthly returns are calculated by compounding daily returns up to the end of the month of the IPO and from then on compounding monthly returns for 35 months. If the IPO is delisted before 35th month we compound the return until the delisting date. Wealth relatives are calculated as (1+Ri,T)/
(1+RBench i,T), where Ri,T is the buy-and-hold return on IPO i for period T and RBench i,T is the
buy-and-hold return on the benchmark portfolio over the same period.
Buyout-backed IPO Non-buyout backed IPO Benchmarks Return IPO Benchmark Return Relative Wealth Return IPO Benchmark Return Relative Wealth Panel A: Three-Year Equal-Weighted Buy-and-Hold Return
S&P 500 Index 43.07 26.03 1.14 18.06 37.97 0.85 NYSE/NASDAQ/AMEX
Value-weighted 43.07 31.96 1.08 18.06 43.92 0.82
NYSE/NASDAQ/AMEX
Equal-weighted 43.07 100.16 0.71 18.06 37.29 0.85
Size and Book-Market
(5×5) 40.27 39.08 1.01 18.93 32.15 0.90
Fama-French 48 Industry
Portfolios 43.07 35.13 1.06 18.67 34.76 0.88
Panel B: Three-Year Value-Weighted Buy-and-Hold Return
S&P 500 Index 33.81 26.16 1.06 13.56 38.96 0.81 NYSE/NASDAQ/AMEX
Value-weighted 33.81 32.09 1.01 13.56 44.54 0.78
NYSE/NASDAQ/AMEX
Equal-weighted 33.81 100.43 0.67 13.56 36.62 0.83
Size and Book-Market
(5×5) 29.14 27.83 1.01 12.07 23.43 0.91
Fama-French 48 Industry
Portfolio 33.81 32.81 1.01 13.45 42.99 0.79
The Size and Book-Market Portfolio require RLBO sample to have data/information on Size and Book-to-Market ratio. We drop those RLBOs that have missing Book-to-Market ratio. The difference between monthly and daily results mainly comes from micro-structure issues in the daily data.
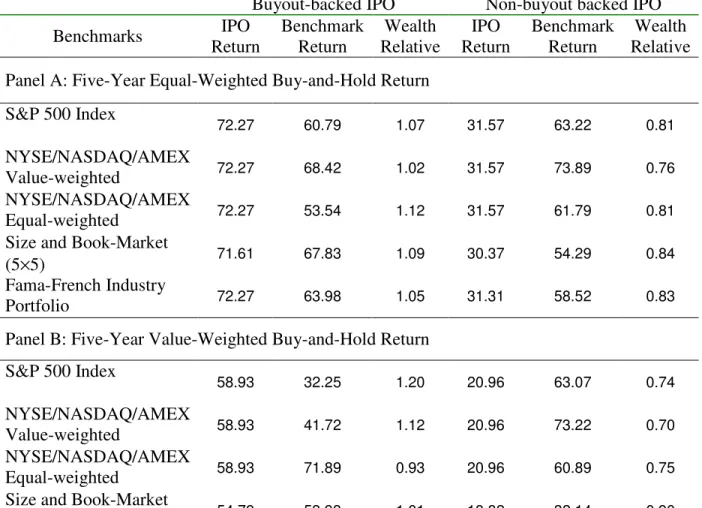
Table 9. Five-Year Unadjusted and Benchmark Performance using Monthly Returns
The sample consists of 496 RLBOs and 5,706 other IPOs between January 1980 and December 2002. Five-year equal- and value-weighted returns on IPOs are computed using alternative benchmarks. The value-weighted returns in Panel B are formed using the market value of the firm at the end of the quarter of its IPO. For each IPO, the returns are calculated by compounding monthly returns for 59 months after the IPO. If the IPO is delisted before 59th month we compound the return until the delisting date. Wealth relatives are calculated as W= (1+Ri,T)/ (1+RBench i,T), where Ri,T is the buy-and-hold return on IPO i for period T and
RBench i,T is the buy-and-hold return on the benchmark portfolio over the same period.
Buyout-backed IPO Non-buyout backed IPO Benchmarks Return IPO Benchmark Return Relative Wealth Return IPO Benchmark Return Relative Wealth Panel A: Five-Year Equal-Weighted Buy-and-Hold Return
S&P 500 Index 72.27 60.79 1.07 31.57 63.22 0.81
NYSE/NASDAQ/AMEX
Value-weighted 72.27 68.42 1.02 31.57 73.89 0.76
NYSE/NASDAQ/AMEX
Equal-weighted 72.27 53.54 1.12 31.57 61.79 0.81
Size and Book-Market
(5×5) 71.61 67.83 1.09 30.37 54.29 0.84
Fama-French Industry
Portfolio 72.27 63.98 1.05 31.31 58.52 0.83
Panel B: Five-Year Value-Weighted Buy-and-Hold Return
S&P 500 Index 58.93 32.25 1.20 20.96 63.07 0.74
NYSE/NASDAQ/AMEX
Value-weighted 58.93 41.72 1.12 20.96 73.22 0.70
NYSE/NASDAQ/AMEX
Equal-weighted 58.93 71.89 0.93 20.96 60.89 0.75
Size and Book-Market
(5×5) 54.79 53.93 1.01 18.82 32.14 0.90
Fama-French 48 Industry
Portfolio 58.93 54.77 1.03 23.03 71.09 0.72
The Size and Book-Market Portfolio requires RLBO sample to have data/information on Size and Book-to-Market ratio. We drop those RLBOs that have missing Book-to-Market ratio.