Productivity in Chinese Banking Industry
by
Xu Zhang
B.Sc. (Finance), Southwestern University of Finance and
Economics, China
M.Sc. (International Economics, Banking and Finance),
Cardiff University, UK
A Thesis Submitted in Fulfilment of the Requirements for the Degree
o f Doctor of Philosophy of Cardiff University
Cardiff Business School, Cardiff University
UMI Number: U517053
All rights reserved
INFORMATION TO ALL USERS
The quality of this reproduction is dependent upon the quality of the copy submitted. In the unlikely event that the author did not send a complete manuscript and there are missing pages, these will be noted. Also, if material had to be removed,
a note will indicate the deletion.
Dissertation Publishing
UMI U517053
Published by ProQuest LLC 2013. Copyright in the Dissertation held by the Author. Microform Edition © ProQuest LLC.
All rights reserved. This work is protected against unauthorized copying under Title 17, United States Code.
ProQuest LLC
789 East Eisenhower Parkway P.O. Box 1346
C
a r d iff
UNIVERSITY
D EC L A R A T IO N
This work h a s not previously b ee n a c c e p te d in su b s ta n c e for any d e g re e and is not concurrently subm itted in can didature for any d e g re e
S ig n e d f a .... . (Xu Zhang) D ate % I /! 2 * 4 0 b :0 . . Ca r d i f f Bu s i n e s s S c h o o l STATEMENT 1
This th e sis is being subm itted in partial fulfillment of th e requirem ents for the d eg ree of (insert MCh, Md, MPhil, PhD etc, a s appropriate)
S igned
D ate Z l u / V & O
(Xu Z hang)
STATEMENT 2
This th e sis is th e result of my own in dependent work/investigation, ex cep t w here otherw ise stated
O ther so u rc e s a re acknow ledged by footnotes giving explicit referen ces.
S igned
D ate I • i f * * ! ! .
(Xu Z hang)
STATEMENT 3
I hereby give c o n se n t for my thesis, if accep ted , to be available for photocopying and for inter-library loarf an d for th e title and sum m ary to b e m ad e available to outside organisations.
S ig n e d ... (Xu Z hang)
ACNOWLEDGEMENTS
I owe my deepest gratitude to many people for their help, support, and inspiration.
First o f all, I am heartily thankful to my primary supervisor, Professor Kent Matthews, whose encouragement, motivation, enthusiasm, patience and profound knowledge from the initial to the final level enabled me to complete this Ph. D study. Without his support, this thesis would not have been possible to the end. Special
thanks also to my second supervisor, Professor Jason Xiao, for his valued comments.
Thanks also to Professor Keith Whitfield and the former dean Professor Bob McNabb for facilitating the smooth process of the part-time Ph.D and sponsorship from Cardiff Business School.
I would like to express my appreciation to my family, my parents and my sister, for their endless love, consistent supports and encouragement.
I am grateful to Mr. Jianguang Guo and Miss Tian Zhang, for coaching me Matlab, which is an important tool for my empirical works.
Lastly, I offer my regards and blessings to all o f those who supported me in any respect during the completion o f the thesis.
This thesis is about measuring and interpreting banking efficiency in China. It consists o f three empirical essays that use Data Envelopment Analysis (DEA) in three novel ways to measure inefficiency. The first essay measures cost inefficiency of the 14 nationwide banks over the period 1997-2006. A rational model of rent-seeking behaviour is used to explain part o f the cost inefficiency. Cost inefficiency is decomposed into X-inefficiency and Rent-seeking inefficiency and the latter is interpreted as symptomatic o f rational decision making by the Chinese bank manager. The efficiency estimates are obtained from a Simar and Wilson (2000a) proposed bootstrap method. A second stage regression model explains that the rate of decline of the inefficiencies is faster for the joint-stock commercial banks (JSCBs) than for the state-owned commercial banks (SOCBs). The second essay, estimates total factor productivity (TFP) growth for SOCBs, JSCBs and city commercial banks (CCBs) for the period 1997-2007. The method o f estimation is the Malmquist bootstrap method. This study finds that TFP growth did not improve significantly in the run up to WTO. Technical innovation was dominated by the big banks and efficiency gains were dominated by the CCBs. The third essay uses a network DEA (NDEA) framework to analyse profit efficiency between three profit centres within the bank, namely consumer, corporate and Treasury banking. The internal efficiencies of the state wide banks are analysed for the period 2007-2009. The study demonstrates the value of the NDEA method in aiding the manager to identify areas o f inefficiency within the internal flow o f funds o f the bank. The results show Treasury operations have the lowest efficiency. This is partly caused by restrictions on the loan-deposit ratio that forces the banks to hold lower yielding other earning assets through their Treasury operations.
TABLE OF CONTENTS
The Title o f Thesis i
Declaration ii
Acknowledgments iii
Abstract iv
Table o f Contents v
List o f Figures vii
List o f Tables viii
List o f Appendix ix
C hapter 1 Introduction and Motivation ... 1
1.1 In tro d u ctio n ...1
1.2 Cost Efficienqr in Chinese Banks... 2
1 3 B ank Productivity... 6
1.4 B ank Interm ediate O utputs and Interm ediate In p u ts...9
1 3 Structure o f the T hesis...10
1.6 Epilogue...11
C hapter 2 The State o f Chinese Banking... 12
2.1 In tro d u ctio n ...12
2 2 Chinese Banking from Ancient Tim es...13
2 3 From Socialist Planning to M arket Based B anking...18
2.4 Banking and the Economy... 25
2 3 Structure and Perform ance... 29
2.6 Sum m ary and Prognosis... 34
C hapter 3 B ank Efficiency... 41
3.1 In tro d u ctio n ... 41
3 3 Efficiency: A two-dimensional description... 42
3 3 Efficiency: A multi-dimensional approach... 45
3.3.1 Input Orientated Version... 49
3.3.2 Output Orientated Version... 52
3.3.3 Banker, Chames, and Cooper Version...54
3.4 Productivity... 56
3 3 Network DEA... 59
3.6 DEA in B anking... 65
3.7 Sum m ary... 69
C hapter 4 Banking Data... 75
4.1 In tro d u ctio n ... 75
4 3 Sample Size and Sources of D ata... 76
4 3 In p u t and O utput Selection... 78
4.4 Efforts to Reduce Non-performing Loans...84
4 3 Assumptions for Missing D ata... 88
4.5.1 N PLs... 88
4.5.2 Estimation o f Personnel cost...89
4.6 L ab o u r... 90
4.10 O verheads... 98
4.11 Price of Factor Inputs...100
4.12 Sum m ary...101
C hapter 5 R ent Seeking Versus X-Efficiency: An Interpretation of Inefficiency in Chinese Banking...—... 103
5.1 In tro d u ctio n ...103
5 2 Background and M ethodology...106
5 3 X-Efficiency and L iterature Review...110
5.4 D ata and R esults...115
5 3 Em pirical Results...118
5.6 Conclusion... 126
C hapter 6 Productivity in Chinese Banks: An Exercise in M easurement.... 138
6.1 In tro d u ctio n ... 138
6 3 Chinese B anking...141
6 3 Methodology and L iterature...144
6.4 Banking d a ta ... 150
6 3 Em pirical Results...155
6.6 Conclusion...164
C hapter 7 Chinese Banking: A Network Data Envelopment Analysis Fram ew ork 190 7.1. In tro d u ctio n ... 190
7 3 Conceptual F ram ew ork...191
7 3 M ethodology... 195 7.4 D ata... 202 7 3 R esults... 211 7.6 Conclusion... 219 C hapter 8 Conclusion 230 References 235
vii
LIST OF FIGURES
Figure 1.1 Dollar deposits per employee... 3
Figure 1.2 Excess staffing as a rational outcome... 5
Figure 1.3 Technical progress and efficiency gain... 8
Figure 2.1 Capitalisation Share... 16
Figure 2.2 Deposit Funds Share... 16
Figure 2.3 Ratio o f banking assts to GDP 1971 - 2008... 27
Figure 2.4 Source o f financing in China... 27
Figure 2.5 Inter-regional domestic financing... 28
Figure 2.6 Economic contribution and bank financing... 29
Figure 2.7 ROA and NIM o f SOCBs (1991-2007)... 30
Figure 2.8 NPL Ratio o f SOCBs... 31
Figure 2.9 Banking Sector Market Share by Total Assets 2008...34
Figure 3.1 Overall, Technical and Allocative Efficiency... 43
Figure 3.2 Pure technical and scale efficiency... 44
Figure 3.3 Mamquist measure... 57
Figure 3.4 Network DEA Serial Process... 60
Figure 3.5 Illustration o f network Structure o f a DMU... 62
Figure 4.1 NPL ratio o f state owned commercial banks 1997-2007...87
Figure 4 2 NPL (RMB billion) SOCBs and JSCBs 1997 - 2007...87
Figure 4.3 Comparison o f employee number in SOCBs and JSCBs... 91
Figure 4.4 Total employee number o f big-5 1997 - 2007... 91
Figure 4.5 Growth o f fixed assets of SOCBs and JSCBs 1997 ~ 2007...92
Figure 4.6 Fixed assets per capita o f SOCBs and JSCBs 1997 — 2007...93
Figure 4.7 Total deposits o f SOCBs and JSCBs 1997 - 2007 ...93
Figure 4.8 Total loans o f SOCBs and JSCBs 1997 ~ 2007... 94
Figure 4.9 Deposit breakdown o f JSCBs in 2007... . 95
Figure 4.10 Loan breakdown of JSCBs in 2007... 95
Figure 4.11 Net interest income 1997-2007 ... 96
Figure 4.12 Net interest income share among JSCBs in 2007... 96
Figure 4.13 Non-interest Income 1997-2007 ... 98
Figure 4.14 SOCBs overheads 1997 ~ 2007... 98
Figure 4.15 JSCBs overheads 1997 ~ 2007... 99
Figure 4.16 Personnel cost to overheads, 2007... 99
Figure 4.17 Unit Personnel Cost in Banking 1997-2007...101
Figure 5.1 Technical Efficiency and Allocative Efficiency...108
Figure 5.2 Trade off between X-efficiency and Rent Seeking ... 122
Table 2.1 Status o f Foreign Banks in China (as of end-2008)... 21
Table 2 2 Chinese banking Market... 22
Table 2.3 Entry o f Overseas Investors (2003 - 2008)... 24
Table 2.4 Foreign Bank Ownership Stdee...24
Table 2.5 Domestic Savings and Flow o f Funds... 26
Table 2.6 Measures o f Market Structure... 33
Table 3.1 CCR DEA M odel... 54
Table 4.1 List o f banks and sample period... 77
Table 4 2 Input and output se t... 81
Table 4.3 Input and Output Variables for 1997,2000,2004 and 2007 (million RMB) per bank group... 82
Table 4.4 Transference o f NPLs from SOCBs to AMCs in 1999 and 2000...88
Table 4.5 Survey o f Chinese Bank Salaries... 90
Table 4.6 Summary Statistics Price o f Factors...100
Table 5.1 Output-Input Variables 1997 - 2006 (million RM B)...118
Table 5.2 Bootstrap Estimates o f Technical efficiency (Bias corrected, median estimates)... 119
Table 5.3 Bootstrap Estimates o f Inefficiency (Bias corrected, median estimates).. 120
Table 5.4 Mean inefficiency, Unadjusted loans and NPL adjusted loans... 123
Table 5.5 All banks, 1997-2006, SURE estimation, SE values in parenthesis 125 Table 6.1 The Chinese banking Market... 142
Table 6 2 Model structure... 153
Table 6.3 Output-Input Variables 1999 and 2007...154
Table 6.4 Weighted annual average of productivity growth 1998 - 2007... 156
Table 6.5 Best Practice Banks... 159
Table 6.6 Total Factor Productivity Growth in sub-samples...159
Table 6.7 SURE Regression, 1998-2007,/? values in parenthesis... 164
Table 7.1 The divisional functionalities of commercial bank...193
Table 7.2 Data Availability... 202
Table 7.3 Primary inputs and outputs in 2009... 203
Table 7.4 Average percentage o f operating expenses for three divisions 2009...204
Table 7.5 Average percentage o f net fee income for three divisions 2009...205
Table 7.6 Divisional flow o f fends... 206
Table 7.7 Divisional flow o f fends 2009... 207
Table 7.8 Reference rate 2007... 208
Table 7.9 Intermediate input and output (actual and simulated data) 2009...210
Table 7.10 Profit Efficiency o f Chinese Banks 2009: Network DEA... 212
Table 7.11 Projections for Treasury banking profit centre 2009... 214
Table 7.12 Meta-Frontier DEA and network DEA 2007-2009... 217
Table 7.13 Financial Ratio profiling Chinese Banks 2007-2009...218
LIST OF APPENDIX
Appendix 2-1 Significant events of major financial reforms... 36
Appendix 3-1 Summary of Studies on bank productivity... 71
Appendix 5-1 Bootstrap Algorithm... 129
Appendix 5-11 Bootstrapped Estimations of Efficiencies (1,000 bootstrap)... 132
Appendix 6-1 Bootstrap Algorithm... 167
Appendix 6-II Bootstrapped Estimations of TFP (2,000 bootstrap)...169
Appendix 7-1 Network DEA: Primary inputs and outputs... 221
Appendix 7-H Average percentage of operating expenses for three divisions...224
Appendix 7-m Average percentage o f net fee income for three divisions...225
Appendix 7-IV Reference rate and inter-divisional pricing rate... 226
Appendix 7-V Intermediate input and output... 227
Chapter 1
Introduction and M otivation
“Nothing will ever be attempted if all possible objections must first be overcome.”
Samuel Johnson
1.1 Introduction
Napoleon Bonaparte (1761-1821) once said ‘Let China sleep. For when she awakes, she will shake the world’. The awakening o f the Chinese dragon can be traced to the reform process initiated by Deng Xiao Ping in 1978. Yet while industrial China moved ahead in great leaps and bounds, for long its banking sector lagged behind in the reform process. Handicapped by bureaucratic management style and a large non-performing loan structure, the approach to banking reform has been cautious and piecemeal. In 2010 Chinese banking resembles a modem banking system with a harmonised regulatory framework that matches international standards in capital adequacy and risk managem ent. The last of the big state-owned commercial banks (Agricultural Bank o f China) was listed on the Shanghai and Hong Kong stock exchanges in July 2010. Whereas profit was a by-product of banking activity in the past, particularly for the state-owned banks (SOCBs) which had social and political objectives, in current times profit is the central objective of the banking unit.
This thesis examines some aspects of Chinese banking that sheds light on the process o f evolution from the 1990s to the present. The central theme o f this thesis is efficiency in Chinese banking. The technology used to measure efficiency is the Data
Chapter 1 Introduction and Motivation
2
Envelopment Analysis familiarly known as DEA. The DEA is a linear programming
method that maximises*the ratio o f weighted outputs to weighted inputs (or the dual minimises the ratio o f weighted inputs to outputs). While the topic of bank efficiency has been well trodden both in China and in overseas research, this thesis develops and presents an innovative approach that has hitherto not been applied extensively to Chinese banking. This thesis consists o f three empirical chapters. The following sections outline the main theme of each empirical chapter.
1.2 Cost Efficiency in Chinese Banks
The first chapter uses non-parametric methods to examine cost efficiency in Chinese banks. Its contribution is twofold. First the method of estimation uses a bootstrapping technology provided by the seminal work o f Simar and Wilson (1998) (2000a) (2000b) to produce measures o f efficiency (or inefficiency) that allows for statistical inference1. Second it decomposes cost inefficiency into technical inefficiency and allocative inefficiency. Briefly technical inefficiency measures the excess use of inputs in producing a vector o f outputs relative to the benchmark or alternative the under-production o f the vector o f outputs given a vector of inputs, relative to the benchmark. In much o f the literature, technical efficiency (or inefficiency = 1 - efficiency) has been viewed as X-efficiency (or its inverse, X-inefficiency). This empirical chapter follows in this tradition and also interprets allocative inefficiency as indicative o f rent-seeking. Bureaucratic rent-seeking behaviour is used to explain over-staffing in Chinese banks. Overstaffing has declined considerably since 1997 and is less o f a problem in 2007-8. Crude measures of over-staffing can be obtained
1 MATLAB and R codes of the algorithms are available on the respective websites of Simar and Wilson.
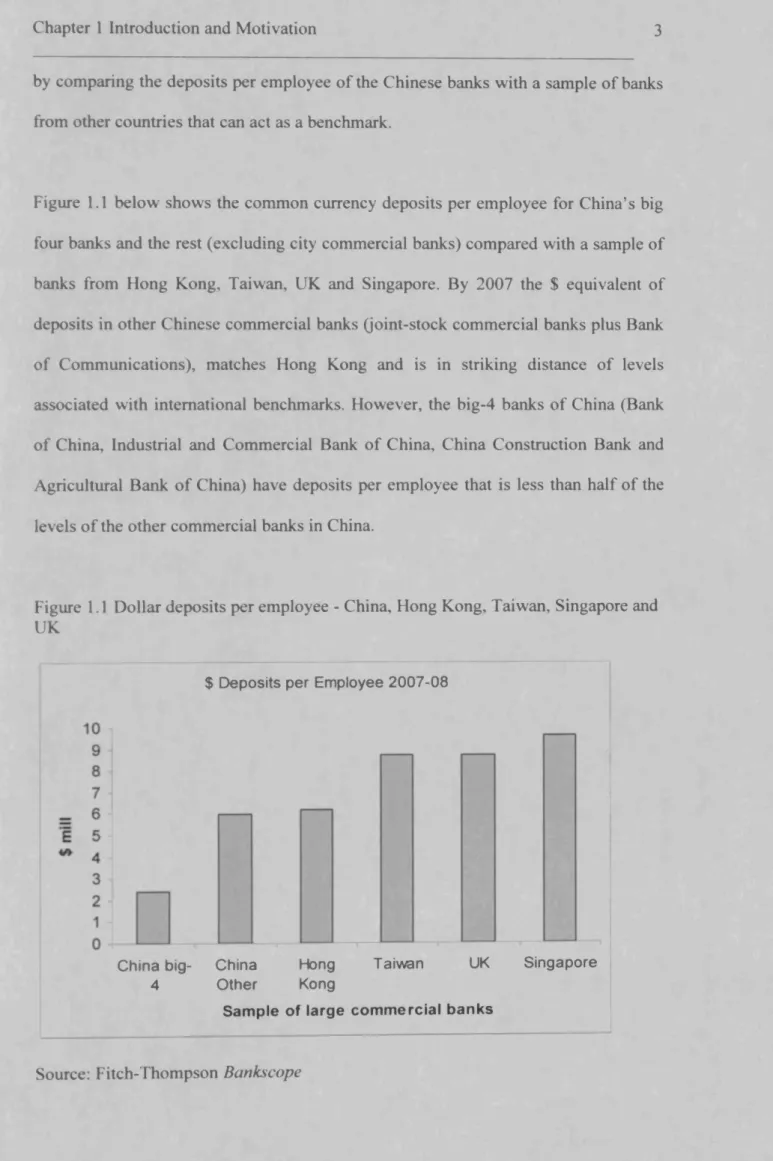
by comparing the deposits per employee of the Chinese banks with a sample of banks from other countries that can act as a benchmark.
Figure 1.1 below shows the common currency deposits per employee for China’s big four banks and the rest (excluding city commercial banks) compared with a sample of banks from Hong Kong, Taiwan, UK and Singapore. By 2007 the $ equivalent of deposits in other Chinese commercial banks (joint-stock commercial banks plus Bank of Communications), matches Hong Kong and is in striking distance of levels associated with international benchmarks. However, the big-4 banks of China (Bank of China, Industrial and Commercial Bank o f China, China Construction Bank and Agricultural Bank o f China) have deposits per employee that is less than half of the levels o f the other commercial banks in China.
Figure 1.1 Dollar deposits per employee - China, Hong Kong, Taiwan, Singapore and UK
$ D e p o sits p e r E m p lo y ee 2 0 0 7 -0 8
C h in a big- C h in a Hong T aiw an UK S in g a p o re
4 O th e r Kong
S a m p le o f l a r g e c o m m e r c ia l b a n k s
Chapter 1 Introduction and Motivation 4
A model o f bureaucratic rent seeking would supplement the conventional utility function o f the manager consistent with the shareholder from just profits to include staffing as an additional argument Let n be profits, w be the given wage rate, p be the product price, and L represent staffing levels. The conventional optimisation for the firm is described by maximising the manager’s utility function given by the implicit function; Max U = U (x) (1.1)
it
=p y -w L
Subject to y = / ( £ ) (1.2) / ' > 0 ; / ' < 0 f ^ . = p / '- w = 0 dL L' = L (w ,p ;y) (1.3)^ - = p f’ <
0
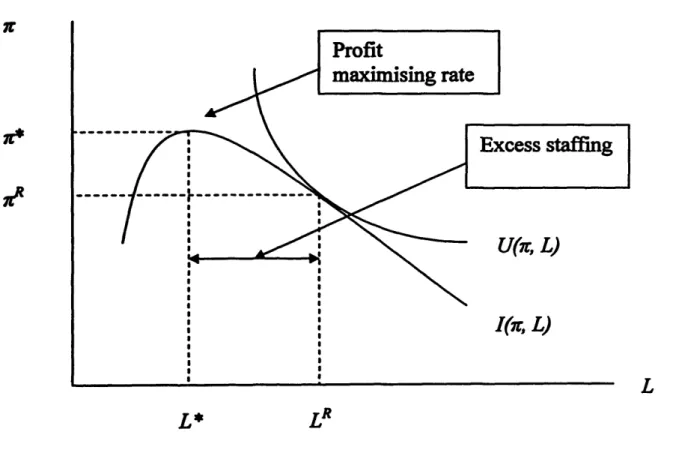
dL2Equation (1.3) describes the profit-labour input function which shows that there is a single maximum. The optimising conditions reveal the profit maximising input of staffing for a given level o f output as described in figure 1.2. However, the bureaucratic manager may also have the objective o f building up his managerial empire or be following political strictures to employ more staff. The utility function of the bureaucratic rent-seeking manager is given by;
Optimising 1.4 with respect to the constraints leads to excess staffing as shown by the tangency o f the bureaucratic rent-seeking manager’s utility function to the locus of profit and labour input in figure 1.2. The profit function describes the relationship between profit and the factor input. The maximum profit for a given level of output is shown at n and following Williamson (1963) the rent-seeking equilibrium is described by LR. The excess staffing is given by LR - L*.
Figure 1.2 Excess staffing as a rational outcome
I(n, L)
Excess staffing
Profit
maximising rate
L*
L*
While it can be argued that bureaucratic rent-seeking behaviour and political imperatives led to excess staffing in the past, the dominance of the profit maximising framework in Chinese hanks in recent years has led to the decline o f rent-seeking inefficiency. The chapter on bank efficiency not only attempts to evaluate the relative differences between X-inefficiency and rent-seeking inefficiency between the SOCBs and the JSCBs, it also attempts to model the speed o f decline o f each over time.
Chapter 1 Introduction and Motivation 6
While rent-seeking on the part o f corrupt party officials and financing of publicly traded companies has been examined by Fan, Rui and Zhao (2006) and rent-seeking gains to individual membership o f the Communist Party by Bishop and Liu (2006), to my knowledge the concept o f rent-seeking as applied to over-staffing in regulated industries has not hitherto been examined previously.
13 Bank Productivity
The next piece o f empirical work relates to the measurement and determination of productivity in Chinese banks. In this chapter (Chapter 6) I borrow concepts from the growth accounting literature in the form of total factor productivity (TFP) and growth convergence literature (beta-convergence). The contribution o f this chapter is threefold. First it measures TFP of the Chinese banks for the SOCBs, the joint stock commercial banks (JSCBs) and the city commercial banks (CCBs) over the period 1998-2007 with a view to examining which o f the types o f banks have grown the fastest Second, it uses the concept o f conditional p-convergence to evaluate the dynamics o f TFP controlling for bank specific factors. Third, it uses the Simar and Wilson bootstrapping technology to estimate TFP using a non-parametric framework and thereby providing the point estimates with a statistical inferential capability. The non-parametric method is an extension of the DEA approach to accommodate the change in efficiency between two periods which produces an index of growth for multiple outputs and inputs known as the Malmquist index2.
The concept o f total factor productivity growth and growth accounting developed from the work o f Solow (1957). Solow discovered the one-third rule which states that a 1 per cent increase in capital per hour of labour brings a one-third increase in real GDP per hour o f labour. This one-third I used to decompose the growth of real GDP per hour o f labour into the increase in the capital per hour o f labour and technological change to the growth o f real GDP3. If the production function is of the form;
Y = A F (K ,L)
Fk>Fl > 0 (1.5)
Fkk^Fu < 0
Where Y is real GDP, K is capital and L is labour time in hours and Fl, Fk and F ll, Fkk define the conditions for marginal product o f labour and capital respectively and
dim inishing marginal productivity o f labour and capital. Defining, output per hour of
Y x
labour time is v = — and capital per hour of labour is k = — , then;
L L
y = af(k) (1.6)
Assuming a Cobb-Douglas technology;
y = a + ak (1.7)
The dots over the variables indicates proportional rate o f growth. Alternatively, growth in GDP is given by;
Chapter 1 Introduction and Motivation
8
y = i + a £ + ( l- a ) Z
(1.8)
Equation 1.8 is the fundamental growth accounting statement which decomposes GDP growth into the growth in capital and the growth in labour and the residual A
is the growth in total factor productivity.
In the context o f multiple outputs and inputs the Malmquist index decomposes the growth in a firm or micro unit between two periods into the technological change and efficiency gain. Technological change represents growth in technical progress illustrated by a shift in the frontier o f the production function and efficiency gain represents a movement towards the frontier on the part o f an inefficient firm or micro unit Figure 1.3 illustrates in the case of a one output and one input, w here y is the output and x is the input; y - f { x) .
Figure 1.3 Technical progress and efficiency gain
y
f(x)
The growth o f an inefficient firm represented by the coordinates at A towards any point in the space defined by the arrows represents an increase in output growth that can be decomposed into technical progress given by a shift in the production function and a movement towards the frontier.
The research o f Chapter 6 is to identify those banks that define the frontier in terms of being the benchmark and those banks that emulate best practice and make efficiency gains by shifting closer to the frontier. The findings o f this chapter suggest that the SOCBs and some JSCBs have defined the frontier but it is the CCBs that have made the greatest strides in efficiency gains.
1.4 Bank Intermediate Outputs and Intermediate Inputs
The DEA technology relates to a single level situation where the efficiency o f a unit is evaluated against comparable units at a given point in time. In their review of thirty years o f DEA, Cook and Seiford (2009) describe a multistage model in which production passes through different levels. These can be thought o f as one of three general models.
(1) A static framework where a finite set o f sub technologies is connected to form a network which enables the analysis o f the allocation o f intermediate products.
(2) A dynamic network, where there is a sequence o f production technologies separated in time. In this framework the outputs o f one stage become the inputs of another stage.
(3) A technological adoption framework which allows for the production on different processors (machines). In this case inputs are allocated among the processors to allow for the adoption o f a specific technology.
Chapter 1 Introduction and Motivation
10
Chapter 7 examines a static parallel network that separates the bank into three profit centres, namely Consumer banking, Corporate banking and Treasury operations. Overall efficiency is given by the ratio o f outputs to inputs (or the dual) but the network framework provides insight to the manager as to the internal efficiency of the profit centres relative to benchmark banks internal processes. The application of network DEA to banking is rare and application o f this study is the first in applying the parallel network to Chinese banks4.
I S
Structure of the Thesis
The remaining chapters o f the thesis outline the context, methodology and data used in the study. Chapter 2 details the development o f the modem Chinese banking system concentrating on the reform period o f the 1990s. Chapter 3 outlines the principle methodology used in each o f the empirical chapters. This chapter sets out the technology o f the DEA, Malmquist and Network frameworks and also reviews the literature and its application to Chinese banks. While this chapter outlines the methodology and the literature, there is some repetition in each o f the empirical chapters as these were written with the principal aim o f publication as scholarly
papas. Chapter 4 describes the data and the assumptions used in deriving particular data used in the analysis. Chapter 5, 6 and 7 are three empirical studies. Chapter 5 decomposed cost inefficiency into technical and allocative inefficiency. Chapter 6 used the bootstrap technology to measure TFP growth o f the banks and its components, technical innovation and efficiency catch-up. Chapter 7 applied a novel
4 Matthews (2010) applies a serial network DEA to one year of Chinese banks data to evaluate the relative efficiency o f risk management procedures as an intermediate process.
technology of network DEA to open up the “black box” from the conventional DEA estimates. Chapter 8 summarises and concludes.
1.6 Epilogue
After 10 years o f experience in the Chinese banking industry, I felt I had a good worms-eye view of the workings of the system. My interest in developing a birds-eye view was stimulated by my study of the efficiency of Chinese banks as part of my dissertation when taking the MSc in International Economics, Banking and Finance at Cardiff University. At that time I was aware that there were many studies of Chinese banking that showed similar results. Measuring Chinese bank inefficiency had become a growth industry among Chinese Masters students and Chinese scholars. Over 180 papers have been published in China relating to bank efficiency. However, the measurement o f bank inefficiency while being an important contribution does not explain the conception and evolution of this inefficiency. The existence of large scale inefficiency could only be explained by a political economy process. While the empirical chapters may not be the only explanation, they represent a beginning.
Chapter 2 The State of Chinese Banking 12
Chapter 2
The State o f Chinese Banking
“Get the facts first, and then you can distort them as much as you want.” Mark Twain
2.1 Introduction
The ancient Chinese sage Lao Tzu is supposed to have said, 'the journey of a thousand leagues begins with the first step'. A well-known Irish saying is 'If you want to get to Tipperary, I wouldn't start from here'. Both statements are appropriate to understanding the state of Chinese banking. Chinese banks have come a long way since the reforms of the last two decades of the 20th century, but it is also clear that in terms o f global performance that they have much further to go. Similarly, the evolutionary journey of Chinese banks is made much more difficult because of the legacy o f its history. Western banks have typically evolved from a 'free banking' tradition to a regulated one. In contrast, Chinese banks have come from the opposite direction, from a state-planned system to a regulated market-based system.
This chapter describes the state of the Chinese banking system. It traces its evolution from ancient tradition, through the socialist planning stage on to the current stage that resembles a modem banking system. The route taken will concentrate on the development o f the modem Chinese banking system from the beginning of the reform period in 1979. The first part describes the evolution of the Chinese banks from ancient times to the revolutionary period. The next section describes the development of the banking system from the mono-banking system of the central planned economy to the current banking system. The third part outlines the main indicators of the
Chinese economy and the role of the banking system in its development. The fourth part examines the structure and performance of Chinese banks. The final part looks at very recent developments and the prognosis for the future of Chinese banks.
2.2 Chinese Banking from Ancient Times
Banking in China has an ancient and venerable tradition dating two thousand years. The use o f paper money was pioneered in China and the earliest known credit institution appeared in the 5th century of the Tang dynasty (618-907) (Yang, 1952). The equivalent o f promissory notes issued by the government, feiqian (flying money) redeemable at provincial treasuries existed and paper money, jiaozi (exchange medium), was in use in Sichuan province in the early part of the 11th century. A sophisticated system of banking that took in deposits, made loans, issued notes, and made long distance remittances of money developed during the Song dynasty (960-1279) (Tamagna, 1942). However, it was in the period of the Qing dynasty (1644-1911), with increased commercialisation of the economy did three distinct types of banks develop namely piaohao, qianzhuang and foreign banks (Cheng,
2003).
The piaohao (ticket store) was a cash remittance system that grew out internal transfers of credits by companies that had branches separated by geographical location. The difficulty in the secure transference of cash across geographical areas led to the development of an internal transfer of credit, which amounted to a cashable draft issued by one branch of a company on another branch. According to Cheng (2003), the Xiyuecheng Dye Company located in the Pingyao district of Shanxi province was the first to develop such a system. The large number of internal
Chapter 2 The State of Chinese Banking 14 transactions led to a balancing netting system. The efficiency of the system led to many other merchants and traders either developing their own systems or began to use the piaohao as a means of remitting funds across the country. Eventually the piaohao
began to remit government tax revenues, advanced payments to local authorities and raise foreign loans for provincial governments. By the late 19th century the piaohao
had become a government financial agency in everything but name. By the end of the 19th century there were 32 piaohaos in business with 475 branches spanning all of China's eighteen provinces plus Manchuria, Mongolia, Xinjiang and frontier areas.
Independently o f the piaohao system a large number of small domestic banks,
qianzhung, developed during the 18th century. These were highly localised banks that conducted money exchange, issuance of cash notes, discounting and trading bills of exchange. These domestic banks were strongly suited to the small scale business of the local enterprises. Typically the loans were small scale and required no collateral and business hours were flexible providing what was often a *24 hour service’.
The two types o f banking were specially separated and did not directly face a geographical competition. The two institutions frequently cooperated with piaohao
depositing idle cash in qianzhung. In the early 1890s there were around 10 thousand
qianzhung in China.
The third type of banking institution was the foreign merchant banks that followed their customers to the international trading areas of China. The first of these was an Indo-British bank called Oriental Bank, which set up a branch in Hong Kong in 1842 and an agency branch in Canton in 1854. A number of other Indo-British banks
followed in rapid succession and in 1865 the Hong Kong and Shanghai Banking Corporation was established in Hong Kong. The late 19th century saw banks from Germany, France, Japan and Russia establish in China. Because of the extra territorial rights granted to the foreign concessions, these banks were free of Chinese government regulations, which meant that not only had the banks as a group able to secure international currency business but they could also operate in China with no regulatory incumbency. The international borrowing of the Chinese government to meet reparations following the Sino-Japanese war of 1894 further enhanced the position of the foreign banks.
The division o f the banking market between the three types of institution followed a keen segmentation. The foreign banks dominated international trade financing; the
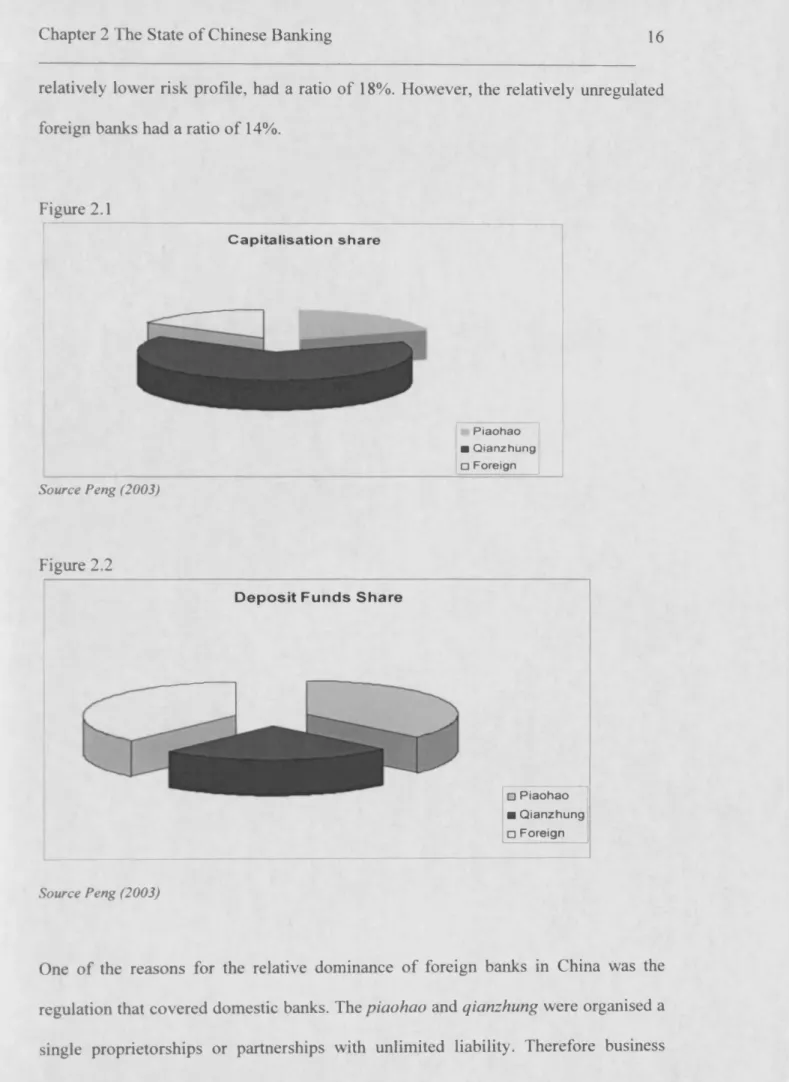
piaohao dominated the domestic remittance business and the qianzhung controlled domestic credit. The relative shares capital of the three banking types for 1894 is shown in Figure 2.1 below.
Out o f a total capital of 220 million yuan, the piaohao had 19%, the qianzhung had 65% and the foreign banks had 16%. However, the share of deposit liabilities, which represented a total of 863 million yuan, was 32%, 35% and 32% respectively (Figure 2.2). The ratio o f capital liabilities to deposit liabilities is an indicator of the constraints the qianzhung were working under. The ratio of capital to deposits for the
qianzhung was 89% reflecting both high cost and high risk associated with small-scale banking. Whereas the piaohao, which had a nationwide network could exploit economies of scale and given the large amount of government business, a
Chapter 2 The State of Chinese Banking 16
relatively lower risk profile, had a ratio of 18%. However, the relatively unregulated foreign banks had a ratio o f 14%.
Figure 2.1 Capitalisation share Piaohao ■ Qianzhung □ Foreign Source Peng (2003) Figure 2.2 D e p o s it F u n d s S h are Source Peng (2003) □ Piaohao ■ Q ianzhung □ Foreign
One of the reasons for the relative dominance of foreign banks in China was the regulation that covered domestic banks. The piaohao and qianzhung were organised a single proprietorships or partnerships with unlimited liability. Therefore business
expansion was constrained by capital availability, whereas foreign banks did not face this regulation (typically joint-stock) but were able to compete nationwide on international trade business5.
The first modem Chinese bank, the Imperial Bank of China (IBC) was set up in 1897, organised on a joint-stock basis. The IBC followed the customs and organising principles of the HSBC and hired foreign professionals into senior management. Its business was the financing of domestic industry and international trade. An additional privilege was the right to print its own currency bank notes in competition with the foreign banks. Ironically this turned out to be one of the reasons for its relative decline in reputation following the looting of its branches in Beijing and Tianjin during the Boxer rebellion and massive counterfeiting that led to a run on the bank in 1903. The loss o f reputation o f the IBC highlighted its relative financial weakness. Recognising the value o f a stable domestic banking system, the Qing government set in motion a series of reforms to encourage the development of domestic banking. In 1903 the Daqing Bank was set up as a limited liability company with many of the functions of a central bank. It governed the financial business of the state treasury and unified the currency circulation with the monopoly issue of Qing currency banknotes.
The establishment o f the Daqing Bank was a green light for the creation of a number of other banks both from government and private backing. In 1906 the Xincheng Bank was established in Shanghai; in 1907 the National Commercial Bank (Zhejiang Xingye Yinhang) was established in Hangzhou by the Zhejiang Railroad Company
5 The financing of domestic industry by the foreign banks was limited due to unfamiliarity with Chinese business customs, accounting procedures and laws relating to loan security. See Peng (2003) p.22.
Chapter 2 The State of Chinese Banking 18 and in 1908 the Ningbo Commercial and Savings Bank (Siming Yinhang) was set up. In 1908 the Bank of Communications was set up by the Ministry of Posts and Communications. By 1911 a total of seventeen domestic banks had been set up in China. Even during the turbulent years of the interwar period, Chinese banking business grew with a total of 266 new banks setting up in the years from 1912 to
1927.
2 3 From Socialist Planning to M arket Based Banking
The mono-banking system of China began with the creation of the Peoples Republic of China in 19496. All banks were nationalized culminating in the creation of the Peoples Bank of China (PBOC). Between 1949 and 1978 the PBOC operated as a commercial bank and as a central bank. The PBOC behaved less as a financial intermediary and more as an instrument of the centrally planned system. Some specialist banks existed but these were either agents for budgetary grants from the government or business branches of the PBOC. For example the Peoples Construction Bank of China, established in 1954, was the cashier of the capital construction finance department of the government ministry of finance and the Bank of China (BOC) was the international business arm of the PBOC.
Bank lending was administered according to a strict quota system. No adjustment or exchange between the various quotas was allowed. Lending was channeled to the state owned enterprises (SOE). The purpose of the mono banking system was to implement the financial targets of the central economic plan. Bank credits were
6 An extensive review of the Chinese banking system can be found in Shirai (2002), and Allen, Qian and Qian (2005a) (2005b)
created as accounting units independently of deposits or other sources of funds, purely to fund net public spending. The fiscal-credit funds planning framework7 is set out in equations (2.1) - (2.3) below.
R + AL = G (2.1)
AL = AD + AC + AB (2.2)
A C = I - W (2.3)
Equation (2.1) says that planned state expenditure (G) is equal to state budgetary revenues (R) and the increase in bank credit (AL). Equation (2.2) sates that the
increase in bank credit is financed from the increase deposits (AD), the increase currency in circulation (AC) and the increase in bank's own capital and other liabilities to domestic and international financial institutions (AB). Equation (2.3) states that the
increase in currency is given by the difference between planned currency injections (7) and planned currency withdrawals (W). Nowhere in this system was bank credit constrained by reserve requirements or deposit financing. In reality bank credit played a junior role in financing state expenditures and it was only since the start of the reform period that it began to take on sizeable proportions. Between 1953 and 1978 the average annual contribution to state funding from bank credit was only 5.6%. In 1979 this jumped to 15.8%, in 1980 it was 22.4% and in 1991 it was 36%. Even after the start of the reform of the banking system in aggregate the state expenditure plans were increasingly supported by bank credit.
Chapter 2 The State of Chinese Banking 20 In 1979 the monopolistic position of the Peoples Bank of China (PBOC) was removed with the establishment of three specialized banks in the early 1980s that took over its banking business. The Agricultural Bank of China (ABOC) took over the business of providing credits to the rural sector, The Bank of China (BOC) took over foreign currency transactions, and the China Construction Bank (CCB) took over financing the construction sector. The fourth specialized bank, the Industrial and Commercial Bank of China (ICBC) was set up in 1984 that eventually took over the commercial business of the PBOC in 1994.
The 1980s saw the setting up of other commercial banks, joint-stock banks, and state-owned investment banks. The Commercial Bank Law of 1995 ushered in a two-tier banking system. At the apex sits the PBOC and below it the commercial banks that are subject to prudential regulations and supervision by the PBOC. Policy banks were officially separated from commercial banks, although in reality because of a lack of a branch network, the commercial banks continued with policy lending (Chen et. al 2005). In reality commercial banks followed the direction of the PBOC in its quota lending (Perkins, 1994) and lending rates were kept below shadow prices (Perkins, 1988 1994). However, an element of profit retention was introduced into the banking system in 1981 with the sole purpose of developing business and rewarding employees in the form of bonuses. The Ministry of Finance ruled on what could constitute operating costs and an after tax profit retention rate was stated for the specialized banks8. Prior to the reform period the banks faced a highly centralized method of management with little discretion on personnel and business expansion.
* The practice of dictating the scope of operating costs and continuing to use commercial banks to prop up loss-making state and local industries gave bank managers ample room for 'rent-seeking' behaviour.
Some discretion was allowed in the reform period relating to business expansion and hiring but this discretion was tempered by the continued interference by state and local governments, which led to the continued support of local and state industries by bank credit. Preferential rates of interest for selected industries existed and in 1984 there were 47 kinds of preferential rates of interest to particular industries with the aim of encouraging capital accumulation. In an attempt to control the rapid growth of credit, the PBOC introduced credit ceilings and selective quotas for credit.
From 1996 onwards, foreign banks were allowed to open branches across China but their business was largely confined to the non-RMB market. As of the end of 2008, only 58 foreign bank branches (out of 116) and 27 locally incorporated foreign banks were licensed to engage in RMB business, of which only 7 foreign banks were approved to offer RMB retail business. Table 2.1 below shows the status of foreign banks in China.
Table 2.1 Status of Foreign Banks in China (as of end-2008)
Number of Banks Foreign banks Wholly foreign-funded banks Joint-venture banks Wholly foreign-funded finance company Total Head offices of locally
incorporated banks 28 2 2 32
Branches and
subsidiaries of locally
incorporated banks 157 6 163
Foreign bank branches 116 116
Total 116 185 8 2 311
Source: CBRC annual report (2008)
Limited interest rate deregulation followed. In 2008, the Chinese banking system consisted of 5,634 legal entities, including 3 policy banks, 5 state-owned large
Chapter 2 The State of Chinese Banking 22 commercial banks (big-5), 12 joint-stock commercial banks, 136 city commercial banks, 32 foreign banks and the rest was made of urban and rural credit cooperatives and other financial institutions.
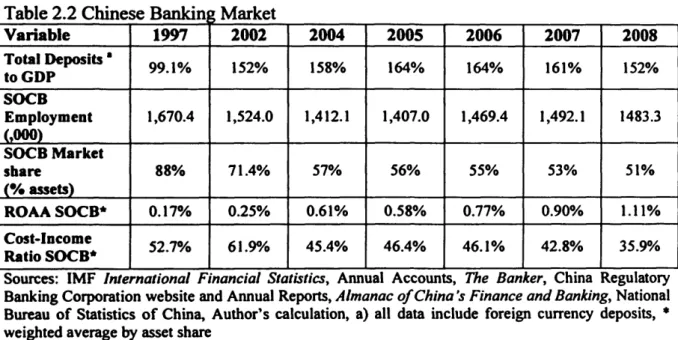
Like many economies that have undeveloped financial and capital markets, the banking sector in China plays a pivotal role in financial intermediation. Table 2.2 below shows that the ratio of total bank deposits to GDP has increased from 99.1% in 1997 to 152% in 2008. The market is absolutely dominated by the five9 state owned banks, although their share of the market has been decreasing steadily through gains made by the joint-stock banks.
Table 2.2 Chinese Banking Market
Variable 1997 2002 2004 2005 2006 2007 2008 Total Deposits * to GDP 99.1% 152% 158% 164% 164% 161% 152% SOCB Employment (,000) 1,670.4 1,524.0 1,412.1 1,407.0 1,469.4 1,492.1 1483.3 SOCB Market share (% assets) 88% 71.4% 57% 56% 55% 53% 51% ROAASOCB* 0.17% 0.25% 0.61% 0.58% 0.77% 0.90% 1.11% Cost-Income Ratio SOCB* 52.7% 61.9% 45.4% 46.4% 46.1% 42.8% 35.9% Sources: IMF International Financial Statistics, Annual Accounts, The Banker, China Regulatory Banking Corporation website and Annual Reports, Almanac o f China’s Finance and Banking, National Bureau of Statistics of China, Author’s calculation, a) all data include foreign currency deposits, * weighted average by asset share
Faced with the potential of increased competition from 2007 onwards, the big banks have begun the process of restructuring and reducing unit costs. Employment in the state-owned banks has declined from a peak number of 1,524 thousand in 2002, return
9 Up until 2004, the CBRC classified the big-4 as the state owned banks which included Bank of China, Industrial and Commercial Bank of China, China Construction Bank and Agricultural Bank of China. From 2005-2006 the classification of state-owned bank was extended to include the Bank of Communications.
on average assets have shown some improvement (partly as a result of the removal of a proportion of non-performing loans (NPLs) from the balance sheet and its transference to asset management companies and partly through a greater flexibility in setting loan rate margins). Significantly, the major banks have worked to reduce costs as shown in the sharp reduction in the weighted average cost-income ratio.
Up until 1995, control of the banking system remained firmly under the government and its agencies10. Under state control, the banks in China served the socialist plan of directing credits to specific projects dictated by political preference rather than commercial imperative. Since 2001 foreign banks and financial institutions were allowed to take a stake in selected Chinese banks. While control of individual Chinese banks remain out of reach for the foreign institution11, the pressure to reform management, consolidate balance sheets, improve risk management and reduce unit costs has increased with greater foreign exposure. As of end-2008,4 large commercial banks, namely the ICBC, BOC, CCB and BoCom, introduced 9 foreign institutional investors; 24 small and medium-sized commercial banks formed partnership with 33 foreign institutional investors; and 3 rural cooperative financial institutions introduced 3 foreign institutional investors, altogether taking in foreign equity investment of USD32.78 billion. Table 2.3 shows the entry of overseas investors in 2003 - 2008, while table 2.4 lists the detailed extent of foreign ownership of individual banks.
Over the period of 2003 to 2008 the number of domestic banks that have had an injection of foreign capital has increased from 5 to 31. However, this figure has
10 According to La Porta, et. al (2002), 99% of the 10 largest commercial banks were owned and under the control of the government in 1995.
11 There is a cap of 25% on total equity held by foreigners and a maximum of 20% for any single investor, except in the case of joint-venture banks.
Chapter 2 The State of Chinese Banking 24 increased with IPOs and foreign investment increasing through 2008 to the present day.
Table 2.3 Entry of Overseas Investors (2003 - 2008)
Unit: Number of )anks, US!DIOOmillion Items / Year 2003 Cumulative amount 2004 Current amount 2005 Current amount 2006 Current amount 2007 Current amount 2008 Current amount 2008 Cumulative amount Number of banks with
foreign capital 5 6 7 6 5 6 31
Total amount of
investment 2.6 23.5 116.9 52.2 17.6 115.2 327.8
Total amount of capital raised in the listed
overseas markets - - 113.9 299.0 42.2 0 455.1
Total amount 2.6 23.5 230.8 351.2 59.8 115.2 782.9 Source: CBRC annual report 2008
Table 2.4 Foreign Bank Ownership Stake
Chinese Bank Foreign Bank (Stake %) Announcement
Date
Bank o f Shanghai HSBC (8%),
International Finance Corporation (7%)
December 2001 Shanghai Pudong Development
Bank Citigroup (3.78%)
December 2003
Ping An Bank HSBC (16.78%) December
2003
Industrial Bank Hang Seng Bank (12.78%) April 2004
Bank o f Communications HSBC (18.60%) June 2004
Jinan City Commercial Bank Commonwealth Bank o f Australia (11%) September 2004 Xi’an City Commercial Bank
Bank o f Nova Scotia (12.5%), International Finance Corporation (12.5%)
October 2004 Shenzhen Development Bank Newbridge Capital (16.76%) December
2004 Bank o f Beijing
ING (16.07%),
International Finance Corporation (4.04%)
March 2005 Hangzhou City Commercial
Bank
Commonwealth Bank o f Australia (19.90%),
Asia Development Bank (4.90%)
April 2005
China Construction Bank
Bank o f America (8.19%), Temasek (5.65%),
Reca Investment Limited (0.34%)
June 2005 Nanchong City Commercial
Bank
DEG (10%),
ICBC
Goldman Sachs (4.9%),
Dresdner Bank Luxembourg S.A.12 (1.9%),
American Express (0.4%)
August 2005
Bank o f China
Royal Bank of Scotland (8.25%), Temasek Holdings (4.13%), UBS (1.33%),
Asia Development Bank (0.20%),
The Bank of Tokyo-Mitsubishi UFJ Ltd. (0.19%)
August 2005
Tianjin Bohai Bank Standard Figureered (19.99%) September
2005
Bank o f Nanjing BNP Paribas (12.61%) September
2005
Hua Xia Bank Deutsche Bank (9.90%),
Sal Oppenheim Jr. (4.08%) October 2005 Tianjin City Commercial Bank Australia & New Zealand Banking Group
Ltd (19.9%)
November 2005 Bank o f Ningbo Overseas-Chinese Banking Corp Ltd
(10%) January 2006
United Rural Bank o f Hangzhou
Rabobank (10%),
International Finance Corporation (5%) July 2006 Shanghai Rural Commercial
Bank
Australia & New Zealand Banking Group
Ltd (19.9%) July 2006
China CITIC Bank BBVA (4.83%),
Mizuho Corporate Bank (0.17%)
November 2006 Guangdong Development Bank Citigroup (20%),
IBM (4.74%)
November 2006 Chongqing City Commercial
Bank
Dah Sing Bank (17%), Carlyle Group (7.99%)
December 2006 Dalian City Commercial Bank Bank of Nova Scotia (20%),
International Finance Corporation (5%) January 2007 Qingdao City Commercial Bank Intesa SanPaolo SpA (19.99%),
Rothschild Merchant Banking (5%) July 2007 Chengdu City Commercial
Bank Hong Leong Bank Bhd (19.99%) October 2007
Bank o f Yingkou Co Ltd Bumiputra-Commerce Hldg Bhd
(19.99%) March 2008
Xiamen City Commercial Bank Fubon Bank (Hong Kong) Ltd (19.99%) April 2008
Bank o f Jilin Hana Bank (19.7%) July 2008
Changshang Commercial Bank BRED Banque Populaire (20%) August 2008 Source: Thomson One Banker, Company Website, Factiva
2.4 Banking and the Economy
This section deals with role of banking in the economy. Like many developing economies where the capital markets are as yet undeveloped, the principal vessel for
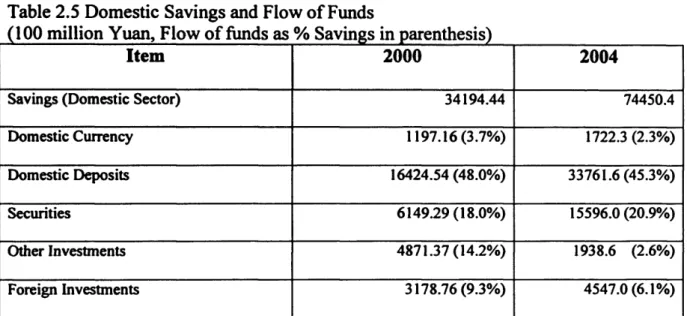
Chapter 2 The State of Chinese Banking 26 financial intermediation is the banking system. Table 2.5 below shows the total savings of the domestic sector and the flow of funds counterparts. In 2004, nearly half of domestic savings is household savings and almost all of this is held in the form of bank deposits. Private securities accounted for 20.9% of domestic savings and nearly 9% accounted for foreign investments including foreign currency deposits.
Table 2.5 Domestic Savings and Flow of Funds
(100 million Yuan, Flow of funds as % Savings in parenthesis)
Item 2000 2004
Savings (Domestic Sector) 34194.44 74450.4
Domestic Currency 1197.16(3.7%) 1722.3 (2.3%)
Domestic Deposits 16424.54 (48.0%) 33761.6(45.3%)
Securities 6149.29(18.0%) 15596.0 (20.9%)
Other Investments 4871.37(14.2%) 1938.6 (2.6%)
Foreign Investments 3178.76 (9.3%) 4547.0 (6.1%)
Source: China Statistical Yearbook 2003, 2007 by National Bureau o f Statistics China
Table 2.5 gives a snapshot of addition to financial assets from domestic savings. A more revealing picture is provided by Figure 2.3, which shows the ratio of aggregate banking assets to GDP from 1971 to 2008. The Figure shows that bank assets (credit) have been growing faster than GDP throughout this period but there was a shift in the trend rate of growth in the latter half of the 1980s. Despite the attempts by the PBOC to place constraints on lending, bank credit has grown rapidly and accelerated in 2002-3. The rapid increase in bank credit relative to GDP indicates the important role of the banking sector in the economic development of China.
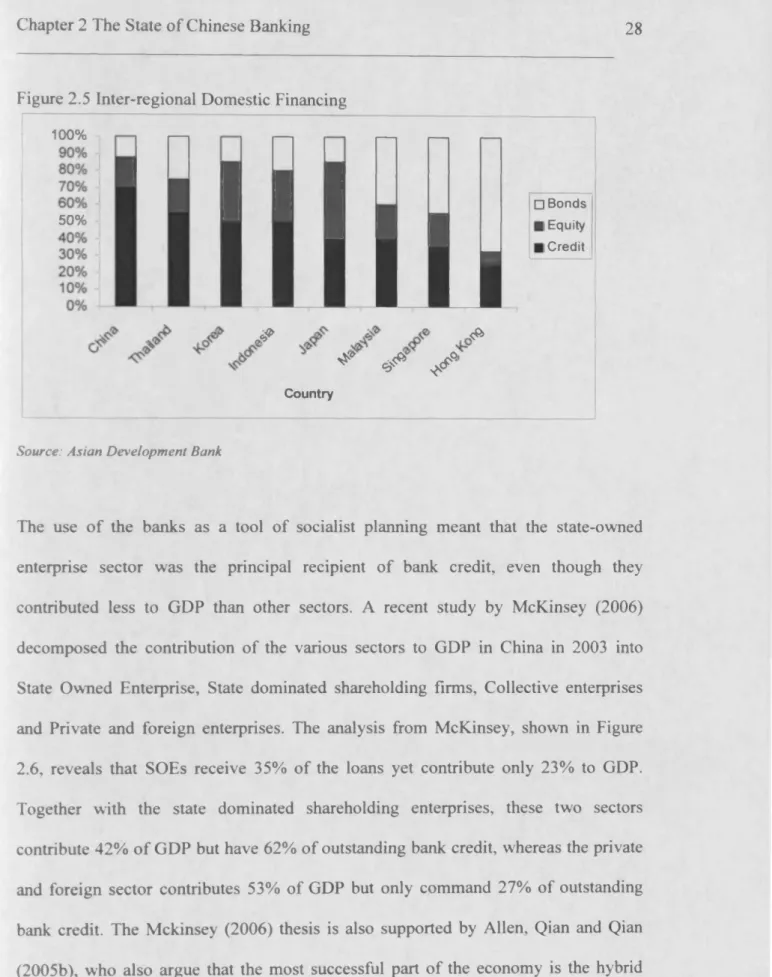
The growth o f bank credit is reflected in the continued dominance of the banks as the main source of financing by the private and public sectors. Figure 2.4 shows the percentage break down o f the sources of financing. 70% of external financing by the borrowing sectors was from the banks in 2004. While equity has increased in recent years as an alternative source of financing, the dominant source remains bank loans. In this respect China is unique in the economic region. Figure 2.5 shows the relative position o f China compared with other economies in the region for 2004.
Figure 2.3 Ratio o f Banking Assts to GDP (1971 - 2008)
Ratio ■ 2 1.8 1.6 1.4 1.2 1 - 0.8 0.6 0.4 1970 1980 1990 2000 2010 Years
Source: China Abstract o f Statistics (Various), IMF and CBRC
Figure 2.4 Source of Financing in China
100% □Bonds ■Equity ■Credit 1995 1 996 1997 1998 1 999 2000 2001 2002 2003 2004 Years
Chapter 2 The State of Chinese Banking 28
Figure 2.5 Inter-regional Domestic Financing
100% 50%
mill
J ’* & *y y
Country □ Bonds I Equity I CreditSource: Asian Development Bank
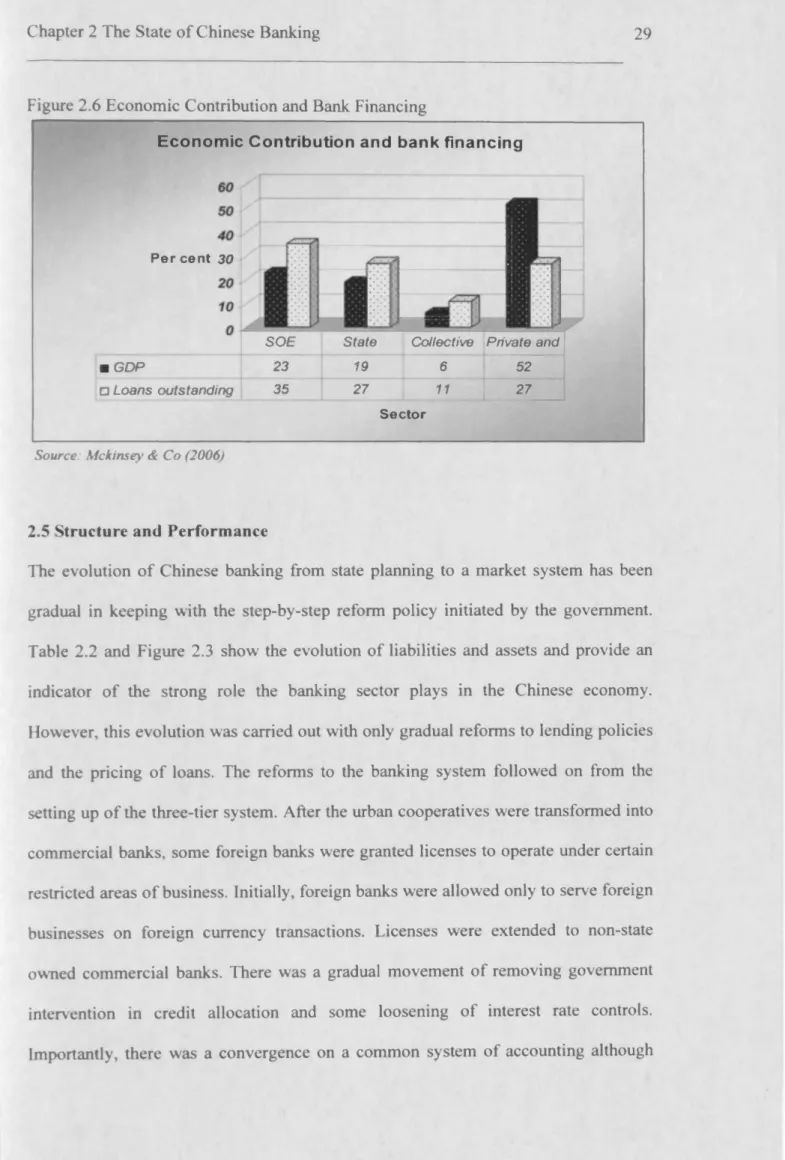
The use o f the banks as a tool o f socialist planning meant that the state-owned enterprise sector was the principal recipient of bank credit, even though they contributed less to GDP than other sectors. A recent study by McKinsey (2006) decomposed the contribution of the various sectors to GDP in China in 2003 into State Owned Enterprise, State dominated shareholding firms, Collective enterprises and Private and foreign enterprises. The analysis from McKinsey, shown in Figure 2.6, reveals that SOEs receive 35% o f the loans yet contribute only 23% to GDP. Together with the state dominated shareholding enterprises, these two sectors contribute 42% of GDP but have 62% o f outstanding bank credit, whereas the private and foreign sector contributes 53% of GDP but only command 27% of outstanding bank credit. The Mckinsey (2006) thesis is also supported by Allen, Qian and Qian (2005b), who also argue that the most successful part of the economy is the hybrid non-state sector, which is sparsely funded by the banking sector.
Figure 2.6 Economic Contribution and Bank Financing
Economic Contribution and bank financing
■ GDP
□ Loans outstanding
Per cent 30
SOE State Collective Private and
23 19 6 52
35 27 11 27
Sector
Source: Mckinsey & Co (2006)
2.5 Structure and Performance
The evolution o f Chinese banking from state planning to a market system has been gradual in keeping with the step-by-step reform policy initiated by the government. Table 2.2 and Figure 2.3 show the evolution of liabilities and assets and provide an indicator o f the strong role the banking sector plays in the Chinese economy. However, this evolution was carried out with only gradual reforms to lending policies and the pricing of loans. The reforms to the banking system followed on from the setting up o f the three-tier system. After the urban cooperatives were transformed into commercial banks, some foreign banks were granted licenses to operate under certain restricted areas o f business. Initially, foreign banks were allowed only to serve foreign businesses on foreign currency transactions. Licenses were extended to non-state owned commercial banks. There was a gradual movement of removing government intervention in credit allocation and some loosening of interest rate controls. Importantly, there was a convergence on a common system of accounting although
Chapter 2 The State of Chinese Banking 30
international standards of accounting are not as yet uniformly adopted. Appendix 2-1 gives an up to date chronological list of major financial reforms.
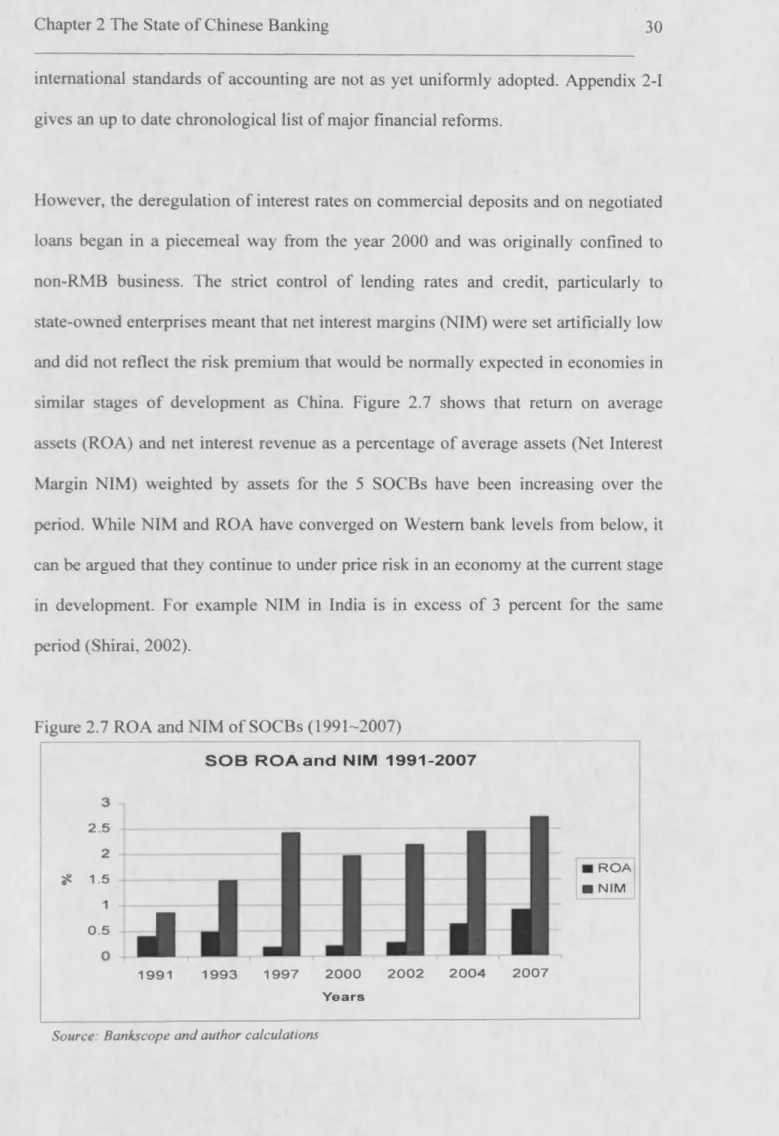
However, the deregulation of interest rates on commercial deposits and on negotiated loans began in a piecemeal way from the year 2000 and was originally confined to non-RMB business. The strict control of lending rates and credit, particularly to state-owned enterprises meant that net interest margins (NIM) were set artificially low and did not reflect the risk premium that would be normally expected in economies in similar stages o f development as China. Figure 2.7 shows that return on average assets (ROA) and net interest revenue as a percentage of average assets (Net Interest Margin NIM) weighted by assets for the 5 SOCBs have been increasing over the period. While NIM and ROA have converged on Western bank levels from below, it can be argued that they continue to under price risk in an economy at the current stage in development. For example NIM in India is in excess of 3 percent for the same period (Shirai, 2002).
Figure 2.7 ROA and NIM of SOCBs (1991-2007)
2.5 35 1.5 0.5
J
S O B R O A a n d NIM 1 9 9 1 - 2 0 0 7 R O A NIM 1991 1 9 9 3 1997 2 0 0 0 2 0 0 2 2 0 0 4 2 0 0 7 Y e a r sNet interest margins look respectable compared with developed economies like the UK but do not reflect the implicit risk premium that would be usually associated with economies in the stage of development China is in. It is arguable that the SOEs are unlikely to be allowed to fail because of the government implicit guarantee which under-rights their losses. This creates a strong problem of moral hazard where the SOE does not have to improve its performance and the SOCB doesn’t have to demand a risk premium because of the implicit government guarantee.
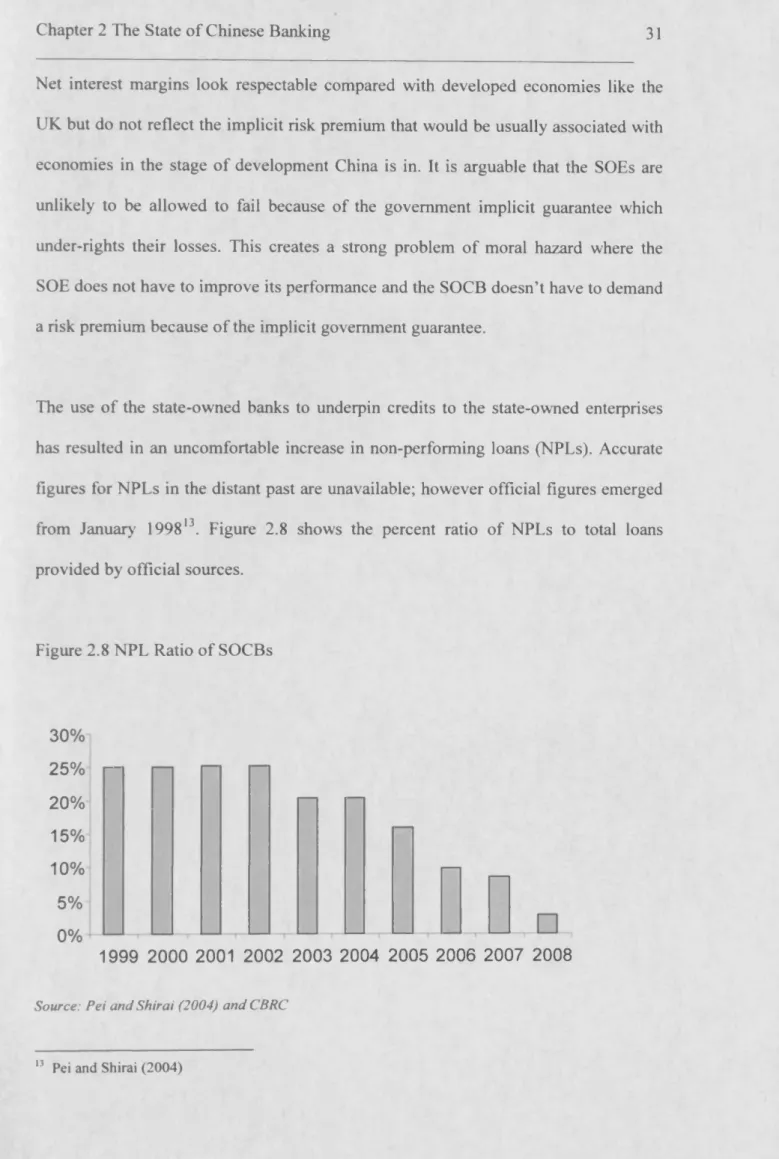
The use o f the state-owned banks to underpin credits to the state-owned enterprises has resulted in an uncomfortable increase in non-performing loans (NPLs). Accurate figures for NPLs in the distant past are unavailable; however official figures emerged from January 199813. Figure 2.8 shows the percent ratio o f NPLs to total loans provided by official sources.
Figure 2.8 NPL Ratio o f SOCBs
30% 25% r - 20% 15% 10% 5% 0% 1999 2000 2001 2002 2003 2004 2005 2006 2007 2008
Source: Pei and Shirai (2004) and CBRC
Chapter 2 The State of Chinese Banking 32
These estimates have been challenged by a number of studies. Shi Huaqiang (2003) estimated the NPL ratio of the SOCBs to 39% in 1999 and 29.2% in 2000. Moody’s Investor Service estimated the NPLs of SOCBs to be between 35% and 70% in 1996. Recognition of the NPLs problem and the potential it has to destabilize the financial system, the government established four Asset Management Companies in 1999 to aid the disposal of the NPLs from the big-4 SOCBs14. Prior to this a capital injection of RMB 270 million was made in 1998 to the big-4. In 1999 the AMCs transferred RMB
1.4 trillion ($169 billion) from the big-5 onto its books15. However, NPLs continued to grow and in 2003-4 a further $45 billion of foreign reserves was injected to the BOC and CCB and $15 billion to ICBC in 2005. A credit boom in 2002-3 saw the assets of the banking sector grew rapidly which has had the effect of reducing the NPL ratio to 7.5% by mid 2006, but in turn has raised doubts about the path of future NPLs16. It is also the case that the JSCBs have had a lower NPL ratio, indicating either a better starting position or superior management17.
Despite the movement in reforms and the encouragement of market based banking, the market structure is highly concentrated and dominated by the big 5 SOCBs. Table
14 Each AMC was exclusively assigned to an individual bank. Cinda was associated with China Construction Bank, Great Wall with the Agricultural Bank of China, Oriental with the Bank of China, and Huarong with the Industrial and Commercial Bank of China.
15 Most of the financing of the AMCs was through the issue of 10-year bonds but a sizeable portion is estimated to be cash financed by the PBOC (RMB 563 billion) , which has implications for monetary control. See Ma and Fung (2002).
16 The furore following the Ernst and Young report that estimated China’s NPLs to be $911 billion (40% of GDP) in 2006 is a good example.
17 Estimates of the NPL ratio of the JSCBs in 1997 obtained by annual accounts, web sources and bankscope suggest that this was 3% in 1997 and 51% for the SOCBs. In 2006 CBRC estimates put the NPL ratio for the JSCBs at 3.1% and SOCBs at 9.5%.
2.6 shows the 5-bank concentration ratio and Herfmdal-Hirschman index (HHI)18 measure for selected years. There has been a modest decline in concentration in the very recent years but the dominance of the big 5 is still evident. This dominance is however being challenged by the growth of the joint-stock banks and latterly by the stronger city commercial banks (CCBs - see also Chapter 6). By the end of 2008 the JSCBs had increased their collective share to 14% of the bank asset market. Figure 2.9 shows banking sector market shares in 2008.
Table 2.6 Measures of Market Structure
Year 5-bank Concentration HHI
1991 0.91 5420.8 1993 0.91 2268.7 1998 0.87 2027.2 2000 0.84 1904.2 2002 0.78 1720.0 2004 0.79 1596.0 2005 0.54 783.5 2006 0.53 649.7 2007 0.53 708.3 2008 0.51 660.3
Source: Demirgug-Kunt and Levine (2001) and author calculations
'*The U.S. Department of Justice considers a market with a result of less than 1,000 to be a competitive marketplace; a result of 1,000-1,800 to be a moderately concentrated marketplace; and a result of 1,800 or greater to be a highly concentrated marketplace. As a general rule, mergers that increase the HHI by more than 100 points in concentrated markets raise antitrust concerns.
Chapter 2 The State o f Chinese Banking 34
Figure 2.9
Banking Sector Market Share by Total Assets
(2 0 0 8) 17% 9% 149 79 51% □ Policy banks ■ SOB □ JSB
□ City commercial banks ■ Foreign banks
□ Other
Source: CBRC Annual Report 2008
2.6 Summary and Prognosis
This chapter has summarized the contextual framework in which the Chinese banks have operated. Banking in China has a venerable history but modem Chinese banking began in the late 19th century in answer to the competition from foreign banks. Banking flourished even in the turbulent years of the 1920s and 30s covering the Japanese war and the civil war. The use of the banking system as an arm of socialist economic planning reduced the banks to an arm of the government service and bank managers as civil servants. For 30 years since the establishment of the Peoples Republic o f China, the banking sector acted as the financial arm of the government.
The reforms o f the 1979-88 period focused on the changing the administrative structure and operations of the banking system. A two-tiered banking system replaced the mono-banking system of the strong planning period. However, the system still remained corralled by the central economic plan. In 1985 the banks were given greater scope in raising and allocating capital. Further reforms followed in the period
1988-94, which also saw the development joint-stock banks that operated nationwide. The Central Bank Law of 1995 gave the PBOC greater autonomy. A process of deregulation followed (see Appendix 2-1) with the aim of improving the efficiency of the Chinese banking system and raising its profit capacity. According to Berger et al (2005) the tentative opening up of the banking market to foreign competition has had positive impacts on performance. The full opening up of the domestic banking market to foreign competition scheduled for end-2006 according to the WTO rules can be expected to add further competitive pressure on the Chinese banks. The theory of market contestability (Baumol, 1982) suggests that incumbent banks will restructure weak balance sheets, reduce costs, and improve efficiency in preparation from the threat of entry. Chinese banks should exhibit less inefficiency in 2005 than in 1997. The purpose of this study is to evaluate this process.