Effective Load Balancing for Cluster-based Servers
Employing Job Preemption
∗
Victoria Ungureanu
†Benjamin Melamed
‡Michael Katehakis
§Abstract
A cluster-based server consists of a front-end dispatcher and multiple back-end servers. The dispatcher receives incoming jobs, and then decides how to assign them to back-end servers, which in turn serve the jobs according to some discipline. Cluster-based servers have been widely deployed, as they combine good performance with low costs.
Several assignment policies have been proposed for cluster-based servers, most of which aim to balance the load among back-end servers. There are two main strategies for load balancing: The first aims to balance theamount of workat back-end servers, while the second aims to balance the number of jobs assigned to back-end servers. Examples of policies using these strategies are Dynamic and LC (Least Connected), respectively.
In this paper we propose a policy, called LC*, which combines the two aforemen-tioned strategies. The paper shows experimentally that when preemption is admitted (i.e., when jobs execute concurrently on back-end servers),LC*substantially outper-forms both Dynamic and LC in terms of response time metrics. This improved per-formance is achieved by using only information readily available to the dispatcher, renderingLC*a practical policy to implement. Finally, we study a refinement, called
ALC* (Adaptive LC*), which further improves on the response-time performance of
LC*by adapting its actions to incoming traffic rates.
Keywords: cluster-based servers, back-end server architecture, job preemption, simulation.
∗A preliminary version of this paper appeared in theProceedings of the IEEE International Symposium
on Network Computing and Applications (IEEE NCA04).
†DIMACS Center, Rutgers University, 96 Frelinghuysen Road, Piscataway, NJ 08854, email:
‡Department of MSIS, Rutgers University, 94 Rockafeller Rd., Piscataway, NJ 08854, email:
§Department of MSIS, Rutgers University, 180 University Ave., Newark, NJ 07102, email:
1
Introduction
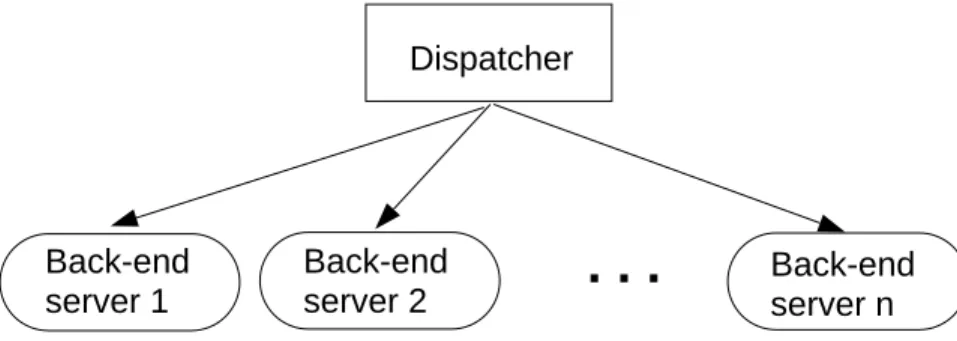
Web servers are becoming increasingly important as the Internet assumes an ever more central role in the telecommunications infrastructure. Applications that handle heavy loads commonly use a cluster-based architecture for Web servers because it combines low costs with good performance. A cluster-based server consists of a front-end dispatcher and several back-end servers (see Figure 1). The dispatcher receives incoming jobs and then decides how to assign them to back-end servers, which in turn process the jobs according to some discipline. The dispatcher is also responsible for passing incoming data pertaining to a job from a client to a back-end server. Accordingly, for each job in progress at a back-end server there is an open connection between the dispatcher and that server.
Back-end server 1 Dispatcher Back-end server 2 Back-end server n
. . .
Figure 1: Architecture of a cluster-based server.
Several dispatcher assignment policies have been proposed for this type of architecture (see, e.g., [3, 17, 21, 24]). Generally, these policies attempt to balance the load among back-end servers according to two main strategies: balancing the amount of work at back-end servers, and balancing the number of jobsbeing processed by back-end servers.
Policies balancing the amount of work. Well-known policies that fall into this cat-egory include Dynamic [23] and Size-Range [10, 5, 18]. Under Dynamic, the dispatcher assigns an incoming job to the back-end server with the smallest amount of residual work, i.e., the sum of service demands of all jobs in the server queue plus the residual work of the jobs currently being served. This policy is optimal from the standpoint of an individual task [10] provided that the following assumptions hold: (a) jobs arrive at the dispatcher according to a Poisson process; (b) job sizes follow an exponential distribution; and (c) jobs are served FCFS (first-come first-served) at each server queue. However, the optimality of
Dynamic comes with several caveats. First, Dynamic requires the dispatcher to know the status of all back-end servers at all times. This type of information is difficult, if at all possible, to acquire, and consequently, Dynamic has not been used by commercial prod-ucts [16, 22]. Second, there is considerable evidence that the sizes of files traveling on the Internet do not follow an exponential-type distribution. Rather, file sizes appear to follow power-law (heavy-tailed) distributions [2, 7, 9] of the form IP[X > x]∼ xcα,where X is the random file size, c > 0, and 1 ≤ α ≤ 2. For power-law job-size distributions, a relatively small fraction of jobs accounts for a relatively large fraction of the overall load.
In contrast with Dynamic, Size-Range policies were designed for heavy-tailed distri-butions. Examples of this type of policy include SITA-E [10], EquiLoad [5], and
Adapt-Load [18]. These policies are motivated by the observation that when “short” jobs are stuck behind “long” jobs, then response time performance suffers degradation. Such situations can be avoided if any back-end server is assigned only jobs of similar sizes. Specifically, if a cluster consists ofn back-end servers, then nsize ranges, [s0, s1), [s1, s2), · · ·, [sn−1, sn), are determined so that each range contains approximately the same amount of work. Ac-cordingly, when a request in the range [sj, sj+1) is received, the dispatcher assigns it to back-end server j. It was shown experimentally that when the sizes of requested files follow a heavy-tailed distribution, then Size-Range performs similarly to or better than
Dynamic [18].
Policies balancing the number of jobs. A well-known policy that falls into this cat-egory is Least-Connected (LC). Under LC, the dispatcher assigns a job to the back-end server currently processing the smallest number of jobs, i.e., the one having the least number of open connections with the dispatcher. Implementing this policy requires the dispatcher to obtain little information; moreover, this information is easy to acquire.
On the performance of assignment policies. Numerous performance studies compare assignment policies experimentally. To the best of our knowledge, all of these studies show that balancing the amount of work is a better strategy than balancing the number of jobs. Indeed, these results reinforce the intuition that using more information leads to better assignments, and hence, to better performance. However, these studies precludejob preemption, i.e., they assume that jobs execute to completion, in FCFS order.
In contrast, this paper studies the performance of the aforementioned policies, with and without job preemption at back-end servers. The incorporation of preemption is motivated by the fact that in practice, most, if not all, back-end servers use preemption to process jobs concurrently (see Section 2.1 for further details). This paper shows empirically that preemption affects dramatically the performance of the policies considered: the perfor-mance of policies balancing the number of jobs improves, while the perforperfor-mance of policies balancing the work amount worsens. More specifically, we found the following:
• When preemption is precluded, Size-Range outperforms LC. However, when pre-emption is allowed, LC outperforms Size-Range substantially.
• When preemption is precluded,DynamicoutperformsLCas expected. However, when preemption is allowed,LCoutperformsDynamicby a factor of two. Moreover,LC with preemption still outperforms Dynamic without preemption by a substantial margin. This suggests that deployingLC with preemptive back-end servers is not only a prac-tical choice, but also yields better performance.
The results of the aforementioned study suggest that if jobs can be preempted, then balanc-ing the number of jobs at back-end servers is a better strategy than balancbalanc-ing the amount of work there. On the face of it, this contention appears to be counter-intuitive, because the latter strategy uses more information than the former. However, our results lend sup-port to the contention that this apparently more detailed information is not as relevant as intuition would lead us to believe. We will elaborate on this point in Section 2.
LC*—a policy combining the two load balancing strategies. An interesting ques-tion in this context is whether combining the two strategies would further improve the performance of a server cluster employing preemption. In this vein, we propose a new policy, called LC*, which aims to balance the number of jobs at back-end servers in a man-ner that avoids creating large disparities in the amount of work at them. In a nutshell,
LC* operates as follows: The dispatcher uses a threshold parameter to classify incoming jobs into short and long, and then short jobs are assigned to the least connected back-end server, while long jobs are assigned to a back-end server, not currently processing a long job. In particular, if all back-end server-queues contain a long job, then the assignment of an incoming long job is deferred until a back-end server completes its large job.
The proposed LC* policy does not achieve perfect balancing of the number of jobs nor the amount of work. However, we argue heuristically that LC* tends to give rise to only relatively minor disparities in these metrics across back-end servers. First, there are no large disparities in the amount of work, because a back-end server queue may contain at most one large job at any given time. Second, there are only minor disparities in the number of jobs: at any given time, the maximal possible difference in the number of jobs assigned to any two back-end server is 2. To see that, note that under LC, the maximal possible difference is 1. However, because, LC*does not require a large job to be assigned to the least connected server, the maximal possible difference may increase, but the increase is limited to 2, since only one large job may be processed by a back-end server at any given time.
To gauge the response-time performance of theLC*policy, we exercised it on empirical data traces measured at Internet sites serving the 1998 World Cup. We mention that Arlitt and Jin [2] show that job sizes from these traces do indeed follow a power-law distribution with α = 1.37. In particular, for the trace considered in this paper, files with sizes greater than 30KB, make up less than 3% of the files requested, but account for over 50% of the overall workload. We show that when files in excess of 30KB are classified as long,LC*outperforms substantially the other policies considered (LC,Dynamic
and Size-Range). Thus, the study demonstrates that a careful assignment of a small number of jobs can have a profound impact on overall response-time performance. It is worth pointing out that the observed improvement in performance is achieved by using only information readily available to the dispatcher. Consequently,LC*is a practical policy with regard to implementation.
The rest of the paper is organized as follows. Section 2 discusses the effects of preemption on the performance of the aforementioned policies by presenting a performance study driven by World Cup data traces. Section 3 presents in detail the LC* policy and illustrates its performance. Section 4 presents an adaptive version of LC*, calledALC*, and discusses its performance using various data traces. Finally, Section 5 concludes the paper.
2
The Impact of Preemption on the Performance of
Assignment Policies
This section presents a simulation study driven by real-life data traces, which shows that when back-end servers admit preemption (i.e., jobs execute concurrently), the strategy of balancing thenumber of jobs at back-end servers outperforms the strategy of balancing the
amount of work.
The study compares Dynamic,Size-Range and LC. To compare the performance of as-signment policies, we simulated a cluster of four back-end servers, driven by a World Cup trace, described below. The experiments were subject to the following assumptions: com-munication times between the dispatcher and back-end servers and the overhead incurred by the dispatcher to select (job, server) pairs are negligible, and all requests are static and served from cache. We will relax these assumptions in Section 4, which studies the effect of the dispatcher overhead, cache misses and dynamic requests on the performance of these policies.
2.1
Back-end Server Scheduling Policies
The study compares the performance of assignment policies under two scenarios:
• Back-end servers employ the non-preemptive scheduling policy FCFS. Under this policy, a back-end server processes to completion jobs assigned to it, in the order of their arrival. We mention that this policy is rarely, if at all, used in practice. (Possibly the only realistic scnario where it can be assumed that jobs are executed in FCFS order is when back-end servers are multi-threaded and use non-preemptive scheduling for threads [6]).
• Back-end servers employ the preemptive scheduling policy Round-Robin. Under the Round-Robin policy, tasks assigned to a back-end server are processed in turn, for an equal pre-defined time interval, or quota. When a task finishes its quota, it is suspended and the next task is allowed to execute (for the same pre-defined quota). It is worth mentioning that there are other preemptive scheduling policies, most notably
SRPT(Shortest Remaining Processing Time). UnderSRPT, a back-end server selects for exe-cution the task with the shortest remaining processing time. It was shown experimentally in [12] thatSRPThas excellent performance. Moreover, it was shown in [8] that multi-layered Round-Robin at the dispatcher followed by SRPT at back-end servers is optimal under certain assumptions1. However, SRPT is rarely used outside of specialized environments because it requires accurate estimates of the runtime of all processes waiting to execute. In contrast, Round-Robin is very simple to implement and commonly used in practice.
1Jobs arrive according to a Poisson process, and their processing times follow a discrete distribution
600 800 1000 1200 1400 1600 1800 2000 2200 2400 2600 0 500 1000 1500 2000 2500 3000 3500 4000 number of requests
time (in seconds)
500000 1e+06 1.5e+06 2e+06 2.5e+06 3e+06 3.5e+06 4e+06 4.5e+06 5e+06 0 500 1000 1500 2000 2500 3000 3500 4000 bytes time (seconds)
(a) Number of request arrivals per second; (b) Total bytes requested per second Figure 2: Empirical request time series from a World Cup trace.
2.2
Simulation Data
Our study used trace data from Internet sites serving the 1998 World Cup. The data used are available from the Internet Traffic Archive (see [2] and http://ita.ee.lbl.gov/html/traces.html). This repository provides detailed information about the 1.3 billion requests received by World-Cup sites over 92 days – from April 26, 1998 to July 26, 1998.
We mention again that Arlitt and Jin [2] have shown that job sizes from these traces follow a heavy-tailed distribution. To further underline the power-law distribution of job-sizes we point out the following aspects of this trace:
• Approximately 75% of the files requested have sizes less than 2KB, which account for less than 12% of the transferred data.
• Files with sizes greater than 30KB, which make up less than 3% of the files requested, account for over 50% of the transferred data. Even more striking, files in excess of 100KB, which make up less than 0.04% of all files requested, account for 7% of the transferred data.
From this repository, we selected a trace covering 1 hour from the June 26 data, and containing approximately 6 million requests. The relevant statistics of this trace are de-scribed next. Figure 2(a) depicts the number of requests received by the World-Cup cluster in successive one-second intervals, while Figure 2(b) plots the number of bytes requested from the same cluster in successive one-second intervals.
The selection of the particular data trace was motivated by the fact that it exhibits arrival-rate fluctuations corresponding to light, medium and heavy loadings in this temporal order, as evidenced by Figure 2. More specifically, the trace allows us to study policy performance under various loading conditions, as follows:
• Light loading. In the time interval [0, 1200], the arrival rate is relatively low (below 1200 requests/second), and the resultant utilization coefficient is also low (≈40%).
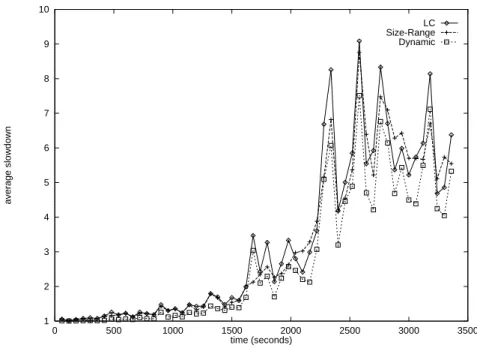
1 2 3 4 5 6 7 8 9 10 0 500 1000 1500 2000 2500 3000 3500 average slowdown time (seconds) LC Size-Range Dynamic
Figure 3: Successive average slowdowns ofDynamic, LC and Size-Range on a cluster with four back-end servers, when jobs are not preempted.
• Medium loading. In the time interval (1200, 2400], the arrival rate is between 1200 and 1800 requests/second, and the resultant utilization coefficient is intermediate.
• Heavy loading. In the time interval (2400, 3600], the arrival rate often exceeds 2000 requests/second, and the corresponding utilization coefficient is high (≈75%). From each trace record, we extracted only the request arrival time and the name and size of the requested file. We mention that the recorded time stamps are in integer seconds, with arrivals on the order of several hundreds of requests per second. Consequently, we have distributed request arrivals uniformly over each second. Since no service time information was recorded, the simulation estimates the service time as the sum of the (constant) time to establish and close a connection, and the (variable, size-dependent) time required to retrieve and transfer a file. The justification for this estimation method may be found in [16, 18, 22].
2.3
Simulation Experiments
The performance metric used to compare assignment policies is slowdown, defined as the ratio between a job’s response time (the time interval from the moment a job arrives at the dispatcher and up until it ends processing at the corresponding back-end server) and its service time.
2.3.1 Job Processing Without Preemption
Figure 3 displays average slowdowns in successive one second intervals for the three assign-ment policies considered, under the assumption that jobs are not preempted (i.e., back-end servers use the FCFS scheduling policy). The figure shows that Dynamic outperforms LC
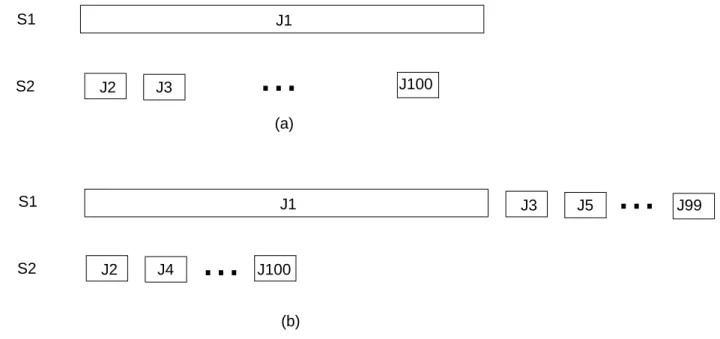
J1 J2 J3 J100 S1 S2 J2 J4 J100 S1 S2 J1 J3 J5 J99 (a) (b)
...
...
...
Figure 4: Server queues under (a) Dynamic and Size-Range, and (b) under LC.
over all time intervals, and therefore, under all simulated loading regimes. Size-Range
performs very well under low and medium loadings: it outperformsLC in all intervals, and it even outperformsDynamic in several time intervals. However, its performance degrades as the load increases — for high loading,Size-Rangestill outperformsLC most of the time, but there are a few time intervals whereLC performs slightly better.
These observations can be explained by the fact that if preemption is precluded, then performance degrades considerably when small jobs are stuck after a large job, as small jobs cannot start before the long one finishes. This situation is best avoided by Dynamic
and Size-Range, which attempt to balance the amount of work at back-end servers. In contrast, this situation occurs more often under LC, which balances the number of jobs.
To gain insight into this explanation, consider the scenario, where a sequence of jobs, J1,. . .,J100, arrives back-to-back at a cluster consisting of two back-end servers, S1 and S2. Assume that J1 requires a service time of 100 seconds, while all others require a service time of 1 second.
UnderDynamic and Size-Range, S1 is assigned the large job, and S2 is assigned all the small jobs (see Figure 4(a)). This way, the amount of work is evenly distributed among the two back-end servers. Then, the large job will be completed in 100 seconds, and the small jobs will be completed in 1, 2,...,99 seconds, respectively. It follows that the slowdown of the large job is 1, while the slowdowns of the small jobs are 1, 2,...,99. Consequently, the average slowdown is approximately 50.
Under LC one of the back-end servers is assigned the large job and 49 small ones, while the other is assigned 50 small jobs (see Figure 4(b)). This way both back-end servers are assigned the same number of jobs. Then, the response times at the first back-end server are 100, 101,....,149 seconds, and those at the second server are 1, 2,...,50 seconds. Therefore the slowdowns incurred by the jobs assigned at the first back-end server are 1, 101, 102, ..., 149, while the slowdowns incurred by the jobs assigned to the second server are 1,2,..., 50.
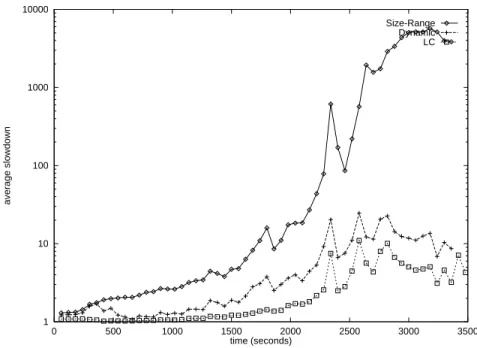
1 10 100 1000 10000 0 500 1000 1500 2000 2500 3000 3500 average slowdown time (seconds) Size-Range Dynamic LC
Figure 5: Successive average slowdowns forDynamic,LC andSize-Range on a cluster with four back-end servers, when jobs are preempted (note the logarithmic scale on the y axis).
Consequently, the average slowdown in this case is approximately 75.
2.3.2 Job Processing With Preemption
The corresponding experiments with preemption simulate back-end servers that schedule jobs using the Round-Robin scheduling policy. Figure 5 displays average slowdowns in successive 60-second intervals. Interestingly, under these assumptions,LCoutperforms both
Dynamic and Size-Range over all time intervals. Moreover, the relative advantage of LC
over Dynamic and Size-Range increases as the load increases. Under light loading, their performance is quite close, but under heavy loading,LC outperforms Dynamic by as much as a factor of 3.
These observations can be explained by the fact that performance is primarily affected here by the number of jobs contending for resources. To gain insight into this explanation, consider the previous scenario, where the sequence of jobs, J1,. . .,J100, arrives back-to-back at a cluster consisting of two back-end servers, S1 and S2 (see Figure 4), and assume that processes are scheduled for execution in Round-Robin manner, with a quota of 0.1 second. Under Dynamic and Size-Range, the average slowdown incurred is approximately 95 sec-onds. To see why, note that the response times (in seconds) for the small jobs are 90, 90.1, 90.2,..., 100, respectively, and therefore, their slowdowns are 90, 90.1, 90.2,..., 100, respectively. By contrast, the large job incurs a slowdown of only 1, since it is served in 100 seconds.
Under LC, the average slowdown is approximately 47 seconds. To see why, note that the response times (in seconds) of small jobs assigned to S2 are just 45, 45.1, 45.2,...., 50. Small jobs assigned to S1 have similar response times, while the response time of the large job is 150 seconds, and therefore, its slowdown is 1.5. Consequently, the average slowdown incurred (≈47) is better by a factor of 2 as compared toDynamicandSize-Range.
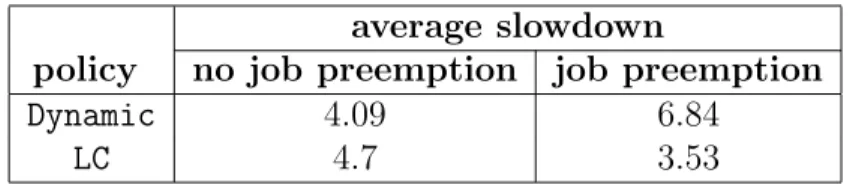
average slowdown
policy no job preemption job preemption
Dynamic 4.09 6.84
LC 4.7 3.53
Table 1: Comparison of statistics forDynamic and LC
Intuitively, the improvement is due to the fact that the average response time is dominated by small jobs, and LC arranges to double the throughput of small jobs as compared to the other two policies.
This example leads us to contend that the larger the variability in the number of jobs across server queues, the poorer the performance of Dynamic and Size-Range. This con-tention is supported by our simulation experiments: Dynamic performs far worst than LC
under heavy loading (where the length of back-end server queues and their variability tend to be large) than under light loading (where the length of server queues and their variability tend to be small).
However, this example fails to explain why Size-Range performs so poorly in compar-ison to Dynamic, especially under very high loading. The intuitive explanation is that, by design, Size-Range induces variability in server queues, while Dynamic does not. To see why, recall that Size-Range clusters jobs of similar sizes and assigns them to dedicated back-end servers. For high loads, the back-end server that serves the largest jobs will have relatively few jobs in its queue, while the back-end server that serves the smallest ones will have relatively many jobs. In contrast, Dynamic simply attempts to balance the number of jobs without segregating them in different servers by size. Consequently, server queues tend to be less disparate in size.
To motivate this contention consider again that a sequence of jobs, J1,. . .,J100, arrives back-to-back at a cluster consisting of two back-end servers, S1 and S2. However, their sizes are slightly modified, namely, assume now that J1 and J2 require a service time of 50 seconds, while all others require a service time of just 1 second. Size-Range assigns the two large jobs to one server, and the small jobs to the other, thus creating a large disparity in server queues. In contrast, Dynamic assigns to both servers a large job and 49 small ones, thus balancing both the load and the amount of work there. It is worth mentioning that the same assignment is produced by LC.
We conclude this section by comparing the average performance of theDynamic andLC
policies with and without preemption (see Table 1). We make three observations based on the table data. First, Dynamic yields better performance without preemption than with preemption. Second, LC’s behavior is opposite, namely, it yields better performance with preemption than without preemption. Finally, LC with preemption outperforms Dynamic
3
The LC* Policy
The experiments and the examples presented in the previous section support the contention that when jobs are executed concurrently, then aiming to balance the number of jobs assigned to back-end servers is more important than balancing the amount of work there. We now proceed to demonstrate experimentally that response-time performance may be further improved if balancing the number of jobs is combined with balancing the amount of work.
To support this claim, consider the following motivating example. Suppose that two large jobs and two small jobs arrive back-to-back at a cluster consisting of two back-end servers. Then, underLC, there are two possible assignments of these jobs. The first assigns a large job and a small job to each back-end server, while the second assigns the two large jobs to one back-end server and the two small ones to the other. Note that the first assignment balances the amount of work, while the second does not. To gauge how this disparity affects response-time performance, assume that the service times of large and small jobs are 100 seconds and 1 second, respectively. Assume further that processes are scheduled for execution in Round-Robin manner, with a quota of 0.1 second. Thus, the response time of each large job under the first assignment is ≈100 seconds, while under the second assignment, it is ≈200 seconds. This outcome is due to the large disparity of workload across back-end servers under the second assignment.
This example suggests that balancing both the number of jobs and the amount of work may lead to improved performance. It further suggests that assigning multiple large jobs to the same back-end server exacts a large response-time penalty, and therefore, such assignments should be avoided. These observations motivate the hybridLC*policy, defined as follows:
1. The dispatcher classifies incoming jobs into long or short relative to a cutoff parameter C.
2. The dispatcher assigns short jobs to the least connected back-end server. 3. The dispatcher assigns a large job to a back-end server whose queue does
not already contain a large job. If there is no such back-end server, the dispatcher defers the assignment until a back-end server completes its large job.
We draw the reader’s attention to the following points. First, the classification into long and short jobs is based on the size of requested documents. Although job service time is pro forma a more relevant classification metric, we nevertheless chosejob size, because the dispatcher has this type of information readily available. Furthermore, it has been shown that the time to serve a request is well-approximated by the size of the requested file [12]. The actual selection of the cutoff parameter is made in such a way that requests for files whose sizes are bigger than C represent only a small percent of incoming requests, but a large fraction of the overall workload (the functional form of a power law distribution facilitates that choice). For example, the trace-driven World Cup simulation used 30K as the value of C.
Secondly, the dispatcher can estimate job sizes only for static requests (dynamic files are created on the fly by the server in response to a request). Consequently, LC*implicitly
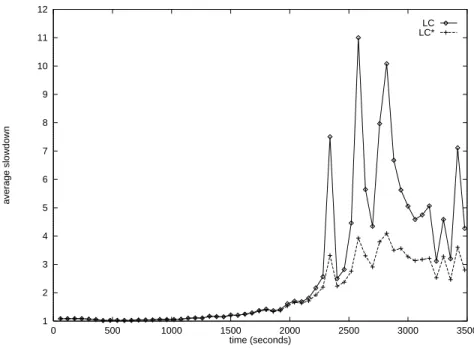
1 2 3 4 5 6 7 8 9 10 11 12 0 500 1000 1500 2000 2500 3000 3500 average slowdown time (seconds) LC LC*
Figure 6: Successive average slowdowns for LC and LC* on a cluster with four back-end servers.
treats dynamic requests as short. Even though this classification may be inaccurate for certain dynamic requests, we argue that for web servers that receive mostly static request (such as news and e-commerce servers), the errors incurred do not substantially affect the performance ofLC*. This point will be discussed in greater detail in Section 4.3.
Finally, LC* is practical to implement in that the extra information required is readily available to the dispatcher, and the processing of this information is quite fast.
We next proceed to demonstrate experimentally, via a case study, thatLC*outperforms bothDynamic and LC. The study simulates a cluster of four back-end servers that process the jobs recorded by the trace of Section 2.2. The simulation sets the value of the cutoff parameter to 30K. Recall that for the trace considered, files with sizes greater than 30KB (which make up less than 3% of the files requested) account for over 50% of the overall workload.
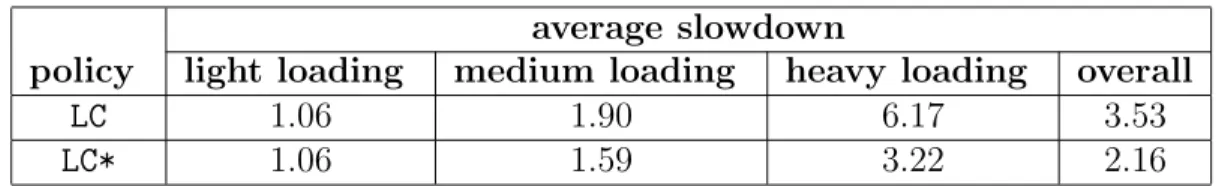
Figure 6 displays average slowdowns of LC and LC* in successive 60-second intervals. Table 2 displays slowdown averages under various loading regimes (light, medium and heavy), as well as over the entire time horizon.
We next proceed to compare the average slowdowns ofLC to those ofLC*:
• Light loading. The average slowdowns of both policies in the lightly-loaded interval [0, 1200] is very close to 1, meaning that jobs are served with almost no delay. These statistics are due to the fact that when the arrival rate is low, a job is often assigned to an idle back-end server.
• Medium loading. As the arrival rate and subsequent utilization increase in the interval [1200,2400],LC*slightly outperformsLC. This is due to the fact thatLC*has only few occasions to make better assignments thanLC.
average slowdown
policy light loading medium loading heavy loading overall
LC 1.06 1.90 6.17 3.53
LC* 1.06 1.59 3.22 2.16
Table 2: Comparative statistics for LC and LC*
outperformsLC by a factor of approximately 2. This behavior is due to the fact that under heavy loading, LC*has many occasions to make better assignments than LC. We conclude this section by noting that LC* outperforms Dynamic with and without preemption by a factor of 3 and 2, respectively (see Tables 1 and 2).
4
ALC* — An Adaptive Version of the LC* Policy
The previous experiments made the simplifying assumption that the overhead incurred by the dispatcher to select (job, server) pairs are negligible. However, this assumption ignores the fact thatLC* does incur some overhead beyond LC, because the dispatcher has to determine the size of a requested file before assigning the request to a back-end server. Consequently, we need to gauge the trade-off between the additional overhead incurred by
LC*and its posited improved performance.
The results of the previous experiment show that LC* outperforms LC dramatically in heavy traffic, while in light and medium traffic, their performance is quite similar. This behavior is explained by the fact that when the arrival rate and utilization are low, back-end server queues rarely contain more than one job. Therefore the chance of two large jobs being assigned to the same back-end server—and, consequently, the chance of unbalancing the amount of work across back-end servers—is very small. In contrast, under heavy traffic, back-end servers often process several jobs simultaneously, and the chances thatLC assigns two or more large jobs to the same back-end server increases.
This observation suggests that the dispatcher should employ an adaptive policy: it should useLCin light traffic, and switch toLC*in heavy traffic. Thus, under such an adap-tive policy, the overhead attendant to LC* is incurred only when it gives rise to improved performance. There is a direct correspondence between traffic and M, the minimum queue size of back-end servers: under light traffic, Mtends to be 0, while under medium or heavy traffic,M tends to exceed 1.
The adaptive version of LC*, which we call ALC*, is defined as follows:
1. If Mis 0, then the dispatcher uses the LC policy, i.e. it assigns an incoming request to a back-end server with the smallest number of jobs.
2. Otherwise, if M exceeds 0, then the dispatcher assigns an incoming request using the LC* policy.
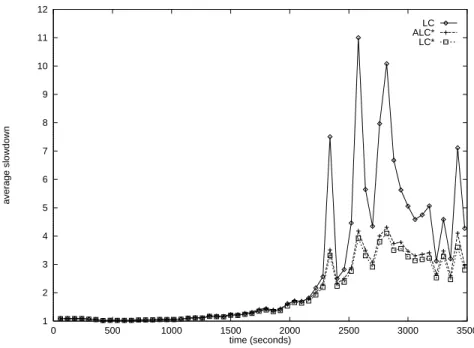
1 2 3 4 5 6 7 8 9 10 11 12 0 500 1000 1500 2000 2500 3000 3500 average slowdown time (seconds) LC ALC* LC*
Figure 7: Successive average slowdowns forLC, ALC* and LC* on a cluster with four back-end servers.
To gauge the performance of ALC* we exercised it on the same World Cup trace, and compared the results with those obtained forLC* and LC (see Section 3). The experiment used the same parameter value for ALC* as for LC*, namely, a file was classified as large, if it exceeded 30K. When M exceeded 0, the simulation added an overhead of 19 µs to the processing time of each request (this value was obtained experimentally).
The results of the simulation are displayed in Figure 7. In the time interval [0,2000], M
is almost always 0, and the performances of ALC*and LC are identical as expected. In the time interval (2400,3600], M almost always exceeds 0 and ACL* outperforms LC by almost a factor of 2 (the average slowdown of ALC* is 3.43, while the average slowdown of LC is 6.28). Note that the job classification overhead incurred by ALC*, affects its performance only minimally (the average slowdown increases from 3.22 to 3.43). Thus, it pays to spend the extra overhead time of searching for file sizes in order to balance the amount of work at back-end servers.
The remainder of this section studies the effect of various factors onALC*performance, as well as its scalability.
4.1
The Effect of Dispatcher Overhead on ALC* Performance
This section starts with a brief review of common cluster architectures and analyzes the re-sultant dispatcher overhead. It then proceeds to analyze the impact of dispatcher overhead onALC* performance.
From the point of view of how requests are assigned to back-end servers one distinguishes between two types of architectures:
• Architectures that perform delayed binding (content-aware binding), where the dis-patcher examines client requests before assigning them to back-end servers. In
par-ticular, this type of architecture is employed by layer-7 Web switches.
• Architectures that perform immediate binding (content-blind routing), in which the dispatcher assigns jobs to back-end servers immediately, without examining their content. In particular, this type of architecture is used by layer-4 Web switches.
From the point of view of how responses are returned to client, one distinguishes between two architectures:
• One-way architectures, where back-end servers respond directly to clients.
• Two-way architectures, where back-end servers return responses to the dispatcher, which in turn sends them back to clients.
From this brief presentation2we conclude that dispatcher overhead is indeed negligible when the cluster employs immediate binding. However, dispatcher overhead is not negligible in two-way clusters employing delayed binding.
To study the effect of dispatcher overhead on the performance of assignment policies, we ran experiments simulating two-way clusters employing delayed binding. In these ex-periments, the dispatcher overhead was estimated by the formula: c1+c2∗file size, where the first term of the sum denotes the (constant) time to perform delayed binding, and the second term denotes the (variable, size-dependent) time required to transmit a client request via the dispatcher. The numerical values used by the simulation for constants c1 and c2 are, respectively, 10 µs and 5 µs/KB. These values have been derived from the experimental results presented in [25]. As in the previous experiment, whenALC* behaves like LC*, it incurs an additional overhead of 19 µs, which estimates the time it takes to determine whether a requested file is long or short.
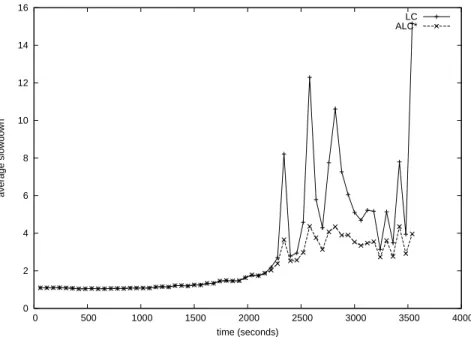
Figure 8 depicts the average slowdowns of LC and ALC* when the dispatcher overhead is computed as described above. As expected, the performance degrades: the average slowdowns of LC and ALC* in heavy traffic are 6.53 and 3.56, respectively. However, the performance is not heavily impacted by the dispatcher overhead: recall that in the previous experiment, where dispatcher overhead was ignored, the average slowdowns ofLC andALC*
in the corresponding regime were 6.28 and 3.56, respectively (see Figure 7).
It is worth mentioning that the LC policy can be supported by an immediate binding architecture, whereasALC*can be supported only by a delayed binding architecture (which incurs higher overhead than immediate binding architectures). This experiment shows that
ALC*achieves better performance even when compared withLC implemented on immediate binding architectures. More specifically, the average slowdown ofALC* in periods of heavy traffic is 3.56. In contrast, when the dispatcher overhead is ignored, the average slowdown incurred byLC in the corresponding regime is 6.28.
4.2
The Effect of Cache Misses on ALC* Performance
All the experiments performed so far assumed that all requests are served from cache. This assumption is motivated by the fact that cache misses occur relatively infrequently. For
0 2 4 6 8 10 12 14 16 0 500 1000 1500 2000 2500 3000 3500 4000 average slowdown time (seconds) LC ALC*
Figure 8: Successive average slowdowns for LC and ALC* on a two-way cluster employing delayed binding.
example, Arlitt and Jin [2] studied the World Cup trace and observed that 89% of the total requested data referred to only 10% of the files. Still, it is worthwhile to study the impact of cash misses on assignment policies. To this end, this section compares the effect of cache misses on the performance of Dynamic, LC and ALC*. (The performance of Size-Range is not depicted because it is substantially worse than the performance of all other policies).
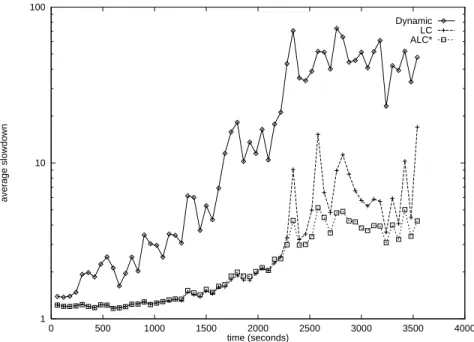
The simulation experiments used the LRU cache replacement policy, where files with sizes in excess of 500 KB are never cached. The model for back-end server processing used by the study assumes that the CPU and disk times for distinct requests can overlap, as shown in Figure 9(a). (For more details regarding the underlining model, see [16]). The simulation used the following values prescribed in [16]: disk latency was set at 28ms (two seeks plus a rotational latency), and disk transfer was set at 410µs per 4KB. An additional 14ms (a seek plus rotational latency) is incurred for every 44KB of files larger than 44KB. Figure 9(b) depicts the average slowdowns ofDynamic, LCand ALC*when the cache hit ratio is 99% (i.e., 1% of the requests are served from disk). Dynamic still has the worst performance, even though it assumes known service times, and therefore, the dispatcher knows whether a request is served from cache or from disk. Note, however, that this information is not assumed known in LC and ALC*. Even in the presence of cache misses,
ALC* still outperforms LC significantly in heavy traffic. To wit, the average slowdown of
ALC*is 4.01, as compared to an average slowdown of 6.99 forLC. Note that this performance advantage of ALC* over LC is slightly less than the case when cache misses were precluded (see Figure 7).
CPU
disk
done incoming requests
cache misses
file read
request not completed
1 10 100 0 500 1000 1500 2000 2500 3000 3500 4000 average slowdown time (seconds) Dynamic LC ALC*
Figure 9: (a) Back-end server processing when cache misses occur. (b) Successive average slowdowns ofDynamic,LC andALC*on a cluster with four back-end servers, for a cache hit ratio is 99% (note the logarithmic scale on the y axis).
4.3
The Effect of Dynamic Requests on ALC* Performance
The experiments performed so far assumed that all requests are static, i.e., requests are for already-created documents. The assumption is motivated by the fact that most Web servers receive overwhelmingly more static requests than dynamic ones [1, 12, 15]. A case in point is the World Cup trace, where only 0.02% of requests were dynamic. Still, it is important to study the effect of dynamic requests on the performance of assignment policies. This section shows that when the percentage of dynamic requests is small, then
ACL* outperforms all other policies considered here. However, when the percentage of dynamic requests increases, the gap in performance between ALC* and LC closes.
Figure 10 displays the average slowdown of Dynamic, LC and ALC* when the cache hit ratio is 99% and 0.02% of requests are treated as dynamic. Here, the service time of a dynamic request is larger by a factor of 10 than the service time of a static request of the same size (served from cache). This factor value was estimated empirically in [22].
The results show thatDynamic again exhibits the worst performance, even though this policy assumes precisely known service times for all requests. And again,ALC*outperforms
LC significantly in heavy traffic. To wit, the average slowdown of ALC* is 4.07, while that of LC is 7.52. Note that the performance of ALC* is influenced by the presence of dynamic requests to a lesser degree thanLC. Specifically,ALC*experiences a 1.5% increase in average slowdown, whileLC experiences a 7% increase.
The rather negligible effect of dynamic requests on ALC*performance can be explained by analyzing the nature of disparities created by such requests. First, since the dispatcher does not know the size of dynamic requests, which are created on the fly by back-end servers, it follows that large disparities in the amount of work assigned to back-end servers can occur when a large static job and a dynamic job are assigned to the same back-end server. However, such disparities do not affect performance considerably, because the corresponding jobs rarely compete for resources (a large file is likely not cached, so the corresponding job is disk-intensive, while a dynamic request is CPU-intensive).
1 10 100 0 500 1000 1500 2000 2500 3000 3500 4000 average slowdown time (seconds) Dynamic LC ALC*
Figure 10: Successive average slowdowns forDynamic, LC and ALC* on a cluster with four back-end servers, when 0.02% of requests are dynamic and the cache hit ratio is 99% (note the logarithmic scale on the y axis).
same back-end server. However, if the percentage of dynamic requests is small, then this situation occurs only rarely.
Next, we consider the case where dynamic requests are a substantial part of the work-load. Accordingly, Figure 11 displays the average slowdowns ofDynamic,LCandALC*when 10% of requests are treated as dynamic. Note that in this experiment the cluster has eight back-end servers; this is because the substantial increase in dynamic requests leads to a substantial increase in the cluster workload, which basically brings a four back-end cluster to a standstill (average slowdowns well in excess of 5000).
The results show that the performances ofLC andALC*are essentially indistinguishable. Specifically, the average slowdown over the entire time horizon ofALC*andLC is 2.589 and 2.588, respectively. This result can be explained by the fact that dynamic requests, which now constitute the bulk of large requests, are treated similarly under ALC* and LC. By definition, the sizes of dynamic requests are not known a-priori, and, therefore,ALC*treats them as small jobs, and thus cannot make better assignments thanLC. In effect,ALC*makes better assignments just for large static requests, which is barely enough to compensate for the overhead incurred. In conclusion, this last experiment supports the contention that
ALC* should be used only for clusters that receive overwhelmingly more static requests than dynamic ones.
4.4
Scalability of ALC*
The study presented in this section compares the performance of Dynamic, LC and ALC*
as the cluster size grows larger. The first experiment, depicted in Figure 12, considered a cluster with six back-end servers and used the same World Cup trace. As can be seen,
2 3 4 5 6 7 8 9 10 11 12 0 500 1000 1500 2000 2500 3000 3500 4000 average slowdown time (seconds) Dynamic LC ALC*
Figure 11: Successive average slowdowns for Dynamic, LC and ALC* on a cluster of eight back-end servers, when 10% of requests are dynamic and the cache hit ratio is 99%.
1 1.5 2 2.5 3 3.5 4 4.5 5 0 500 1000 1500 2000 2500 3000 3500 4000 average slowdown time (seconds) Dynamic LC ALC*
Figure 12: Successive average slowdowns forLC,ALC*and LC* on a cluster of six back-end servers, when 10% of requests are dynamic and the cache hit ratio is 99%.
the performances of LC and ALC* are practically indistinguishable: the average slowdown over the entire time horizon is 1.19 for both of them. The explanation is that the load on back-end servers decreases as their number increases. In effect, under LC and ALC*, there is often an idle back-end server, so thatMis 0 most of the time. Consequently, ALC*largely behaves likeLC.
Since studying the scalability of ALC* using the World Cup trace proved inconclusive because the load was too low, we generated a power-law synthetic trace which could stress
2000 2500 3000 3500 4000 4500 5000 0 50 100 150 200 250 300 350 400 number of requests time (seconds) 6e+06 8e+06 1e+07 1.2e+07 1.4e+07 1.6e+07 1.8e+07 2e+07 0 50 100 150 200 250 300 350 400 bytes time (seconds)
(a) Number of request arrivals per second (b) Total bytes requested per second Figure 13: Empirical time series of the synthetic trace.
a bigger cluster. The synthetic trace was generated using a traffic generator, called Geist, designed at Intel [13, 14]. The relevant statistics of this trace are described next.
Simulation Data. The aforementioned trace consists of over 4.6 million requests received over a time interval of approximately 400 seconds. This trace offered the cluster both medium and high loadings, with utilization exceeding 50%. Figure 13(a) depicts the number of requests received by the cluster in successive one-second intervals, while Figure 13(b) plots the number of bytes due to file requests in successive one-second intervals.
Simulation Experiments. Figure 14 displays the average slowdowns ofDynamic,LCand
ALC*in successive 10-second intervals for a cluster of eight back-end servers. Observe that
ALC* outperforms both Dynamic and LC in all time intervals. Moreover, the performance advantage ofALC*overDynamic andLCin a cluster of eight back-end servers is comparable to that in a cluster of four back-end servers. This suggests that ALC* scales well.
5
Conclusion
Several conclusions can be drawn from the studies presented in this paper. First, the architecture of back-end servers affects profoundly the performance of assignment poli-cies. Specifically, the paper shows experimentally that the performance of Dynamic and
Size-Range is far better when preemption is precluded than when it is admitted.
The second conclusion is that if jobs can be preempted, then balancing the number of jobs at back-end servers is a better strategy than balancing the amount of work there. In particular, the paper shows experimentally that LC (which uses the former strategy) performs far better than Dynamic and Size-Range (which use the latter strategy).
Finally, the study supports the contention that combining the two balancing strategies yields slowdown performance superior to that of each strategy alone. Specifically, the paper proposes two new policies,LC*andALC*, which improve overLC,DynamicandSize-Range, especially under heavy traffic regimes. A notable feature of the proposed policies is that
0 20 40 60 80 100 120 140 160 180 200 0 50 100 150 200 250 300 350 400 average slowdown time (seconds) Dynamic LC ALC*
Figure 14: Successive average slowdowns of Dynamic, LC and ALC* in a cluster of eight back-end servers (note the logarithmic scale on the y axis).
they have only modest informational and computational requirements, and this renders them practical candidates for real-life implementation.
References
[1] Arlitt, M., Friedrich, R. and Jin, T. “Workload characterization of a Web proxy in a cable modem environment”.ACM Performance Evaluation Review, 27(2), 25-36, 1999. [2] Arlitt, M. and T. Jin. “Workload characterization of the 1998 World Cup Web Site,”
IEEE Network, 14(3), 30-37, May/June 2000. Extended version: Tech Report HPL-1999-35R1, Hewlett-Packard Laboratories, September 1999.
[3] Bruckner, P. Scheduling Algorithms, Third Edition, Springer-Verlag, 2001.
[4] Cardellini, V., E. Casalicchio, M. Colajanni and P. S. Yu. “The state of the art in lo-cally distributed Web-server systems”,ACM Computing Surveys, 34(2):263-311, 2002. [5] Ciardo, G., A. Riska and E. Smirni. “EquiLoad: A Load Balancing Policy for Clustered
Web Servers”. Performance Evaluation, 46(2-3):101-124, 2001.
[6] Coulouris, G., J. Dollimore and T. Kindberg. Distributed Systems - Concepts and Design, (3rd edition), Addison-Wesley, 2001.
[7] Crovella, M.E., M.S. Taqqu and A. Bestavros. “Heavy-tailed Probability Distributions in the World Wide Web”. In A Practical Guide To Heavy Tails, Chapman Hall, New York, 3–26, 1998.
[8] Down, D.G. and Rong Wu, “Multi-layered round robin routing for parallel servers”. In Queueing Systems: Theory and Applications, 53(4), 177-188, J. C. Baltzer AG, Science Publishers.
[9] Faloutsos, M., P. Faloutsos and C. Faloutsos. “On Power-Law Relationships of the Internet Topology,” Proceedings of ACM SIGCOMM ’99, 251-262, Aug. 1999.
[10] Harchol-Balter M., M.E. Crovella and C.D. Murta. “On Choosing a Task Assignment Policy for a Distributed Server System”.Proceedings of Performance Tools ’98, Lecture Notes in Computer Science, 1468:231-242, 1998.
[11] Harchol-Balter, M. “Task Assignment with Unknown Duration,”Journal of the ACM, Vol. 49, No. 2, 260-288, March 2002.
[12] Harchol-Balter M., B. Schroeder, N. Bansal, M. Agrawal. “Size-based Scheduling to Improve Web Performance.” ACM Transactions on Computer Systems, 21(2), May 2003.
[13] Kant, K., V. Tewari, and R. Iyer. “Geist: A generator of E-commerce and Internet Server Traffic”, Proceedings of IEEE International Symposium on Performance Anal-ysis of Systems and Software (ISPASS), 49-56, November 2001.
[14] Kant, K., V. Tewari and R. Iye. “Geist: A Web Traffic Generation Tool Source”, Pro-ceedings of the 12th International Conference on Computer Performance Evaluation, Modeling Techniques and Tools, Lecture Notes in Computer Science, 2324:227-232, 2002.
[15] Krishnamurthy, B. and J. Rexford.Web Protocols and Practice : HTTP 1.1, Network-ing Protocols, CachNetwork-ing, and Traffic Measurement, Addison-Wesley, 2001.
[16] Pai, V.S., Aron, M., Banga, G., Svendsen, M., Druschel, P., Zwaenepoel, W. and Nahum, E. “Locality-aware Request Distribution in Cluster-based Network Servers”,
Proceedings of the Eighth International Conference on Architectural Support for Pro-gramming Languages and Operating Systems (ASPLOS-VIII), 1998.
[17] Pinedo, M.Scheduling: Theory, Algorithms, and Systems, Prentice Hall, 2002.
[18] Riska, A., W. Sun, E. Smirni and G. Ciardo. “AdaptLoad: Effective Balancing in Clus-tered Web Servers Under Transient Load Conditions,”22nd International Conference on Distributed Computing Systems (ICDCS’02), 2002.
[19] Rothkopf, M.H. “Scheduling with Random Service Times”, Management Science, 12:703-713, 1966.
[20] Smith, W.E. “Various Optimizers for Single-Stage Production”, Naval Research Lo-gistics Quarterly, 3:59-66, 1956.
[21] Ross, S.M.Probability Models for Computer Science, Academic Press, 2002.
[22] Teo Y.M. and R. Ayani. “Comparison of Load Balancing Strategies on Cluster-based Web Servers”, Simulation, 77(5-6), 185-195, November-December 2001.
[23] Winston, W. “Optimality of the Shortest Line Discipline,”Journal of Applied Proba-bility, 14, 181–189, 1977.
[24] Ungureanu, V., Melamed, B., Katehakis, M, and Bradford, P. G. “Deferred Assign-ment Scheduling in Cluster-based Servers”,Cluster Computing, 9(1), 2006.
[25] Zhao, L., Luo, Y., Bhuyan, L. and Iyer, R. “A Network Processor-Based, Content-Aware Switch”, IEEE Micro, 26(3), 72–84, 2006.