A Service Performance Insight White Paper
Service Compass:
Charting the Course to
Professional Service Excellence
Best Practices of the Best-of-the-Best
Professional Services Organizations
May 2015
Introduction ... 1
Professional Services Maturity Model™ ... 1
Professional Services Maturity Model™ Benchmark Levels ... 2
Does Professional Services Maturity Matter? ... 2
NetSuite Powers the Best-of-the-Best ... 3
Survey Demographics ... 3
Best-of-the-Best Pillar Performance ... 4
Leadership ... 4
Client Relationships ... 4
Human Capital Alignment ... 5
Service Execution ... 6
Finance and Operations ... 7
Integrated Applications Make the Difference ... 8
Buy PSA to Improve Performance, Integrate PSA to Improve Profit ... 9
Best-of-the-Best Conclusions ... 9
About NetSuite ... 10
About Service Performance Insight ... 12
FIGURES Figure 1: Service Performance Pillars™ ... 1
Figure 2: Professional Services Maturity Model™ Levels ... 2
Figure 3: 2015 PS Maturity™ Benchmark Progression – 220 Firms ... 2
Figure 4: Optimize the “Quote-to-Cash” Process ... 8
Figure 5: Integrated PSA Helps Improve Profit ... 9
Figure 6: What Sets the Best-of-the-Best Apart ... 10
TABLES Table 1: NetSuite Powers the Best-of-the-Best ... 3
Table 2: Best-of-the-Best Comparison – Demographics ... 3
Table 3: Best-of-the-Best Comparison – Leadership ... 4
Table 4: Best-of-the-Best Comparison – Client Relationship ... 5
Table 5: Best-of-the-Best Comparison – Human Capital Alignment ... 6
Table 6: Best-of-the-Best Comparison – Service Execution ... 7
Table 7: Best-of-the-Best Comparison – Finance and Operations ... 7
Table 8: Best-of-the-Best Applications and Level of Integration ... 8
I
NTRODUCTIONIn the professional services sector, 2015 marks the year that the great recession finally ended and business returned to normal. But the new normal in technology services is very different than the normal that led up to 2008. The cloud gold-rush continues unabated and has spread to the enterprise – ushering in a new wave of well-capitalized global competitors that are squarely focused on solving big business problems in sales, marketing, talent management and finance. Cloud computing will grow from a $41 billion business in 2011 to a $241 billion business in 2020, forever disrupting the status quo.
Against this turbulent backdrop, top professional services organizations found ways to thrive. According to the 2015 Professional Services Maturity™ Benchmark, out of 220 participating organizations, 11 firms significantly outperformed the benchmark average by excelling in all five service performance dimensions: leadership, client relationships, human capital alignment, service execution, and finance and operations. With much higher profits and more satisfied clients, these firms outperformed their peers and gained competitive advantage.
In this white paper, SPI Research focuses on four of this year’s Best-of-the-Best service
organizations, each of which relies on NetSuite’s powerful professional services automation (PSA) solution to provide visibility and control across all aspects of service operations. This paper focuses on the best practices that differentiate Best-of-the-Best firms from average firms.
P
ROFESSIONALS
ERVICESM
ATURITYM
ODEL™
SPI Research uses the PS Maturity Model™ as a diagnostic tool to measure the maturity of PS business, talent and financial processes. The core tenet of the PS Maturity Model™ is service, and project-oriented organizations achieve success through the optimization of five Service Performance Pillars™ (Figure 1):
1. Leadership – Vision, Strategy and Culture: Clarity,
alignment and communication of a compelling vision and strategy.
2. Client Relationships: Marketing and sales effectiveness.
3. Human Capital Alignment: The ability to recruit, hire and engage a talented consulting workforce.
4. Service Execution: The ability to deliverhigh quality services and projects on time and on budget.
5. Finance and Operations: The ability to budget, forecast, measure and manage cash flow to meet revenue and profit objectives.
Figure 1: Service Performance Pillars™
Within each of the Service Performance Pillars™, SPI Research has developed guidelines and key performance measurements that correspond to levels of maturity to provide a roadmap to service performance excellence.
Professional Services Maturity Model™ Benchmark Levels Figure 2 depicts maturity level
progression and outlines primary characteristics for each maturity level. The bottom line is that as organizations improve
performance through better focus, alignment, communication and collaboration, the more “mature” they become.
Integrated business applications are a catalyst for improving maturity as they provide real-time visibility to all aspects of measuring and managing business performance.
Does Professional Services Maturity Matter?
SPI Research has spent the past eight years benchmarking varying levels of operational
performance or “maturity” to determine the characteristics and appropriate behaviors for PSOs based on their organizational lifecycle stage.
Figure 3 highlights major key performance measurements by maturity level, and demonstrates the benefits of investing in a program to assess and advance maturity.
Figure 3: 2015 PS Maturity™ Benchmark Progression – 220 Firms
Source: Service Performance Insight, May 2015
Figure 2: Professional Services Maturity Model™ Levels
N
ETS
UITEP
OWERS THEB
EST-
OF-
THE-B
EST Each year ServicePerformance Insight
conducts in-depth analysis of the top 5% of PS Maturity™ benchmark participants to uncover the reasons for their superlative performance. After a careful audit of their survey responses and in-depth interviews with lead service executives, the top performing organizations are
named Best-of-the-Best. The top 5% (11 firms) scored 20 or higher on a scale of 25 on the PS Maturity Model™.
According to this year’s analysis, four of this year’s top eleven firms rely on NetSuite’s powerful PSA platform to provide visibility and management control across all aspects of service operations.
S
URVEYD
EMOGRAPHICSTable 2 compares the 11 Best-of-the-Best performing PSOs to the other 209 in this year's survey. Best-of-the-Best organizations tend to be more specialized and slightly smaller than average firms
in the benchmark. They are characterized by high levels of growth,
productivity and profit as they deliver superlative client outcomes resulting in high levels of customer satisfaction.
To support their growth, top performers expanded their workforce at a much higher rate than average firms. They also had a much higher percentage of billable employees, and depended less on third-party resources, preferring to recruit and deploy their own talented resources without
Table 1: NetSuite Powers the Best-of-the-Best
2015 Best-of-the Best Winner PS Vertical PS Size
Campus Management PS w/in Software company 101 - 300
TOP Step Consulting, LLC Management Consulting 10 - 30
Mxi Technologies PS w/in Software company 31 - 100
Vision Solutions PS w/in Software company 31 - 100 Source: Service Performance Insight, May 2015
Table 2: Best-of-the-Best Comparison – Demographics
Key Performance Indicator (KPI) Best Rest ▲
Organizations 11 209
Size of PS organization (employees) 160 294 -46% Annual company revenue (mm) $57.0 $145.6 -61% Total professional services revenue (mm) $29.1 $56.6 -49% Year-over-year change in PS revenue 13.9% 9.8% 42% Year-over-year change in PS headcount 11.6% 7.9% 46% % of employees billable or chargeable 84.1% 74.7% 13% % of PS revenue delivered by 3rd-parties 2.0% 12.9% -84%
EBITDA 26.0% 12.2% 112%
Source: Service Performance Insight, May 2015 According to the 2015 PS
Maturity™ benchmark, four of this year’s top eleven firms rely on NetSuite’s powerful PSA platform to provide visibility and
management control across all aspects of service operations.
relying on subcontractors which translated to higher levels of both employee and client satisfaction.
B
EST-
OF-
THE-B
ESTP
ILLARP
ERFORMANCELeadership
The leading firms are highly specialized. They concentrate on specific high-growth IT segments or vertical industries. The executives of top-performing firms are seasoned professionals – often with a track record of founding and growing multiple prior consulting organizations. A recurring theme from this year’s leaders is their strong sense of community. The leaders of the top firms are seen as visionaries within the markets they serve, they see their role as one of truly helping improve the lives of their clients and employees. They select clients and projects because they share the same values….whether it is a love of avionics or desire to make a difference through healthcare and government programs. Their sense of pride and commitment comes through in the organizations they have developed.
Table 3 compares the leadership metrics of the highest performing organizations with the remainder of the survey. The two highest differential scores are innovation and goals and measurements in alignment.
Client Relationships
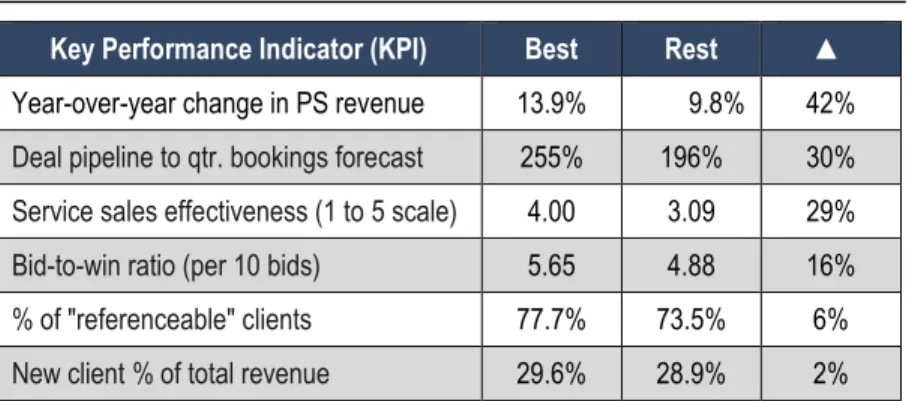
Surprisingly most of this year’s Best-of-the-Best do not employ traditional solution sales people. The independent IT consultancies depend on their regional practice leaders to be the chief rainmakers in their region or domain. Repeat business and referrals are the primary source of new business, a strong testimony to superlative client relationships and results. The embedded PSOs rely on the product sales force to sell services in conjunction with products. They have forged a strong partnership with product sales and have built sales tools and service packages to guide and shape consulting engagements.
Table 4 compares Client Relationship pillar metrics between the Best-of-the-Best and the other organizations in the survey. Leaders do not have the schism between sales and service delivery which is so apparent in many PSOs. Sales and delivery collaboration produced larger deal
Table 3: Best-of-the-Best Comparison – Leadership
Key Performance Indicator (KPI) Best Rest ▲ Innovation focused 4.36 3.63 20% Goals and measurements in alignment 4.36 3.58 22% Confidence in PS leadership 4.64 3.98 17% Ease of getting things done 4.18 3.65 15%
Source: Service Performance Insight, May 2015 “Campus Management is
committed to quality and it shows through in the commitment of the talented PS team as well as the superior products that our company consistently provides to our clients,” stated Danielle Guille, Vice President of Professional Services. “SPI Research’s core criteria in evaluating organizations – including leadership, client
relationships and service execution – are areas in which we focus daily to ensure that we are meeting our clients’ needs and delivering solutions that make a positive impact on their business.”
pipelines, a much higher bid-to-win ratio and better sales and marketing effectiveness. These organizations also had a much higher percentage of referenceable clients leading to more new and repeat client revenue.
Mxi Technologies, one of this year’s Best-of-the-Best, is a market and technology leader providing integrated software, support and services to the aviation industry. Through its comprehensive portfolio of services, Mxi offers a proven solution and a demonstrated approach for aviation organizations. Industry-focused solution delivery teams craft compelling solutions encompassing technology, data, change management, planning and collaboration. In 2013 Mxi moved to centralize resource management, with a focus on meeting staffing requirements, improving utilization and managing talent. Account managers now focus on customer satisfaction, driving revenue and reference building. In 2014 Mxi implemented NetSuite OpenAir and credit it with providing a huge boost in service execution maturity. Mxi can now enforce the consistent application of best practices for resource management, capacity planning and timesheet collection resulting in significant gains in billable utilization.
Human Capital Alignment
Talent is a primary focus and hot topic for all services organizations. In an increasingly tight talent market, top performing firms intently focus on employee engagement and satisfaction by offering career-enhancing training and mentoring.
The leading firms use a variety of innovative recruiting strategies – from establishing strong partnerships with local universities, to attracting more senior consultants from their competitors. Just as in selling, referrals are a key source of new hires because the best and brightest invite their friends to join them. Once on board, the best firms offer new-hire orientation and on-boarding programs that
Table 4: Best-of-the-Best Comparison – Client Relationship Key Performance Indicator (KPI) Best Rest ▲ Year-over-year change in PS revenue 13.9% 9.8% 42% Deal pipeline to qtr. bookings forecast 255% 196% 30% Service sales effectiveness (1 to 5 scale) 4.00 3.09 29% Bid-to-win ratio (per 10 bids) 5.65 4.88 16% % of "referenceable" clients 77.7% 73.5% 6% New client % of total revenue 29.6% 28.9% 2%
Source: Service Performance Insight, May 2015 Mxi Technologies
-“Moving to centralize resource management and adopt NetSuite OpenAir as our Professional Services Automation solution has been a game-changer for Mxi,” says Paul Bérubé Program Director, Services Operations for Mxi. “The transition from spreadsheets to OpenAir:
Forced hours to cash
consistency across all projects.
No more lost or
un-billable hours
Reduced paperwork
and administration time for invoicing. Invoices are issued accurately and on-time.
Enhanced
accountability for revenue forecasting. Our revenue forecast is accurate up to the minute.
Drove accountability
for timely and weekly timesheet and project expense submission and approval. Management and
operations can now focus more strategically with better analysis and visibility rather than wasted hours producing manual reports.”
include shadowing and mentoring to quickly bring new hires up to speed. Leading firms have discovered they simply cannot rely on stealing top talent from their competitors – they need to grow their own.
Table 5 compares Human Capital Alignment pillar KPIs between Best-of-the-Best organizations and the remainder. The best place a premium on finding and retaining qualified staff. They invest more than average firms in training and career management, resulting in better retention and employee satisfaction.
A notable difference is in billable utilization, where leading firms average 1,542 billable hours per year compared to the others, which average 1,412 billable hours per year. The additional billable hours per year definitely improve financial performance.
Service Execution
Precision service execution is the hallmark of Best-of-the-Best firms. Many top performers (4 of 11) rely on NetSuite as the system of record for resource management, time and expense capture and billing. NetSuite is credited with powering superlative resource management and estimating effectiveness. The project dashboard reflects budget to actuals and overruns to ensure variances are visible so they can be quickly remedied. It improves resource and project management leading to high levels of billable utilization and on-time project completion.
Visibility into upcoming projects along with current activities allows top performers to smooth peaks and valleys in demand. NetSuite helps them schedule short-term work and tasks around longer-term project commitments. Not an hour of time or expense is wasted because the easy-to-use cloud application is always accessible, allowing firms to rapidly capture time and expense to generate accurate invoices.
Campus Management relies on NetSuite for its best-in-class PMO, charged with establishing and enforcing quality standards on all projects. 90% of project managers are PMI certified. Their implementation methodology, proven on over 1,700 projects, contains clearly defined steps,
Table 5: Best-of-the-Best Comparison – Human Capital Alignment Key Performance Indicator (KPI) Best Rest ▲ Well-understood career path for all employees
(1 to 5 scale) 4.33 3.07 41%
Guaranteed annual training days per employee 9.55 8.12 18% Employee billable utilization 77.1% 70.6% 9% Management to employee ratio 9.58 10.08 -5% Employee annual attrition 9.9% 8.8% -12%
Source: Service Performance Insight, May 2015 Vision Solutions – “As
data and data centers grow, businesses must design and build greater reliability and resilience into their mission-critical systems and test them – often,” said Terry Plath, vice president,
professional services for Vision Solutions.
“Unfortunately, these tests are infrequent - at best. That’s where companies can leverage the depth of experience of a services partner to ensure uptime of their mission-critical systems and compliance with service-level agreements (SLAs). We are honored that SPI considers Vision Solutions among ‘The Best-of-the-Best’ and we consider it a reflection of the hard work and professionalism of each of our team members.”
deliverables, check points and quality reviews. Campus has built a best practice library where processes are documented and stored including sample deliverables. Team leaders serve as knowledge champions to drive continuous improvement.
The Service Execution pillar is where the rubber hits the road – where revenue, profit and client delight are generated. Table 6 compares service execution metrics between the Best-of-the-Best organizations and the remainder. All service execution metrics reflect significant advantages between the top performers and average organizations. Leaders have larger projects, more rigorous quality processes, fewer project overruns and fewer projects cancelled. Leaders focus on all aspects of service delivery, with higher marks for knowledge management, resource
management and estimating and change control processes.
Their focus on service delivery excellence produces superlative productivity with 84% of their employees in billable roles and 77% billable utilization. Because leaders rely on a commercial PSA application, they are
able to build and reinforce project
delivery standards which result in precision execution and high levels of quality, productivity and profitability. Finance and Operations
One of the hallmarks of the leaders is their attention to measuring and monitoring all
aspects of the business. Powerful integrated CRM, PSA and ERP applications provide visibility throughout the entire quote-to-cash process to ensure prospects are fluidly converted into projects with flawless hand-offs between sales, service delivery and finance. The leaders in this survey continually monitor and measure financial metrics. They have the ability to make adjustments as
necessary, and don't wait too long before implementing changes. The importance of real-time financial
information cannot be overstated.
Table 7 shows the enviable financial results from this year’s Best-of-the-Best. They produced more than two times the
net profit (26% versus 12.2%) of average firms in the benchmark. This high level of profitability is
Table 6: Best-of-the-Best Comparison – Service Execution
Key Performance Indicator (KPI) Best Rest ▲ Average project size (in man months) 40.2 26.3 52% Effectiveness of resource management
process (1 to 5 scale) 4.36 3.55 23%
Projects canceled 1.5% 1.8% -17%
A standardized delivery methodology is
used 75.5% 65.7% 15%
Projects delivered on-time 87.7% 77.8% 13% Source: Service Performance Insight, May 2015
Table 7: Best-of-the-Best Comparison – Finance and Operations Key Performance Indicator (KPI) Best Rest ▲
EBITDA 26.0% 12.2% 112%
Average revenue per project (k) $203 $188 7% Annual revenue per employee (k) $210 $164 28% Annual revenue per billable consultant (k) $243 $194 25% Quarterly revenue target in backlog 62.7% 47.5% 32% Project margin for time & expense projects 50.9% 35.4% 44%
derived from larger projects, higher revenue per employee and consultant, with dramatically lower levels of revenue leakage and higher levels of backlog.
Leaders are more effective in sales and marketing, which translates to higher levels of backlog. Backlog is the fuel for growth as it allows firms to better plan and staff future projects while maintaining extremely high levels of billable utilization. High project, employee and consultant margins drop directly to the bottom line.
I
NTEGRATEDA
PPLICATIONSM
AKE THED
IFFERENCEService Performance Insight’s research has shown the highest performing
organizations excel in their use of integrated information
technology solutions. While most PS
organizations utilize financial management, CRM and PSA solutions to efficiently plan, sell and execute services, those that perform the best drive even better results through the integration of these core solutions.
“Quote-to-cash” is at the heart of the sales/delivery/finance process. It is a series of interrelated processes supported by CRM, PSA and ERP modules (Figure 5). To optimize these fundamental business processes, top performing PSOs rely on the integration of these essential business applications to provide
visibility, transparency and control. Although each of these
applications are offered on a stand-alone basis, the true power of managing the complete quote-to-profit business cycle is best
accomplished by an integrated suite of applications.
Table 8 shows the best
performing organizations have all invested in CRM and PSA. They also have much higher levels of PSA and ERP integration. These integration levels, coupled with the performance metrics in each pillar, highlight the importance of information visibility across the PSO. Ideally, this integration is automatic and the solutions share the same platform. This reduces the need for custom
integration, coding and costly updates.
Figure 4: Optimize the “Quote-to-Cash” Process
Source: Service Performance Insight, May 2015
Table 8: Best-of-the-Best Applications and Level of Integration Key Performance Indicator (KPI) Best Rest ▲
Organizations 11 209
Size of PS organization (employees) 160 294 -45% Use Client Relationship Management (CRM) 100.0% 86.7% 15% Use Professional Services Automation (PSA) 100.0% 80.5% 24% Use Human Capital Management (HCM) 55.6% 45.9% 21% Level of PSA and ERP Integration 69.5% 55.7% 25%
B
UYPSA
TOI
MPROVEP
ERFORMANCE,
I
NTEGRATEPSA
TOI
MPROVEP
ROFIT Stand-alone PSA increasesproject margins, which impacts profit. But the rewards are amplified when it is integrated with the organization’s financial management application. PSA and financial integration enhance visibility and management control, enriching the bottom-line. Information-sharing enables all relevant employees to better understand high-demand skills, cost, availability and
profitability. Recruiting and subcontracting can be turned on and off to ensure the right
resources with the right skills are available at the right time. Finance can ensure revenues and
costs are aligned while service delivery can focus on productivity and quality (Figure 5).Integration enhances visibility and makes the firm more focused and agile because decisions are based on real-time service performance, not intuition.
As Table 9 shows, PSOs that have integrated Professional Services Automation have more billable employees, with reduced administration overhead. They have larger pipelines and win more deals because they are focused on the right type of opportunities. Resources are aligned with the work resulting in higher levels of billable utilization and revenue per consultant. High levels of
productivity lead to profit.
B
EST-
OF-
THE-B
ESTC
ONCLUSIONSThe Best-of-the-Best professional services organizations invest in people, processes and integrated systems. More than average firms, they are truly passionate about building an exceptional
organization, not just for today, but for decades to come. They are willing to honestly look at themselves and the business and make changes to ensure they continue to be the premium firm. They focus on alignment from strategy to execution and have complete real-time visibility into all facets of their operations. They hire the best and keep them motivated with training and
compensation tied to measurable results.
Best-of-the-Best firms are increasingly turning to web-based application suites like NetSuite to displace legacy point solutions. Cloud-based integrated application suites lower the total cost of
Figure 5: Integrated PSA Helps Improve Profit
Source: Service Performance Insight, May 2015
Table 9: Integrated PSA Delivers Results
Key Performance Indicator (KPI) Without PSA Non-Int. PSA Integrated PSA
% of workforce that is billable 68.5% 76.1% 76.9%
Bid-to-win ratio (per 10 bids) 4.5 4.8 5.1
Deal pipeline compared to quarterly forecast 170% 206% 208%
Consultant billable utilization 67.4% 71.3% 72.0%
Annual revenue per billable consultant $188 $189 $205
EBITDA 8.2% 13.8% 14.4%
ownership and reduce time and cost spent on integration and upgrades while providing superior reporting and insight across functions. Top performers have a laser focus on execution and rely on integrated applications to provide real-time visibility.
Figure 6: What Sets the Best-of-the-Best Apart
Source: Service Performance Insight, May 2015 The Best-of-the-Best service providers in this year's survey showed superior results in all five Service Performance Pillars. They run lean, specialized and highly effective organizations with a focus on excellence. Because of their reputation for quality, they are able to land the best clients and recruit the top talent. They place an emphasis on success in all areas of their company, not just in one area. They play to win and know what success looks like.
Excellence is within the grasp of all PS organizations – but it takes hard work, determination, and investment in integrated business applications.
A
BOUTN
ETS
UITENetSuite is a leading provider of cloud-based business management software. NetSuite helps companies manage core business processes with a single, fully integrated system covering ERP/financials, CRM, professional services automation, ecommerce, inventory and more. More than 24,000 high-growth and mid-sized companies and divisions of large enterprises use NetSuite to run more effectively without the high costs and inefficiency of on-premise systems. By using NetSuite to automate operations, streamline processes and access real-time business information anytime, anywhere, growing businesses realize breakthrough performance improvements. Founded in 1998, NetSuite (NYSE: N) is headquartered in Silicon Valley with offices throughout the U.S., Canada, South America, Europe, Asia and Australia. Named by Gartner as the fastest-growing top 10 financial management solution, NetSuite has netted a number of prestigious CODiE Awards from the Software & Information Industry Association (SIIA) in recent years, including:
Best Project Management Solution: NetSuite OpenAir PSA Best Financial Management Software: NetSuite OneWorld Best Business Software System: NetSuite OneWorld Best Cloud Infrastructure Solution: NetSuite SuiteCloud Best Relationship Management System: NetSuite CRM
Service Performance Insight (SPI Research) is a global research, consulting and training organization dedicated to helping professional service organizations (PSOs) make quantum improvements in productivity and profit. In 2007, SPI developed the PS Maturity Model™ as a
strategic planning and management framework. It is now the industry-leading performance improvement tool used by over 10,000 service and project-oriented organizations to chart their course to service excellence.
SPI provides a unique depth of operating experience combined with unsurpassed analytic capability. We not only diagnose areas for improvement but also provide the business value of change. We then work collaboratively with our clients to create new management
About Service Performance Insight
R. David Hofferberth, PE,Service Performance Insight founder, managing director and licensed professional engineer has served as an industry analyst, market consultant and product director. He is focused on the services economy, especially productivity and technologies that help organizations perform at their highest capacity.
Dave’s background includes application and analytical tool development to support business decision-making processes. He has over 30 years of domestic and international experience with firms including the
Aberdeen Group and Oracle. Contact Hofferberth at david.hofferberth@spiresearch.com or 513-759-5443.
Jeanne Urich, Service Performance Insight managing director, is a management consultant specializing in improvement and
transformation for project- and service-oriented organizations. She has been a corporate officer and leader of the worldwide service
organizations of Vignette, Blue Martini and Clarify, responsible for leading the growth of their professional services, education, account management and alliances organizations.
Jeanne is a world-renowned thought-leader, speaker and author on all aspects of Professional Services. Contact Urich at