
Financing Firms in India
∗Franklin Allen Rajesh Chakrabarti Sankar De
Finance Department Finance Area Centre for Analytical Finance The Wharton School College of Management Indian School of Business University of Pennsylvania Georgia Institute of Technology Hyderabad 500 019, India [email protected] [email protected] [email protected]
Jun “QJ” Qian Meijun Qian
Finance Department Finance Department
Carroll School of Management Carroll School of Management
Boston College Boston College
[email protected] [email protected]
Abstract
We examine the legal and business environments, financing channels and governance mechanisms of various types of firms in India, and compare them to those from other countries. Despite its English common-law origin, strong legal protection provided by the common-law and a democratic government, corruption within India’s legal system and government significantly weakens investor protection in practice. External financing of firms has been dominated by non-market sources of financing, while the characteristics of listed firms are similar to those from countries with weak investor protection. Our evidence, including results based on a survey of small- and medium-scale private firms, shows that alternative financing channels provide the most important source of funds. We also find that informal governance mechanisms, such as those based on reputation, trust and
relationships, are more important than formal mechanisms (e.g., courts) in resolving disputes, overcoming corruption and supporting growth.
Keywords: India, law and finance, institutions, informal mechanisms, SME sector. JEL Classifications: O5; K0; G0
World Bank Policy Research Working Paper 3975, August 2006
The Policy Research Working Paper Series disseminates the findings of work in progress to encourage the exchange of ideas about development issues. An objective of the series is to get the findings out quickly, even if the presentations are less than fully polished. The papers carry the names of the authors and should be cited accordingly. The findings,
interpretations, and conclusions expressed in this paper are entirely those of the authors. They do not necessarily represent the view of the World Bank, its Executive Directors, or the countries they represent. Policy Research Working Papers are available online at http://econ.worldbank.org.
∗ We appreciate helpful comments from Asli Demirgüç-Kunt, Mihir Desai, Nandini Gupta, Ravi Jagannathan, Rohan
Williamson, Marc Zenner, and seminar/session participants at the Chinese University of Hong Kong, Stockholm School of Economics, Gothenberg University, Wharton and the Darden-World Bank conference on emerging markets. For assistance with collecting financial data and conducting firm surveys, we wish to thank Sankar De’s associates at the Centre for Analytical Finance (CAF), Indian School of Business. Gaurav Khurana and Narender Khurana contributed to our survey work in New Delhi. Deepika Luke (CAF) and Richard Fu (Georgia Tech) provided extensive research assistance, and P. G. Shinde (Centre for Monitoring Indian Economy) contributed economic and financial data. Sankar De gratefully
acknowledges financial support from the Goldman Sachs Foundation, and the other authors thank their respective institutions and the Wharton Financial Institutions Center for financial support.
WPS3975
Public Disclosure Authorized
Public Disclosure Authorized
Public Disclosure Authorized
I. Introduction
Understanding mechanisms that contribute to sustainable long-term growth has long been
one of the central missions for economists. In recent years, several related strands of literature in
law, finance and economic growth have significantly advanced our knowledge of growth
mechanisms. First, based on large samples of cross-country studies, the law and finance literature
(pioneered by La Porta, Lopez-de-Silanes, Shleifer, and Vishny 1998; LLSV hereafter) finds that
stronger legal protection of investors is associated with more efficient institutions and better
financial and economic ‘outcomes’.1 The second strand of literature champions the view that the development of a financial system that includes a stock market and intermediation contributes to a
country’s overall economic growth (e.g., McKinnon, 1973).2 The third strand of literature provides evidence for the link among law, finance, and growth at the country, industry, and firm level (e.g.,
Demirgüç-Kunt and Maksimovic, 1998; Levine, 1999; Beck and Levine, 2002).
Despite the connections from legal origin to institutions to financial and economic outcomes,
much less is known about the causality of these links. For example, time series evidence on
financial development has challenged some of the correlations documented by LLSV (e.g., Rajan
and Zingales 2003a), while the cost of improving the legal system can be prohibitively high for
emerging countries.3 Proponents of institutional development argue that, instead of a country’s legal origin, the country’s institutions, in particular, those political economy institutions restraining the
government and powerful elites, determine the country’s long-run economic growth (e.g., Rajan and
Zingales 2003b; Acemoglu and Johnson 2005).
In a recent paper, Allen, Qian and Qian (2005, hereafter AQQ) demonstrate that China
1 LLSV (1998) find that countries with the English common-law origin provide the strongest legal protection to both shareholders and creditors, while countries with the French civil-law origin provide the weakest.
2 Recently, researchers have strengthened this view by presenting supporting empirical evidence at the country level (e.g., King and Levine, 1993; Levine and Zervos, 1998), as well as at the industry and firm level (e.g., Rajan and Zingales, 1998; Jayaratne and Strahan, 1996).
3 For example, Djankov, McLiesh, and Shleifer (hereafter DMS, 2005) find that, despite apparent significant economic benefits from reform, there is very little time variation of creditor rights over the past twenty-five years around the globe.
2
provides a significant counterexample to the findings in the law, institutions, finance and growth
literature. Despite its poor legal and financial systems and a corrupt and autocratic government,
China has (in Purchasing Power Parity (PPP) terms) one of the largest and fastest growing
economies. Moreover, AQQ document that alternative financing channels and informal governance
mechanisms have substituted for formal channels and mechanisms to support corporate as well as
overall economic growth in China.4
In this paper, we examine the second largest emerging economy in the world, India. At the
end of 2005, with a population of almost 1.1 billion (second largest behind China), India already has
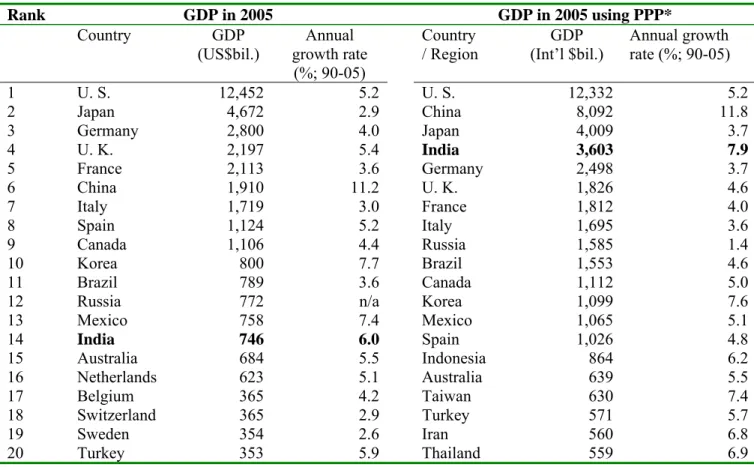
the world’s fourth largest economy measured in PPP terms (Table 1-A). During the period 1990 to
2005, India’s GDP (in PPP terms) had an annual growth rate of 7.9%, second highest among the
world’s largest economies. With India’s English common-law origin, the legal protection of
investors provided by the law is one of the strongest in the world. However, widespread corruption
within India’s legal system and government significantly weakens legal protection in practice. We
find that formal external financing for firms has been dominated by non-market sources of funds in
India, while listed firms behave more like those from countries with weak investor protection. Our
evidence, including results based on a survey of small- and medium-scale (private) firms,
demonstrates that alternative financing channels provide the most important source of funds. Our
survey evidence also shows that entrepreneurs and investors rely more on informal governance
mechanisms, such as those based on reputation, trust and relationships, than formal mechanisms to
resolve disputes, overcome corruption and finance corporate growth.
Our results, along with the findings of AQQ (2005) on China, illustrate that alternative
financing channels and informal governance mechanisms, rather than legal protection and political
4 The literature on economies of transition (from Socialist, central planning systems to market-based economies) also documents the important role of alternative mechanisms in promoting the development of markets and institutions (e.g., McMillan, 1997; McMillan and Woodruff, 2002).
3
institutions (e.g., lack of government corruption) documented in most of the existing literature, have
supported the growth of non-government firms in these two countries. As of 2005, they have a
combined population of 40% of the entire world, and their combined GDPs (in PPP terms) are
almost as large as that of the U.S. and equal to 19% of the world total. Given the status of these two
countries, our findings call for more research in order to better understand whether similar
“substitute” mechanisms that have worked well in China and India have also supported the growth
of firms in other economies where formal mechanisms are not available.
We first find that India, a long-time British colony, has the best investor protection on paper.
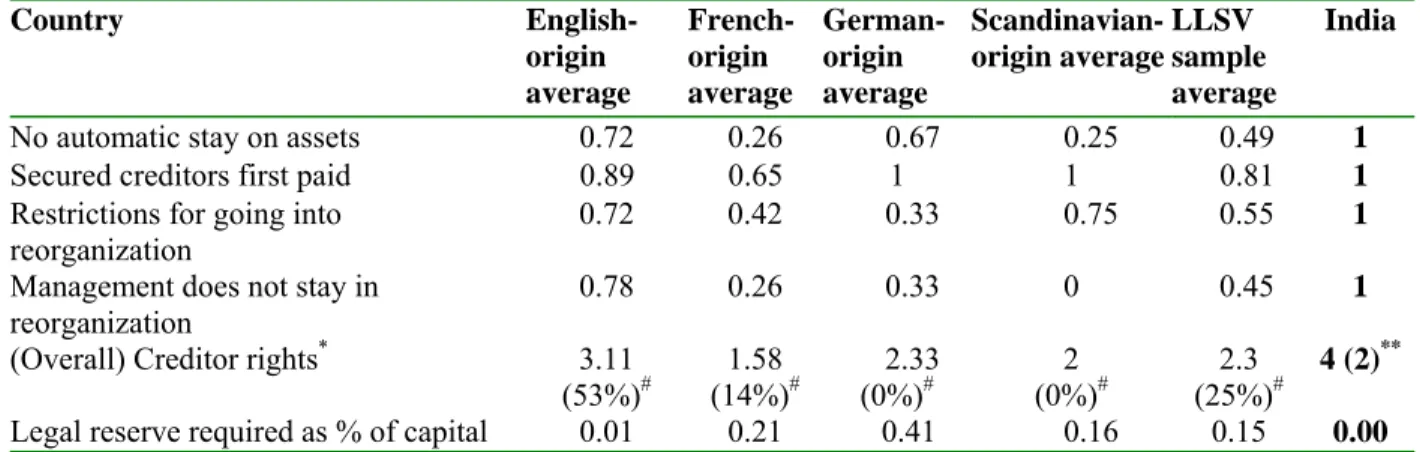
India has a perfect score on the Creditor Rights index (4 out of 4),5 and scores 5 out of 6 for the Anti-Director Rights index, the highest among more than 100 countries studied in Djankov, La
Porta, Lopez-de-Silanes, and Shleifer (2005; hereafter DLLS). Moreover, India has had a
British-style judicial system and a democratic government for a long time. However, wide-spread
government corruption and overburdened courts lead to poor legal protection in practice.6 Perhaps not surprisingly, India’s stock market has not played a dominant role in resource allocation and
providing external financing to firms. External financing through financial markets (equity and
bond) has been dominated by banking and alternative sources, although the size and importance of
the stock markets have grown significantly in recent years. Since the deregulation and financial
liberalizations in the early 1990s, the entry and competition from non-state owned banks have
stimulated the growth of the banking sector, which has maintained a low level of non-performing
loans (NPLs) and a high level of efficiency in part due to stringent lending standards.
We next separately examine financing channels, corporate governance, and the growth of
three groups of firms. First, the importance of the state sector (public sector undertakings, or PSUs)
5 This score was revised from 4/4 in LLSV (1998), which was based on the Company’s Act (1956), to 2/4 in DMS (2005), which was based on the Sick Industrial Companies Act (1985).
6 DLLS (2005) construct the anti-self-dealing index (control of corporate insiders) for more than 100 countries. India’s score of 0.55 (out of 1) is lower than the average (0.67) of English common-law countries.
4
in the economy has been decreasing relative to non-state sectors, even though as a group PSUs have
been growing at comparable rates to the non-state sector. The reason is there is an ongoing
privatization process in the state sector, including selected PSUs being publicly listed. Second, our
empirical results on listed firms of the non-state sector are based on a sample of more than 850 firms
over the period 1995 - 2004. We find that the equity ownership is highly concentrated within the
founder’s family and/or the controlling shareholder. These findings are similar to those for other
Asian countries (e.g., Claessens, Djankov and Lang 2000; Claessens, Djankov, Fan, and Lang 2002).
When compared to listed firms studied in LLSV (2000b, 2002), both the dividend ratio and valuation
of Indian firms are much lower compared to similar firms operating in countries with strong investor
protection, but similar to those listed firms in countries with weak protection.
More interesting results are found for the non-state, non-listed firms, and in particular, small-
and medium-sized firms. These firms have grown faster than the rest of the economy during the past
15 years, while the financing of this sector is clearly different from the state and listed firms. Due to
the lack of publicly available firm-level data, our evidence, by necessity, is mainly based on a survey
of 213entrepreneurs and executives of firms located in and around the southern Indian city of
Hyderabad (76 firms) and the Delhi-Gurgaon area of northern India (136 firms). Our survey firms
operate in manufacturing industries with firms ranging in age from less than a year to 85 years (the
median is 21 years). These firms employ two to 350 workers (the median is ten).
In about 85% of the firms surveyed, the largest owner is the founder’s family, while over half
of the firms have unlimited liability. When asked how the owners (with unlimited liability) would
protect their personal assets in case of business failure, 151 out of 157 respondents would negotiate
with lenders for an extension; only 22 respondents said they would also file personal bankruptcy.
The three most important financing channels for these firms during their start-up and growth periods
state-5
owned banks and banks specialized in lending to small- and medium-sized firms (e.g. the Small
Industry Development Bank of India, or SIDBI, and State Financial Corporations, or SFCs).
However, credit availability is not uniform across the surveyed firms, and the market for bank credit
is clearly relationship-driven. Over 70% of the respondents said that their firms had to meet
operating/profitability criterion to obtain their largest loans, while the median “monitoring”
frequency of the banks (bank staff contacting borrower about the loan) is once per quarter.
We also find that informal governance mechanisms based on trust, reputation and
relationships are much more important than legal remedies in resolving disputes and enforcing
contracts. For example, when asked about the consequences of delay of (or non-)payments and
breach of contracts, the respondents ranked loss of future business opportunities, reputation and
personal assets as main concerns, while fear of legal remedies was the least important. When asked
who would be the best mediator for disputes (multiple choices allowed), 46% of the respondents
specify “mutual friends and business partners” and 26% specify a non-government organization like
a trade association as their choice, and only 20% of respondents choose “going to courts.” When
asked how a firm ensures payments, 53% of the respondents screen their business partners carefully
so that such issues do not occur, while 59% said they would go to courts but would leave negotiation
possibilities open. Finally, when asked about government regulatory authorities (e.g., obtaining a
license to start a business), our survey indicate corruption is part of doing business. The two most
common methods to overcome corruption are bribes and using friends of government officials.
Our paper extends the literature on law, institutions, finance and growth. Many
cross-country studies focus on one or two dimensions of a cross-country’s legal and financial systems, and treat
each country in their sample on an equal-weight basis. We might expect that, compared to large and
diverse countries (e.g., India and China), small homogeneous economies (e.g., Hong Kong and
6
these countries’ needs at low costs.7 By contrast, this paper studies all aspects of the financial system in the second largest developing country and finds that many results based on existing
cross-country studies to a large degree do not apply to India. Our paper thus complements cross-cross-country
studies, and can further advance the understanding of growth mechanisms.
We also utilize surveys to examine small- and medium-scale private firms, which is one of
the most vibrant corporate sectors in India. Survey-based research has made significant
contributions to the law, institutions, finance and growth literature.8 In particular, the World Bank has carried out a series of country- and firm-level surveys on the business environment in more than
80 countries, including both India and China (e.g., Cull and Xu 2005). Our survey differs from the
World Bank surveys in two ways. First, the main goal of the World Bank surveys is to examine the
degree of “convergence” of institutional development in emerging countries toward institutions in
developed countries (in particular, the U.S.), while our goal is to uncover and analyze factors that
can be effective for extended periods in supporting firm- and economy-wide growth. Second, our
surveys provide the most comprehensive and detailed information on all the financing channels
(standard and alternative) and governance mechanisms (formal and informal) at different stages of
non-state, non-listed firms, which have been generally overlooked in the literature.
The rest of the paper is organized as follows. Section II provides background information on
India, and Section III describes the size and growth of the different sectors of the Indian economy.
In Section IV, we examine the financing patterns, valuation, and dividend policies of firms in the
Listed Sector. Section V presents our survey results of small- and medium-scale firms. Finally,
Section VI concludes. Appendix A contains the explanations of all the variables used in the paper.
7 Moreover, Stulz (2005) argues that there are limits to globalization, including the improvement of institutions, due to a “twin” agency problem of governments and corporate insiders in emerging countries.
8 For example, DLLS (2003) conduct worldwide surveys on the efficiency of judicial systems, while Johnson, McMillan, and Woodruff (2002) conduct firm-level surveys in economies of transition on property rights and finance.
7 II. India: An Overview
Home to the second largest population in the world (1.08 billion as of 2004), India currently
has the fourth largest economy in PPP terms, and is closing in at the heels of the third largest
economy, Japan (Table 1-A). The largest democracy in the world with a press as free and vocal as
anywhere else, it is relatively conservative in social mores by Western standards and considerably
more so in rural areas where over 70% of the population resides. The birthplace of at least three
major religions, India is replete with Buddhist, Islamic and Western influences though Hinduism is
the dominant faith today. With 25 major languages and over a hundred dialects, India defies
generalizations. An illiteracy rate of 35% co-exists with a crowd of information technology
professionals and a young English-speaking urban workforce competing for service sector jobs with
their U.S. counterparts. Despite its rising economic might, a third of its population languishes in
terrible poverty. In short, India is as large and diverse as any other country in the world. Table 1-B
provides a snapshot of India’s socio-economic conditions.
II.1 The Indian Economy – A Historical Perspective
At independence from the British in 1947, India inherited one of the world’s poorest
economies (the manufacturing sector accounted for only one-tenth of the national product), but also
one with arguably the best formal financial markets in the developing world. It had four functioning
stock exchanges (the oldest one predating the Tokyo Stock Exchange) with clearly defined rules
governing listing, trading and settlements; a well-developed equity culture if only among the urban
rich; and a banking system with well-developed lending norms and recovery procedures. In terms of
corporate laws and financial system, India emerged far better endowed than most other erstwhile
colonies. The 1956 Indian Companies Act, as well as other laws governing the functioning of
8
Corporate development in India had begun with the managing agency system. It led to more
dispersed equity ownership but also gave rise to the practice of management enjoying control rights
disproportionately greater than their stock ownership.9 India’s turn towards socialism after
independence put in place a regime and culture of licensing, protection and widespread red-tape that
bred corruption and stilted the growth of corporate sectors. Heavy industries and strategic sectors
were off-limits for private enterprise – the state had to control the “commanding heights” of the
economy. Two rounds of nationalization brought about 90% of the banking sector under
government control. On the other hand, to promote employment as well as to pay homage to
Mahatma Gandhi’s vision of village self-sufficiency, India restricted several areas for the “small
scale sector”, where individual businesses could not grow beyond a certain size. Formal non-state
enterprises, such as joint-stock corporations, were severely restricted to a middle area between these
two sectors, subject to the “License Raj” where government permission was required for an
unending and ever-increasing list of business decisions. Corruption, nepotism and inefficiency
became the hallmarks of the Indian corporate sectors. Exorbitant tax rates encouraged creative
accounting practices and complicated compensation structures designed to beat the system.
The economy reached the end of this road in 1990-91 with a severe balance of payments
crisis, threatening a default in India’s foreign debt payments. While some reforms (more
“business-friendly”) had begun in the early and mid-1980s, this crisis, and the conditions imposed by the IMF
assistance package that followed, ushered in an era of reforms. As in many other countries around
the globe, this constituted deregulation, liberalization of the external sector and partial privatization
of some of the state sector enterprises. In many ways the reforms that started in 1991 have
transformed the economy through the twin forces of globalization and competition.
9 The Managing Agency System was a corporate governance system that existed in British India, where the Board of Directors would hire a "Managing Agency" to run the company. These agencies often ran companies in various industries and practically controlled massive conglomerates. The system was abolished in 1970.
9
For over three decades after independence, India grew at an average rate of 3.5% (infamously
labeled “the Hindu rate of growth”) and then accelerated to an average of about 5.6% since the
1980s. As we have seen in Table 1-A, the annual growth rate of 7.9% during 1990-2005 is the
second highest among the world’s largest economies, behind only China’s 11.8%.
In 2004, 52% of India’s GDP was generated in the services sector, while manufacturing
(agriculture) produced 26% (22%) of GDP. In terms of employment, however, agriculture accounts
for about two-thirds of the half a billion labor force, indicating both poor productivity and
widespread underemployment. Over 90% of the labor force works in the “unorganized sector.”10
II.2 Law, Institutions and Business Environment
The most striking fact about India’s legal system is the difference between protection of
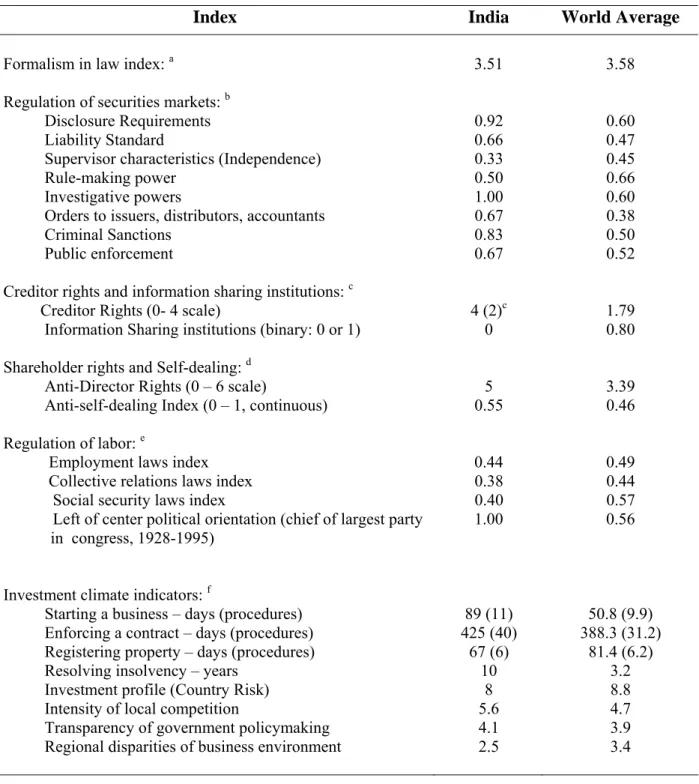
investors by law as opposed to protection in practice. Table 2 (panels A through E) compares
India’s scores relative to the world, different legal-origin country groups, and other emerging
markets on several different dimensions of law and institutions. As discussed above, with the
English common-law system, India has strong protection of investors “on paper”: The scores on
both creditor rights (Table 2-B, with a score of 4/4 in LLSV (1998), based on the Company’s Act of
1956, to 2/4 in DMS (2005), based on the Sick Industrial Companies Act of 1985) and shareholder
rights (5/6 in Table 2-C) are the highest of any country in the world.
Table 2-D compares law enforcement and the quality of institutions in India and LLSV
countries, while Table 2-E provides similar comparisons among major emerging economies. We did
not use the measures from LLSV (1998) because they are dated and do not accurately capture the
current protection of investors in India. We employ four sets of up-to-date and widely used
measures for our purpose. First, the legal formalism (DLLS 2003) index, based on extensive surveys
10 According to the official definition, the unorganized sector is comprised of: 1) all the enterprises except units registered under Section 2m(i) and 2m(ii) of the Factories Act, 1948, and Bidi and Cigar Workers (condition of employment) Act, 1966; and 2) all enterprises except those run by the government (central, state and local bodies) or Public Sector Enterprises.
10
of lawyers and judges, measures how efficiently the courts of a country enforce contracts. DLLS
have constructed measures based on how courts handle two types of cases: Collection of a bounced
check, and eviction of a (non-paying) tenant. A higher score in either category implies that the court
system is slower (with more bureaucracy) and less efficient. We took the average of these (highly
positively correlated) indexes to construct a single formalism index. From Table 2-D, India’s has a
higher formalism index than the average of English origin countries, and is only lower than that of
the French origin countries.
Second, measures on government corruption used in Tables 2-D and 2-E come from
Transparency International’s survey-based annual reports, which provide the most comprehensive
examination of corruption within the government and legal institutions around the world. Based on
its 2005 Corruption Perception Index, India has a score of 2.9 out of 10 (a higher score means less
corruption), which ranked 88th out of 140 countries (with the range of scores from 1.5 to 9.7). In the
2003 survey, India had a score of 2.8/10 and ranked 95th out of 145 countries. From Table 2-E,
India’s corruption score is below that of China, Brazil and Mexico, all of which have much weaker
legal protection of investors, and is only ahead of Pakistan (Argentina has a score of 2.8).11 Further, in its survey of investment climates around the world, the World Bank (World Development Report
2005) found that corruption was the number one constraint for firms in South Asia. Another survey by the same organization, “Corruption in South Asia in 2002” found that the two most corrupt public
institutions identified by the respondents in India (as well as in most countries in South Asia) were
the police and the judiciary.
Third, we have two measures for the quality of accounting systems. The disclosure
requirements index (from 0 to 1, higher score means more disclosure; LLS 2006) measures the
extent to which listed firms have to disclose their ownership structure, business operations and
11 For more information on the cross-country and time series of corruption scores, go to the website of Transparency International http://www.transparency.org/publications/annual_report.
11
corporate governance mechanisms to legal authorities and the public. India’s score of 0.92 is higher
than the averages of all LLSV subgroups of countries, including the English origin countries,
suggesting that Indian firms must disclose a large amount of information. However, this does not
imply the quality of disclosure is also good. In terms of the degree of earnings management (higher
score means more earnings management; Leuz, Nanda and Wysocki 2003), India’s score is much
higher than the average of English origin countries, and is only lower than the German origin
countries, suggesting that investors have a difficult time in evaluating Indian companies based on
publicly available reports.
The fourth and last category of Table 2-D is the legality index, a composite measure of the
effectiveness of a country’s legal institutions. It is based on the weighted average of five categories
of the quality of legal institutions and government in the country (see Berkowitz, Pistor and Richard
2003). Consistent with other measures, India’s score is lower than the averages of all the subgroups
of LLSV countries, suggesting that India’s legal institutions are less effective than those of many
countries, and that it will be more difficult for India to adopt and enforce new legal rules and
regulations than other countries.
Finally, as for the business environment in India, a recent World Bank survey found that,
among the top ten obstacles to Indian businesses, the three which the firms surveyed considered to
be a “major” or “very severe” obstacle and exceeding the world average are corruption (the most
important problem), availability of electricity, and labor regulations. Threat of nationalization or
direct government intervention in business is no longer a major issue in India. With rampant tax
evasion, the shadow economy in India is significant. It is estimated to be about 23% of GDP.12 In keeping with its socialist moorings during the first three decades after independence, India created a
12This figure is 22.4% according to Schneider and Enste (2000), and 23.1% by Schneider (2002) (World Bank). Popular
perception, however, would put it significantly larger, particularly given that the average figure of OECD countries themselves is about 12%.
12
panoply of laws as well as government departments to monitor and control the private sector on the
one hand, and to promote and finance small enterprises through government assistance on the other.
Creditor and investor rights were largely unprotected in practice, with banks having little bargaining
power against willful defaulters. Large corporate houses often got away with default, or got poor
projects financed through the state-owned banking sector, often by using connections with
influential politicians and bureaucrats.
To summarize, despite strong protection provided by the law, legal protection is considerably
weakened in practice due to an inefficient judicial system, characterized by overburdened courts,
slow judicial process, and widespread corruption within the legal system and government.
II.3 The Financial Sector
Despite the history of India’s stock markets and large number of listed firms, the size and
role in terms of allocating resources of the markets are dominated by those of the banking sector,
similar to many other emerging economies. From Table 3-A, total bank deposits (of over $385
billion dollars) are equivalent to 50% of GDP in 2003, and constitute three-quarters of the country’s
total financial assets. The efficiency of the banking sector, measured by the concentration and
overhead costs, is ahead of the world average. On the other hand, total capitalization of the stock
market is 34% of GDP, while the size of the (private) corporate bond market is miniscule.
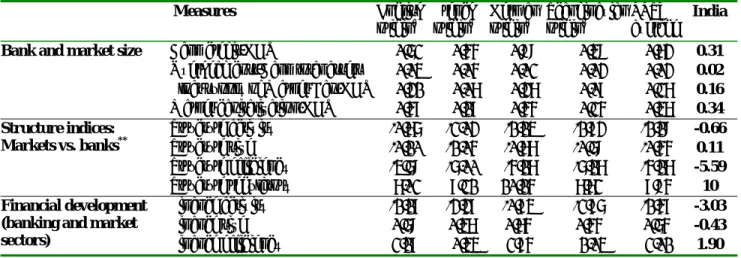
In Table 3-B we compare India’s financial system (2003 figures) to those of the
LLSV-sample countries (LLSV, 1997a, 1998), using measures from Levine (2002). In terms of the size
(bank private credit over GDP), India’s banking sector is much smaller than the (value-weighted)
average of LLSV sample countries, even though its efficiency (overhead cost as fraction of total
banking assets) compares favorably to most countries. The size of India’s stock market, measured
by the total market capitalization as fraction of GDP, is actually slightly larger than that of the
13
“floating supply” of the market, or the tradable fraction of the total market capitalization, India’s
stock market is only half of its banking sector.13 “Structure activity” and “Structure size” measure whether a financial system is dominated by the market or banks. India’s activity (size) figure is
below (above) even the average of English origin countries, suggesting that India has a
market-dominated system; but this is mainly due to the small amount of bank private credit (relative to
GDP) rather than the size of the stock market. In terms of relative efficiency (“Structure efficiency”)
of the market vs. banks, India’s banks are much more efficient than the market (due to the low
overhead cost), and this dominance of banks over market is stronger in India than for the average
level of LLSV countries. Finally, in terms of the development of the financial system, including
both banks and markets, we find that India’s overall financial market size (“Finance activity” and
“Finance size”) is much smaller than the LLSV-sample average level. Overall, based on the above
evidence, we can conclude that both India’s stock market and banking sector are small relative to the
size of its economy, and the financial system is dominated by an efficient (low overhead cost) but
significantly under-utilized (in terms of lending to non-state sectors) banking sector.
Financial Markets
The number of India’s stock exchanges has grown from four at Independence (1947) to 23
today. India also boasts the largest number of listed companies in the world – well over 10,000.
However, the equity markets were not important as a source of funding for the non-state sector until
as recently as the early 1980s. Before then, the Indian capital markets were a closed club of brokers
with few primary market offerings and little trade and marginal participation of the common public,
a state of affairs caused mostly by the lack of transparency in Indian businesses and little protection
of minority shareholders. The ratio of India’s market capitalization to GDP rose from about 3.5% in
13 We estimate that 45% of the total market capitalization of listed firms is actively traded in India, and hence a value traded/GDP ratio of 0.16. The float supply figure of 45% is based on our own calculation of free float adjustment factor of about 1,000 large firms listed on the BSE (small firms are less frequently traded than large firms).
14
the early 1980’s to over 34% in 2003, which ranks 41st among 89 countries (Table 3-A).
However, the situation has changed considerably in recent years: Since the middle of 2003
through the first quarter of 2006, Indian stock prices have appreciated rapidly, with the popular
Sensex index rising from about 3000 to over 10,000 in a period of less than three years. In fact, as
shown in Figure 1, the rise of the Indian equity market in this period allowed investors to earn a
higher return (“buy and hold return”) from investing in the Mumbai Stock Exchange (formerly the
Bombay Stock Exchange, or BSE) Index than from investing in the S&P 500 Index and other indices
in the U.K., China, and Japan during the period 1992-2005. Many credit the continuing reforms and
more or less steady growth as well as increasing foreign direct and portfolio investment in the
country for this explosion in share values.14
Table 3-C shows the comparative position of the two major Indian exchanges (the
NYSE-type “floor exchange”, the BSE, and the NASDAQ-NYSE-type electronic exchange, National Stock
Exchange, (NSE)) vis-à-vis other major exchanges in the world. At the end of 2004, BSE was the
sixteenth largest stock market in the world in terms of market capitalization, while NSE ranked next
at seventeenth. Table 3-C also shows that trading in the BSE is the most concentrated among the
largest exchanges in the world, with the top 5% of companies (in terms of market capitalization)
accounting for close to 90% of all trades, but the (share) turnover velocity of BSE (43.1% for the
year) is much lower than that of exchanges with similar concentration ratios. These results are
consistent with our prior conclusion that the majority of shares in the BSE are not frequently traded.
By contrast, the trading patterns at the NSE are similar to those of NASDAQ with more stocks
actively and frequently traded (lower concentration ratio and higher turnover velocity).15
14 According to the Reserve Bank of India’s
Handbook of Indian Statistics, both foreign direct investment and portfolio
investment (in stocks and bonds) have been growing fast during the past 15 years, with the latter twice the size of the former. The cumulative foreign investment inflows equals 11.58% of GDP in 2005, as compared to 0.03% in 1990. 15 Morck et al. (2000) find that stock prices are more synchronous in emerging countries than in developed countries. They contribute this phenomenon to poor minority investor protection and imperfect regulation of markets in emerging
15
In 2004-05, non-government Indian companies raised about 2.7 billion USD from the market
through the issue of common stock, and US$378 million by selling bonds/debentures (no preferred
shares were issued). Despite the size of the new issuance, Indian’s financial markets, relative to the
size of its economy and population, are much smaller than those in many other countries. Table 3-D
presents a comparison of external markets (stock and bonds) in India and different country groups
(by legal origin) using measures from LLSV (1997a). Figure 2 plots the size and depth of a
country’s external markets vs. the degree of protection of investors based on data in Table 3-D. The
horizontal axis measures overall investor protection (protection provided by the law, rule of law, and
government corruption) in each country, while the vertical axis measures the (relative) size and
efficiency of that country’s external markets.16 Most countries with English common-law systems (French civil-law systems) lie in the top-right region (bottom-left region) of the graph. India is
located in the south-eastern region of the graph with relatively strong legal protection (in particular,
protection provided by law) but relatively small financial markets.
Banking Sector
Over the decades, India’s banking sector has grown steadily in size, measured in terms of
total deposits, at a fairly uniform average annual growth rate of about 18%. There are about 100
commercial banks in operation with about 30 state owned banks, about 30 private sector banks and
over 40 foreign banks. Still massively dominated by state-owned banks (they account for over 80%
of deposits and assets), the years since liberalization have seen the emergence of new private sector
banks as well as the entry of several new foreign banks. This has resulted in a much lower
concentration ratio in India than in other emerging economies (Table 3-A, and Demirgüç-Kunt and markets. While stock prices in India co-move less frequently than those in China (one of the worst in the world), they are much more synchronous than those in the developed markets such as the U.S.
16 Following LLSV, the score on the horizontal axis is the sum of (overall) creditor rights, shareholder rights, rule of law, and government corruption. The score of the vertical axis indicates the distance of a country’s overall external markets score (external cap/GNP, domestic firms/Pop, IPOs/Pop, Debt/GNP, and Log GNP) to the mean of all countries, with a positive (negative) figure indicating that this country’s overall score is higher (lower) than the mean.
16
Levine 2001). Competition has clearly increased with the Herfindahl index (a measure of
concentration) for advances and assets dropping by over 28% and about 20% respectively between
1991-1992 and 2000-2001 (Koeva 2003). Within a decade of its formation, a private bank, the
ICICI Bank has become the second largest bank in India.
While the problem of NPLs does exist for some public sector banks (also a “new” private
sector bank almost collapsed in 2003 when it was bailed out by merging with another bank),
compared to most Asian countries the Indian banking system has done better in managing this
problem. The “healthy” status of the Indian banking system is in part due to its high standards in
selecting borrowers (in fact, many firms complained about the stringent standards and lack of
sufficient funding), though there is some concern about “ever-greening” of loans to avoid being
categorized as NPLs. Table 3-E provides comparative statistics on this issue. In terms of
profitability, Indian banks have also performed well compared to the banking sector in other Asian
economies, as the returns to bank assets and equity in Table 3-F convey.
We close this section by emphasizing three facts about the Indian society and economy.
First, a large and diverse country, India has had recent success in its overall economic development.
Second, despite strong investor protection purportedly provided by the law, actual protection is weak
in India owing to the inefficiency of legal institutions and corruption. Third, despite the
development and growth of India’s financial system (both banking sector and markets), its size is
small relative to the economy while its roles of resource allocation and provider of external
financing are expected to become much more important in the near future.
III. Aggregate Evidence on India’s Corporate Sectors: Organization, Financing and Growth Since Independence India has sought to follow a “mixed economy” model with co-existing
state and non-state sectors. In reality, the next four decades saw the widening and strengthening of
17
including limits to investment and industrial licensing. During the last decade and a half of
liberalization, initiated in 1992, the non-state sectors have gained some long-overdue momentum.
Before we compare the scale and growth of various sectors, some clarifications on the definitions of
corporate sectors are in order. First, the state sector comprises of PSUs, in which the government
has majority (at least 50%) ownership and control. Second, the Companies Act (1956) of India
defines a ‘public’ company as a (non-state) company that has a minimum paid-up capital of Indian
rupees (Rs.) 500,000 (US$ 11,100) and more than 50 shareholders. A fraction of the 76,621 public
companies (more than 10,000) are listed and publicly traded on one or more of the exchanges.
Third, the rest of the (smaller) registered, non-state companies with less than 50 shareholders are
called ‘private’ companies. Finally, there is the unorganized sector that consists of firms that are not
PSUs, public or private companies.
A focus of our paper is small- and medium-scale private firms.17 The official definition of a firm in the Small and Medium Enterprises (SME) sector is one that has investments in fixed assets of
plant and machinery less than Rs. 50 million (US$ 1.11 million, at original cost). The SME sector
includes the Small Scale Industry (SSI) sector, where a (mostly manufacturing) firm has fixed assets
less than Rs. 10 million (US$ 222,000), and the medium sector, where firms’ fixed assets range from
Rs. 10 to 50 million. Largely to create greater employment since independence, the government has
sought to “protect” certain industries from large scale, capital intensive companies by establishing
investment limits to define this sector. For example, the production of certain products is
exclusively reserved for the SSI units.18 Non-manufacturing small enterprises with less than Rs. 1
17 The importance of small and medium private firms is hardly unique to India -- high-growth economies are typically marked by such a vibrant sector. Using a sample of 76 countries (India not included), Beck et al. (2005) find a strong association between the importance of SMEs and GDP per capita growth. However, they are not able to establish that SMEs exert a causal impact on growth or poverty reduction.
18 Currently the production of 506 items, most of which are consumer products and food, are reserved exclusively for SSIs. For a complete list, visit this website: http://www.smallindustryindia.com/publications/reserveditems/resvex.htm.
18
million (US$ 22,000) investment in plant and machinery are classified as the Small Scale Service
and Business Enterprises (SSSBE).
Table 4 presents comparisons of state and non-state sectors during the period 1990-2003.
Within the non-state sectors we focus on the sector of public and private companies (non-state
corporations) and the SSI Sector, a subset of the SME sector. First, in terms of the size of the labor
force, the SSI dominates the other sectors: With an annual growth rate of almost 4%, the size of the
labor force in the SSI sector as of 2003 was 19.97 million as compared to 8.50 million for the state
sector. In fact, the actual employment number in small firms is actually much larger than the
reported figure of 19.97 million, which does not include all the (non-agriculture) firms and their
employees in the unorganized sector (as explained above, firms in the unorganized sector are not
PSUs, public or private companies). Second, in terms of the size and growth of the output of the
sectors, we can see that all sectors have been growing fast, while the annual growth rate of output in
the SSI sector (9.8%; data on the output of all firms in the non-state sectors not available) is higher
than that of the state-sector (8.5%). In terms of contribution to GDP, the size of the state-sector
(excluding government spending) has been around one fifth of the non-state sectors (excluding
agriculture) during 1990-2003.19 Third, in terms of fund raising and investment, non-state sectors have also been growing faster than the state sector. During 1990-2003, total paid-up capital in the
state sector grew at an annual rate of 3.37%, with its share in the total declining from 73% to 28%.
By contrast, paid-up capital in non-state corporations (including listed firms) has been growing at an
annual rate of 21.51%.20
19 Among non-state sectors, we find that firms operating in the services industries (e.g., commerce & hotels, community & business services) had surpassed traditional manufacturing industries in terms of number of units and investments. 20 Paid-up capital is the actual amount that investors have paid for the share capital (excluding retained earnings), and equals to the sum of face value and share premium. For PSUs, equity investors include the government and non-government investors, while for non-state (public and private) firms paid-up capital includes equity capital raised from the stock market (for listed firms) and private equity.
19
Table 5 provides evidence on the sources of (new) funds for non-financial Indian firms
during the 14-year period of 1991-2004, based on the Prowess database of the Centre for Monitoring
the Indian Economy (CMIE). The firm categories (among the firms in the non-state sectors) are not
always mutually exclusive but they show the breakdown between listed and unlisted firms, and, in
the small-scale sector, between manufacturing (SSI) and services (SSSBE) sectors.21 For all firms in the state and non-state sectors, the most important source of funds is “internal sources” (e.g.,
retained earnings) accounting for over one-third of all sources. However, the most striking finding
from the table is the importance of short-term financing through trade credits, other current liabilities
and provisions, reflected in the “Others” category. Across all firm categories short-term sources on
an average accounted for close to 30% of all sources of funds. The importance of this source
increases dramatically in the small scale segment accounting for over half and almost two-thirds of
all financing for the SSI and SSSBE sectors, respectively. Since many firms in the SSSBE sector are
engaged in wholesale and retail trade and with current liabilities playing an important role in
financing and business activities, this finding is perhaps not too surprising.
The overall marginal debt-equity ratio, with debt equaling the sum of “debt” and “borrowing
from banks or intermediaries” (part of this category may be short-term in nature) comes out to be
approximately 1.5. Firms in the two small-scale sectors have negligible debt in their marginal
capital structure. Firms in the state sector have the highest marginal leverage (over 1.8), followed by
listed companies, unlisted companies, and small scale sector firms in that (expected) order. While
there has been considerable temporal variation in the relative importance of individual sources of
financing in the last decade and a half, the overall patterns noted above remain unaltered. Overall,
the results shown in Table 5 are largely consistent with the findings of Love et al. (2004), who find
21 The numbers in the table are
flow variables. For a certain type of firm, the percentages reported in the table are
obtained by first calculating the percentage of total new funds in a given year for each funding source and then by taking
the average from 1990 through 2004. CMIE is a Mumbai-based economic and business information and research organization.
20
evidence of stronger credit constraints for smaller (and younger) firms. Our results are also
generally consistent with those from the Reserve Bank of India (2005).22
The patterns above appear to suggest that external long-term finance has remained an
important bottleneck in Indian industry, particularly for the SME sector. Recent studies by other
researchers have found evidence of “under-lending” by Indian banks to the corporate sector.
Under-lending is present when the marginal rupee lent to a borrower yields a higher marginal product than
its interest cost.23 Banerjee and Duflo (2003) find that, even after six years of liberalization, bank credit was scarce while interest rates, though high by world standards, appeared to be under the
equilibrium levels. It is a system-wide feature, indicating that companies cannot get adequate credit,
not just from a single bank but from the banking system in general. In many countries, the SME
sector faces impediments to bank financing, and depends heavily on short-term borrowing.24 India perhaps presents a rather extreme example of this phenomenon, with the SME sector facing a severe
shortage of financing. About 50% of the respondents in a recent National Sample Survey
Organization (NSSO) survey said that they faced an acute shortage of capital.25 The mean loan outstanding was less than 3% of gross fixed asset (at market prices). About 93% of SME units had
no outstanding loans from banks or financial institutions. About half of the respondents in the
NSSO survey without loans mentioned that getting a loan is very difficult. About half of the loans to
this sector came from specialized central financial institutions like the Small Industry Development
22 Using financial reports of around 2,000
public companies, the Reserve Bank of India finds that internal sources
accounted for about 40% of total funds until 1999-2000, and then jumped to about 60%. They treat “provisions” as part of “internal sources”, while our data source, CMIE Prowess, includes it in “others” category.
23 For example, Banerjee et al. (2004) estimate that, for profitable firms (mean profit Rs. 36,700) in India, an increase of Rs. 1,000 in lending (average loan size Rs. 86,800; not fixing other financing sources) causes an increase in annual profit of Rs. 756.13. This finding indicates that companies may enhance profits by borrowing more from the banks.
24 See Voordeckers and Steijvers (2005) for the Belgian case, and see Poutziouris et al. (2005) for the situation in the U.K. In the U.S., small firms also have difficulties in obtaining bank loans, but part of the funding slack has been provided by private equity (including angel financing and venture capital) and privately placed and public bonds (Berger and Udell 1995, 1998).
21
Bank of India (SIDBI) and state financial institutions (SFCs). The average annual credit flow to the
SSI during the late 1990s hovered between US$ 2.4 and 3.6 billion.
It is important to point out that, while formal financing (equity and public/private debt
through markets as well as through other means involving formal contracting) remains scarce and
costly for firms in India’s SME sector (and in other emerging economies), informal and alternative
financing sources can provide an effective (partial) substitute for formal channels and support the
growth of these firms. In Section V below, we provide firm-level evidence on formal and informal
financing channels based on our own surveys of firms. To summarize our findings in this section,
with aggregate data (at industry-level) we first show that financing through internal and alternative
channels provides the most important funding source for Indian firms. We also find that the growth
of the non-state sectors, in particular, the SSI sector which is part of the SME sector, has been the
most impressive among all firms in India.
IV. Evidence on Listed Firms
In this section, we focus on publicly listed and traded companies and examine their financing
and investment decisions. We also relate these firm characteristics to legal protection of investors in
India, and examine whether these relations are different from firms studied in previous papers (LLS,
1999; LLSV, 1997a, 2000b, 2002). Before doing so, we first look at different types of listed firms
and corporate governance mechanisms in listed firms.
IV.1 Types of Listed Firms and Corporate Governance
Although the majority of listed firms belong to non-state sectors, an important component of
the listed Sector is partially privatized and listed state-owned enterprises, usually known as public
sector undertakings (PSUs). Privatization of PSUs has been a key element of India’s continuing
22
been to reduce state shareholding in all PSUs, except defense, atomic energy and railways, to 26% or
lower. However, progress on this front has been extremely slow, largely owing to political
opposition (see Gupta 2005). By March 2001, the federal government had sold shares in 41 out of
258 PSUs, of which in 39 cases the state still retained majority shareholding; the median
“disinvestment” was only 16% of shares. The disinvestments have taken various forms including
sale of shares to domestic and foreign institutional investors and the public through open auctions,
public offerings, and global depository receipts in international stock markets. In most cases, the
partial or complete privatization has involved listing of PSUs on major exchanges and active trading
in these shares.26
Next, we briefly examine standard corporate governance mechanisms in the listed sector. In
the years since independence, with less developed stock markets, three national level development
finance institutions together with the state financial corporations have been the main providers of
long-term finance to companies. Along with the government owned mutual fund company, the Unit
Trust of India, they also held large blocks of shares in the companies that they lent to and invariably
had board representations. In this respect, the corporate governance system resembled the
bank-based German model. The institutions were traditionally evaluated on the quantity rather than
quality of their lending and thus had little incentive for effective monitoring. Their nominee
directors routinely served as rubber-stamps of the management of the day. With their support,
promoters of businesses in India could frequently enjoy managerial control with very little equity
investment of their own. This makes it relatively easy for the promoters and other insiders to recoup
their investment in a short period by self-dealing and other strategies.27
26 The Bombay Stock Exchange has a separate index, the BSE PSU index, consisting of 47 partially privatized public sector undertakings. On March 31, 2006, these 47 companies had a combined market capitalization of over 166 billion US dollars, accounting for just over 25% of the total Bombay Stock Exchange market capitalization.
27 There is some evidence on the “tunneling” of funds from one group company to another. Bertrand
et al (2002)
23
India’s formal bankruptcy and reorganization process is slow and inefficient. This process is
governed by the 1985 Sick Industrial Companies Act. Under this Act the Board for Industrial and
Financial Reconstruction (BIFR) provides immediate protection from the creditors’ claims for at
least four years. Between 1987 and 1992, BIFR took well over two years on an average to decide on
a case. Since then, delay has roughly doubled. Very few companies have emerged successfully
from BIFR, and even for those that needed to be liquidated, the legal process takes over 10 years on
an average, in many cases rendering the assets of the company practically worthless.
Given this reality of the weak protection of creditors’ rights, it is hardly surprising that banks,
flush with depositors’ funds, routinely decide to lend only to blue chip companies and park their
funds in government securities. Consistent with evidence of credit-constrained firms (Banerjee et al.
2004), investments in government securities accounted for 37% of the total assets of Indian banks
while advances accounted for 49%. Indian companies are also marked by limited dispersion of
shareholding. Even as recently as 2002, the average shareholding of promoters in all Indian
companies was as high as 48.1% (Topalova 2004). In recent years, however, corporate governance
has received considerable attention among investors, regulators and the media, and several initiatives
to improve the level of corporate governance are being debated and adopted in India (see
Chakrabarti 2006).
As noted before, corruption and weak enforcement of corporate laws have corroded the level
of actual protection despite extensive investor protection on the books. The World Bank’s Report on
the Observance of Standards and Codes, in its 2004 analysis of the observance of the OECD’s
corporate governance codes in India, identified several areas for reform, while noting improvements
since 2000. These include developing deterrents to help align business practices with the legal and
regulatory framework, in particular with respect to related party transactions and insider trading; firms in the same industry. However, there is also evidence (e.g., Khanna and Palepu 2000) that firms associated with business groups have superior performance than stand-alone firms.
24
changing the fragmented structure of regulatory agencies that give rise to regulatory arbitrage and
weak enforcement; rules governing decision-making processes in corporate boards; and improving
the role of institutional investors acting in a fiduciary capacity in forming and enforcing corporate
governance policy, including voting and board representation.
Finally, the market for corporate control in India is at an emerging stage. Promoters typically
maintain control of listed firms with relatively small shareholding given the support of lending
institutions. Hostile takeovers were not allowed by the Securities and Exchanges Board of India
(SEBI) as recently as 1997. There have been close to 600 public offers for corporate takeovers since
then. Nevertheless, regulations and the ownership structure of listed firms make it difficult for
attempts at hostile acquisitions to succeed (e.g., Kripalani 2000; Vaidyanathan 2002).
To summarize, despite extensive and strong investor protection on paper, actual protection of
investors and standard corporate governance mechanisms are weak in the listed sector. We provide
a discussion of the role of alternative and informal governance mechanisms in Section V.6 below.
IV.2 Empirical evidence on ownership, financing, dividend, and valuations of listed firms In this subsection, we examine and compare various characteristics of listed firms in India
with those of other countries. Our initial sample of 1,395 listed firms (panel data set for the period
1995 to 2004) is collected and compiled from the CMIE Prowess database (same database for Table
5 above). There are four groups of listed firms in our sample (there are no PSUs in the sample).
1. Small manufacturing firms: SSI firms (definition in Section III); 2. Large manufacturing firms: Non-SSI or NSSI firms;
3. Small non-manufacturing firms: SSSBE firms (definition in Section III); 4. Large non-manufacturing firms: Non-SSSBE or NSSSBE firms.
For each group of firms, data on financials, market variables, and ownership patterns were
25
firms. We first examine firms’ ownership structure. Table 6-A compares the ownership structure of
Indian firms to those from the LLS (1999) sample of over 1,000 firms from 27 countries (India not
included), from the Claessens et al., (2000) sample of Asian firms (excluding Japan) and the AQQ
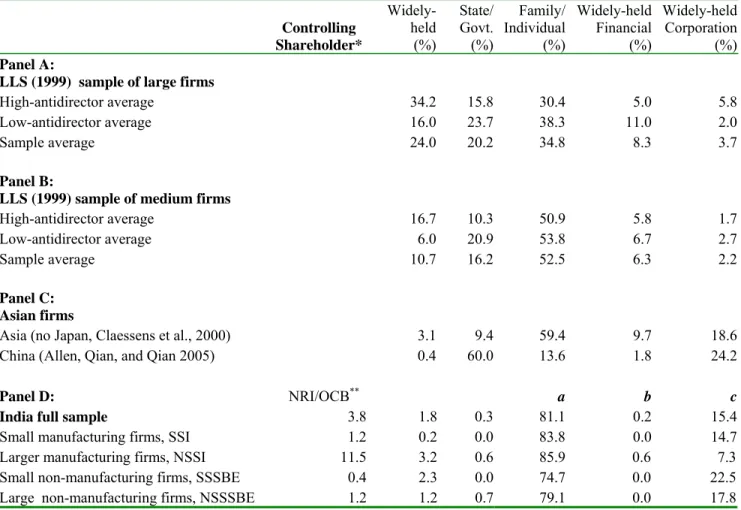
(2005) sample of over 1,100 firms from China. In 80% of the 854 listed firms in India, the largest
shareholder (controlling shareholder) is the founder’s family or a different family or individual.28 Among 15% of the 854 firms, the largest shareholder is another corporation (or organization), and
thus cross-holding is also a prevalent ownership pattern in India. Since we do not have detailed
information on the ownership patterns of the corporate owners, we do not know whether the
corporate owners themselves are widely held or not. However, given the fact that family
(individual) ownership is prevalent among listed firms, it is reasonable to assume that these
corporate owners are not widely held. Only 1.76% of the 854 firms are widely held (i.e., no
shareholder owns more than 10% of stocks).
Our findings on ownership structure of India’s listed firms are similar to those of other Asian
countries (e.g., Claessens, Djankov and Lang 2000; Claessens, Djankov, Fan and Lang 2002; and
AQQ 2005). The main result of LLS (1999) is that countries that protect minority shareholders
poorly (strongly) tend to have more concentrated (dispersed) ownership. Our evidence on India
contradicts this hypothesis, in that despite India’s strong investor protection (by law) its ownership
structure is close to other Asian countries (with family ownership) and countries with weak investor
protection. However, if we take into account India’s weak law enforcement and institutions (e.g.,
using the anti self-dealing index in DLLS 2005 and the revised creditor rights score in DMS 2005),
then observed ownership structure is by and large consistent with the prediction of DLLS (2005).
28 Since we do not have detailed information on the identities of all the largest shareholders of these firms (e.g., whether they belong to the same family or a group of a few unrelated blockholders), our figure (80%) may be biased. However,
we are certain that the largest block of equity of these firms is not held by organizations, the government, or a large
26
Table 6-Bpresents the summary statistics for a “snapshot” of the sample firms at the end of
2004. From Panel A, the average market cap of the full sample is US$16.98 million (median is US$
0.84 million), with the NSSI and NSSSBE firms significantly larger than the SSI and SSSBE firms.
Panels B to G present key financial items such as earnings per share, net income, retained earnings,
external financing through seasoned equity offerings (SEOs), and long-term borrowings and
dividend payout ratios for each group of sample firms. For all firms in the sample, the retained
earnings are very close to net income (Panels C and D), implying high internal re-investment rates.
This is consistent with the finding from Table 5 that retained earnings constitute a vital source of
financing. Not surprisingly perhaps, NSSI firms seem to have more access to SEOs than other types
of firms (Panel E). Finally, the majority of our sample firms, in particular, small firms (SSI and
SSSBE firms), did not pay dividends in 2004 (Panel G), while the fraction of dividend-paying firms
is much higher among large firms (NSSI and NSSSBE firms) and these firms pay higher dividends.
Table 6-C provides some evidence on external financing sources at the firm level. The ratios
for all the countries (except for India) in the table are taken from LLSV (1997a).29 Indian firms rely much less on equity financing than LLSV firms: Both ratios of market capitalization to sales and to
cash flow for the full sample of Indian firms are much lower than the average of LLSV firms and
most of the LLSV subgroups of firms. Among the four groups of Indian firms, large manufacturing
firms (NSSI) rely least on equity financing, while small, non-manufacturing firms (SSSBE) rely
most on equity financing. On the other hand, Indian firms, in particular, large firms (NSSI and
NSSSBE firms), rely more on debt financing (bank loans and bonds) than LLSV firms: Both ratios
of debt to sales and to cash flow for the full sample of Indian firms are higher than all LLSV
subgroups of firms. When we combine equity and debt financing (sum of rows 1 and 3 or 2 and 4),
29 In LLSV (1997a), a ratio (e.g., market cap/sales) for a country is obtained by first finding the
median of this ratio
across firms within various industries, and then by taking the average of the medians across industries. Each ratio for
LLSV countries in Table 6-C is the median of the ratios of countries with the same legal origin. For Indian firms, we
27
it appears that the listed Indian firms rely on external market and bank financing to a similar degree
compared to their counterparts in LLSV countries.
Next, we examine dividend policy and valuations of listed firms in India, and compare the
results to those studied by LLSV (2000b, 2002).30 Following LLSV (2000b, 2002), we use the summary statistical data from their papers to create a “synthetic firm” for each country in their
sample, and use our own data on Indian firms to create the synthetic firm for India; we then compare
the predicted values based on the LLSV model with the actual values of the synthetic Indian firm to
examine the predictive power of the LLSV model. Table 7 explains the details of the approach and
presents regression results. First, LLSV (2000b) find that firms in countries with poor protection of
outside shareholders tend to have low dividend payout ratios due to severe agency problems. This
result is consistent with our findings, but the coefficients on low protection (dummy that equals 1 if
the anti-director rights score is less than or equal to 3/6) and interaction between growth in sales and
the low protection dummy from our regressions are not statistically significant. Second, LLSV
(2002) find that firms in countries with poor protection of outside shareholders tend to have low
valuation, proxied by the Tobin’s Q (or lower market-to-book assets ratio). This result is confirmed
with our “synthetic firm” approach: We find that both the cash-flow rights (percentage of shares
owned by the largest shareholder) and anti-director rights are positively correlated with firm
valuations.
We then investigate whether LLSV’s predictions on dividend and valuation apply to India’s
synthetic firm. First, India belongs to the high protection group, so that the LLSV model suggests
that Indian firms should have high dividend payout: This is the case if we use dividend/sales as the
proxy for payout ratio, because the prediction error of India’s synthetic firm (0.11) is smaller than
the standard error of the regression residuals (2.16); but in terms of dividend/earnings ratio the
30 LLSV (2002) examine Tobin’s Q of 539 firms in 27 wealthy economies and India is excluded. LLSV (2000) examine dividend policies of over 4,000 companies in 33 countries including India, but with only one Indian firm in the sample.
28
LLSV prediction is incorrect as the prediction error is high (13.15 as compared to 11.84). LLSV’s
prediction on valuation is also incorrect as the prediction error of Tobin’s Q of India’s synthetic firm
is high (0.75 vs. 0.32).
In conclusion, our empirical analysis on the listed firms in India demonstrates that India does
not conform precisely to LLSV’s predictions and findings on legal protection and firm
characteristics. However, considering that investor protection in India is poor in practice, our
analysis is not inconsistent with the spirit of LLSV predictions. With English common-law origin
and strong investor protection by law but not in practice, India’s listed firms actually behave more
like firms from countries with poor investor protection: The equity ownership of Indian firms is
highly concentrated within the founder’s family or the controlling (individual) shareholder; and they
tend to pay lower dividend and have low valuations compared to companies from countries with
strong legal protection.
V. Survey Evidence on India’s Small- and Medium-sized Firms
In order to go beyond reported statistics and secondary financial information, and understand
better the business realities and financing decisions of small and medium businesses in India at the
ground level, we conducted a survey of SME enterprises in India. Our surveys led to a number of
interesting findings about the SME sector in India. They reinforced the difficulty in obtaining
external funds from formal channels, a point mentioned in Section III above. What is perhaps an
even more interesting finding is the role and importance of informal and alternative financing
channels, as well as informal mechanisms in contract enforcement that characterize the environment




![Electrochemical Evaluation and DFT Studies of 2-(4-chlorophenyl)-3-hydroxy-4,6-dioxo-8-phenyl-4,6-dihydropyrimido[2,1-b][1,3]thiazine-7-carbonitrile of Carbon Steel Corrosion in Hydrochloric Acid](data:image/gif;base64,R0lGODlhAQABAIAAAP///wAAACH5BAEAAAAALAAAAAABAAEAAAICRAEAOw==)