The Role of Pathology Correlation
Approach in Prostate Cancer Index
Lesion Detection and Quantitative
Analysis with Multiparametric MRI
Andriy Fedorov, PhD, Tobias Penzkofer, MD, Michelle S. Hirsch, MD, PhD, Trevor A. Flood, MD,
Mark G. Vangel, PhD, Paul Masry, MD, Clare M. Tempany, MD, Robert V. Mulkern, PhD,
Fiona M. Fennessy, MD, PhD
Rationale and Objectives:Development of imaging biomarkers often relies on their correlation with histopathology. Our aim was to compare two approaches for correlating pathology to multiparametric magnetic resonance (MR) imaging (mpMRI) for localization and quantitative assessment of prostate cancer (PCa) index tumor using whole mount (WM) pathology (WMP) as the reference.
Materials and Methods:Patients (N= 30) underwent mpMRI that included diffusion-weighted imaging and dynamic contrast-enhanced (DCE) MRI at 3 T before radical prostatectomy (RP). RP specimens were processed using WM technique (WMP) and findings summarized in a standard surgical pathology report (SPR). Histology index tumor volumes (HTVs) were compared to MR tumor volumes (MRTVs) using two approaches for index lesion identification on mpMRI using annotated WMP slides as the reference (WMP) and using routine SPR as the reference. Consistency of index tumor localization, tumor volume, and mean values of the derived quantitative parameters (mean apparent diffusion coefficient [ADC], Ktrans, and v
e) were compared.
Results:Index lesions from 16 of 30 patients met the selection criteria. There was WMP/SRP agreement in index tumor in 13 of 16 patients. ADC-based MRTVs were larger (P< .05) than DCE-based MRTVs. ADC MRTVs were smaller than HTV (P< .005). There was a strong cor-relation between HTV and MRTV (Pearsonr> 0.8;P< .05). No significant differences were observed in the mean values of Ktransand ADC between the WMP and SPR.
Conclusions:WMP correlation is superior to SPR for accurate localization of all index lesions. The use of WMP is however not required to distinguish significant differences of mean values of quantitative MRI parameters within tumor volume.
Key Words:Prostate cancer; magnetic resonance imaging; pathology correlation; quantitative imaging.
ªAUR, 2015. Published by Elsevier Inc. This is an open access article under the CC BY-NC-ND license (http://creativecommons.org/ licenses/by-nc-nd/4.0/)
M
agnetic resonance (MR) imaging (MRI) of the prostate has become an essential modality for stag-ing and characterizstag-ing prostate cancer (PCa)(1,2). Current imaging protocols use multiparametric MRI (mpMRI) with diffusion-weighted imaging (DWI) and
dynamic contrast-enhanced (DCE) MRI in addition to conventional T2- and T1-weighted imaging for a comprehen-sive assessment of PCa. The current recommendations for the clinical use of MRI rely on the qualitative assessment of the MR parameters(2,3), but much work is currently being done to refine mpMRI acquisitions, analyses, and validations to establish the clinical utility of quantitative prostate imaging. Each individual imaging sequence can provide unique and complementary quantitative measurements of the underlying physiology and pathophysiology of the prostate tissue, leading to improved detection of PCa (4,5). However, exactly what pathophysiology these quantitative measurements represent is not well established.
Development and validation of quantitative imaging tools re-quires correlation with established markers of the disease. A pathology-derived Gleason score remains the cornerstone for decision making with regard to therapy selection and disease prognosis(6). As such, numerous studies have been conducted
Acad Radiol 2015;22:548–555
From the Department of Radiology, Brigham and Women’s Hospital, 75 Francis Street, Boston, MA 02115 (A.F., T.P., C.M.T., F.M.F.); Department of Radiology, RWTH Aachen University Hospital, Aachen, Germany (T.P.); Department of Pathology, Brigham and Women’s Hospital, Boston, Massachusetts (M.S.H., T.A.F., P.M.); Department of Radiology, Massachusetts General Hospital, Boston, Massachusetts (M.G.V.); Department of Radiology, Boston Children’s Hospital, Boston, Massachusetts (R.V.M.); and Department of Radiology, Dana-Farber Cancer Institute, Boston, Massachusetts (F.M.F.). Received November 3, 2014; accepted December 31, 2014.Address correspondence to:F.M.F. e-mail:[email protected]
ªAUR, 2015. Published by Elsevier Inc. This is an open access article under the CC BY-NC-ND license (http://creativecommons.org/licenses/by-nc-nd/4. 0/)
to correlate quantitative mpMRI parameters with histology for the purposes of localizing the lesion and assessing its aggressive-ness(7,8). Likewise, correlation with histology is also a necessary component in the validation of mpMRI as a means of response to therapy. However, the methods used for pathologic correlation vary widely, ranging from in-depth whole mount (WM) processing of the specimen followed by delineation of tumor foci by a pathologist directly on the glass sides and com-parison to MRI data, to simply correlating MR images to the standard clinical pathology report. These two correlative pathol-ogy approaches are very different in terms of resources, expertise, and time involvement. WM pathology (WMP) correlation re-quires a technologist with expertise in WM fixation, embedding and sectioning, extensive pathologist involvement and is consid-ered the ‘‘gold standard’’ for an imaging correlative approach. In contrast to standard pathologic processing used routinely, where individual cross-sections of the prostate are further cut into four quadrants or more, WMP allows for increased accuracy of the spatial mapping between pathology specimen and images, as axial sections of the prostate specimen are processed using large WM slides, which are marked to facilitate volumetric reconstruction of the specimen. The tumor areas are next contoured on each slide, thus simplifying spatial localization of the matching lesions in the imaging data. This in-depth correlative approach has been used by many(8–10). In contrast, a more common routine processing protocol provides pathology information necessary for clinical decision making, and including overall Gleason score and whether or not there is an extracapsular extension of tumor, it may include one- or two-dimensional measurement of the tumor area(s). As such, routine processing does not allow for volumetric reconstruction of the specimen, and so, three-dimensional volumes cannot be easily estimated. The surgical pa-thology report (SPR) is therefore not focused on providing detailed information for validating imaging studies. However, given the ubiquitous availability of SPR data, and the relatively low cost of implementing imaging correlative studies that rely on SPR, the practical question is whether SPR alone is sufficient for accurate localization of PCa. If the index lesion is correctly localized, it is unknown whether the assumed improvement in the accuracy of tumor delineation using WMP leads to signifi-cant differences in the tumor volume outlined, or differences in the quantitative MR parameters obtained.
In this study, we compare two types of pathology to MR correlation approaches, WMP and SPR, for prostate tumor localization and delineation. Our goal is to investigate whether the choice of the correlation approach has an effect on index tumor detection and localization, and whether outlined tumor volume and quantitative mpMRI metrics in areas of tumor and noncancerous tissue differ between pathologic approaches.
MATERIALS AND METHODS
Patients
Thirty male patients (median age, 63 years; range, 45–69 years) with biopsy-confirmed PCa were consented to participate in
the research study. Inclusion criteria were ability of the patient to undergo endorectal coil prostate MR, radical prostatec-tomy as a treatment plan, and an elevated serum prostate-specific antigen (PSA) level within 6 weeks before imaging.
MR Imaging
All MRI examinations were performed on a GE Signa HDx 3.0 T magnet (GE Healthcare, Waukesha, WI) using a combi-nation of eight-channel abdominal array and endorectal coil (Medrad, Pittsburgh, PA). The mpMRI protocol(1)included T1-weighted imaging (spoiled gradient recalled acquisition in steady state [SPGR] sequence, repetition time [TR]/echo time [TE]/a= 385 ms/6.2 ms/65, over a 16-cm2 field of view [FOV]), T2-weighted imaging (fast relaxation fast spin echo [FRFSE] sequence, TR/TE = 3500 ms/102 ms over a 16-cm2 FOV), and DWI (single-shot echo planar imaging [EPI] sequence, TR/TE = 2500 ms/65 ms with b-values of 0 and 500 s/mm2). DCE MRI was performed with a 3D SPGR sequence, TR/TE/a = 3.6 ms/1.3 ms/15, FOV 26 cm, with full-gland coverage and reconstructed voxel size of 116 mm as interpolated to 256256 matrices, and with a temporal resolution of approximately 5 seconds. Gado-pentetate dimeglumine (Magnevist; Berlex Laboratories, Wayne, NJ) was injected intravenously using a syringe pump (0.15 mmol/kg; rate 3 mL/s). The protocol included5 base-line scans before contrast injection for estimation of basebase-line signal intensities.
We note that for a prostate T1 around 1.5 seconds, the Ernst angle of 35gives maximum signal for our TR value of 0.385 seconds. As we have noted in (11), however, flip angle (FA) values particularly at 3 Tare at best ‘‘nominal’’ and can vary quite a bit over the FOV due to B1 inhomogeneities; so, we work with an FA of 65as it is in a relatively flatter region of the signal versus FA curve making it less sensitive to FA variation from B1 inhomogeneities than the 35choice. This larger FA also pro-vides a heavier T1 weighting to get more sensitivity to the short-T1 hyperintensities from blood products (eg, biopsy-related hemorrhage); so, we prefer this to optimizing prostate tissue signal as this is one of the major reasons for this initial SPGR sequence.
Image Processing
DWI apparent diffusion coefficient (ADC) maps derived from b500 DWI and subtraction DCE images (calculated as the dif-ference between the phase corresponding to the contrast bolus arrival and the baseline phase) were generated by the scanner software. Generalized kinetic model (12)was applied to the DCE MRI data to derive pharmacokinetic (PK) maps of for-ward volume transfer constant (Ktrans, minute 1) and the frac-tional volume of extracellular space per unit volume of tissue (ne). PK analysis was done using OncoQuant research
proto-type software (GE Global Research, Niskayuna, NY). The two-parameter model without a plasma volume fraction term was chosen because of the temporal resolution of the prostate DCE MRI data (5 seconds). The initial precontrast
T1 value of the prostate was fixed at 1597 ms (13) and at
1600 ms for blood(14)and used to convert signal intensity to gadolinium concentration(11). For arterial input function (AIF) initialization, we used a previously computed, fixed, AIF curve, numerically constructed from published first-pass data(15) and concatenated with the Weinmann curve for late wash out(16). This methodology has been previously reported(17)and was chosen because our imaging and injec-tion protocol closely match those used in that study. Quality of the model fits was assessed using the coefficient of determina-tion (R2). Voxels showing poor fit of the model to the data (R2< 0.75) were excluded from the analysis.
Histopathology Acquisition and Analysis
Radical prostatectomy specimens were inked for laterality and fixed in 40% buffered formalin overnight at room tempera-ture. The first 26 consecutive patients were sectioned manu-ally from apex to the base, perpendicular to the urethra at 4–5 mm intervals. In the last four patients, a customized indi-vidual 3D molds were used to process the specimens(18). The molds were fabricated by 3D printing to maintain cutting at the angle consistent with the slice orientation in the DCE MRI, and with the section thickness of 3 mm. In all cases, each slice was annotated by slice number, fixed, and paraffin embedded. Care was taken in each case to maintain orienta-tions of each slice of the prostate so that the same sides of each slice was routinely cut (ie, the superior or inferior edge for each prostate cross-section), thus allowing for relatively equal spaces between hematoxylin and eosin (H&E) sections. Subsequently, 5-m WM tissue sections were cut from each slice, glass-mounted, and stained with H&E.
All PCa foci in each patient were outlined with a marker on the glass slide and assigned a Gleason score by the dedicated genitourinary (GU) pathologist. The annotated WM slides were digitized using a flatbed scanner (2400 dpi, transparency unit). Tumor region of interests (ROIs) were manually recon-toured on the digitized WM slides using 3D Slicer open source software(19). Histopathology tumor volumes (HTVs) were automatically calculated based on manual contours by assuming 5 mm thickness for routine manual processing and 3 mm thick-ness for those processed using the customized mold. Volumes were then scaled by a factor of 1.15 to account for tissue shrinkage as recommended by Jonmarker et al.(20).
Lesion Localization
Correlation analysis was restricted to clinically significant pe-ripheral zone (PZ) tumors, defined as tumors with HTV >0.5 cc(21,22). For patients with multiple tumors that had HTV$ 0.5 cm3, an index lesion was chosen to correlate with mpMRI. This index lesion was defined as the largest lesion with the highest assigned Gleason score within each case. Correlation with mpMRI imaging was performed by a radiologist with >10 years of experience in prostate MRI (F.F.). Tumor ROIs corresponding to the index lesion and
ROIs corresponding to noncancerous PZ tissue were identified using two correlative approaches:
1) Approach 1: WMP pathology-based analysis: digitized whole mount slides of the radical prostatectomy specimen containing areas of tumor outlined by a GU pathologist with >10 years of experience (M.S.H.) were viewed side by side with mpMRI images (T1-weighted images [T1W], T2-weighted images [T2W], ADC maps, and DCE subtraction images) using 3D Slicer. An ROI corre-sponding to the index lesion (tumor ROI [TROI]), and an ROI corresponding to a nearby area of nontumor con-taining tissue (if possible on the same axial slice) were identified and contoured on mpMRI using anatomic landmarks such as urethra, verumontanum, prostatic calci-fications, or benign prostatic hyperplastic nodules. 2) Approach 2: SPR-based analysis: using the clinical
stan-dard of care pathology report, but without access to WMP images, an index lesion was identified and con-toured on mpMRI images (T1W, T2W, ADC maps, and subtract images) using 3D Slicer. An area of nontumor containing tissue was also delineated, based on mpMRI maps, on the same or adjacent axial image.
ROIs were identified using WMP approach first, followed by the SPR approach after 6 months time interval. For each approach, an index lesion had to demonstrate restricted diffu-sion on ADC maps, focal low signal intensity on T2W images (T2WI), and enhancement on DCE subtraction images. Lesion localization was performed based on qualitative assessment of all mpMRI sequences rather than using specific quantitative cut-offs for ADC or for DCE. We did not use any fixed thresholds for lesion identification. Whenever possible, normal ROI was contoured on the same slice as tumor or in the closest adjacent slice. All index lesions identified in this manner were contoured on T2WI, ADC maps, and subtraction DCE images using 3D Slicer. Zonal anatomic location of each index lesion was recorded using a 2 3 table (right and left across the base, the midgland, and the apex). If the tumor occupied multiple zonal locations, all zones spanned by the tumor were marked.
Comparison Analysis
We first evaluated lesions that were localized consistently by the WMP and SPR approaches based on their coded zonal anatomic location. Partial agreement in location was inter-preted as consistent localization (ie, a tumor coded as Right-Apex in WMP and Right-Apex/Right-Mid in SPR was considered overlapping). For tumors localized consis-tently, we proceeded with analysis of volumetric agreement of the ROIs, ROI spatial overlap, and compared the quantita-tive mpMRI values extracted from the ROIs.
The pairedttest was used for the following reasons: 1) to determine if there was a difference in MR tumor
vol-ume (MRTV) estimates contoured on each mpMRI map (T2, DCE, and ADC) with two different correlative
approaches: MRTV using SPR (MRTVSPR) and MRTV
using WMP (MRTVWMP), compared to HTV.
2) to determine if there was a difference in volume between the TROIs on individual mpMRI parameter maps for each pathology correlative approach.
3) to compare the quantitative values of MR parameters ex-tracted from TROIs using the two correlative approaches. Bonferroni correction was used to adjust for multiple com-parisons when comparing more than two groups. Bland–Alt-man analysis was applied to evaluate agreement between the tumor volumes identified by the two correlation approaches for the same image, for comparing tumor volumes estimated using MRI and pathology-estimated volumes and between each of the mpMRI parameter/map, and the tumor localiza-tion approach combinalocaliza-tions. The relalocaliza-tionship between the HTVs and both MRTVs was also analyzed using the Pearson correlation coefficient.
Spatial overlap between the WMP- and SPR-based tumor ROIs was assessed using Dice similarity coefficient (DSC). The value of DSC is between 0 and 1, the latter corresponding to perfect overlap. DSC is a commonly used measure commonly used to assess the agreement between segmented contours(23). This Health Insurance Portability and Accountability Act (HIPAA)-compliant prospective study was approved by our institutional review board. Written informed consent was ob-tained from all subjects.
RESULTS
Study Population
For the initial cohort of 30 patients, the median serum PSA level was 5.19 ng/dL (range, 2.20–25.95 ng/dL). The mean number of days between a positive prostate biopsy result and prostate MR was 73 days (median, 42 days; range, 1–687), and the mean interval between prostate MR and prostatec-tomy was 58 days (median, 47 days; range, 10–217 days). A to-tal of 85 tumor ROIs were identified and contoured on WM slides. Of these, 44 had a Gleason grade$7, 35 had a Gleason grade 6, and in six lesions (from three patients); no Gleason grade was reported owing to prior neoadjuvant chemo-therapy. A total of 14 patients were excluded from the analysis because they had TROIs below the 0.5 cc tumor volume threshold (n= 8), TROI in central gland only (n= 3), had extensive hemorrhage on MRI limiting visualization of the tumor (n= 2), or had insufficient image quality (n= 1).
The Gleason score for all 16 TROIs was$7, except for one patient who had prior therapy and an unassigned Gleason score. The mean age of these 16 patients was 59 (standard de-viation [SD] 7; range, 45–69), mean PSA 5.6 (SD, 2.7; range, 2.2–13.6), mean tumor volume in cubic centimeters as measured on WMP and corrected for fixation shrinkage 1.99 (SD, 1.59; range, 0.56–7.00), mean number of days from biopsy to MRI 33 (SD, 16; range, 5–59), mean number of days from MRI to surgery 52 (SD, 51; range, 10–217).
Comparative Analysis between Pathologic Approaches
Index Lesion Localization. For all 16 cases, index lesions were identified and contoured in T2WI, ADC, and subtraction DCE using both the SPR and the WMP approach. The anatomic locations of the tumors identified based on SPR agreed with those outlined based on WMP in 13 of 16 cases.
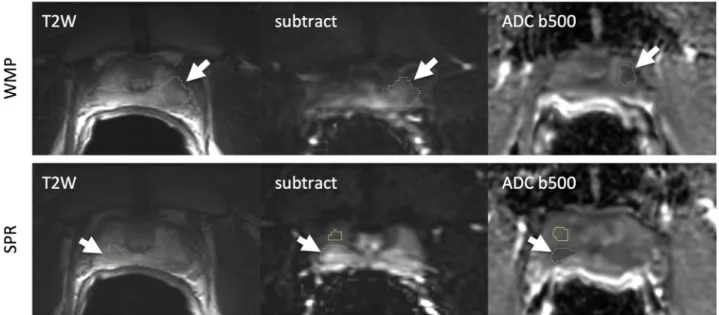
Figure 1shows one of the cases where tumor was localized incorrectly using the SPR localization approach. Only TROIs that were localized consistently between the SPR and WMP approaches were included in the subsequent analysis.
Spatial overlap based on Dice similarity coefficient between the matching tumor ROIs defined using the WMP- and SPR-based approaches was approximately 0.6 for all MRI maps (mean SD): T2, 0.62 0.22; DCE, 0.63 0.13; ADC500, 0.600.17.
Tumor Volume Assessment. Mean (SD) HTV measurements were 1992 (1655) mm3. MR-based TROI volume measure-ments for the individual maps are summarized in Table 1. For both correlative approaches, MRTVs were on average largest when contoured on DCE and smallest on ADC. Bland–Altman plots for individual combinations of parame-ters are shown in Figure 2. MRTVs estimated using both WMP and SPR approaches had a moderate-to-high correla-tion with HTV for T2WI, ADC, and DCE subtraccorrela-tion maps (WMP: T2WI, 0.67; DCE, 0.82; ADC500, 0.96; SPR: T2WI, 0.95; DCE, 0.82; ADC, 0.96; allP< .05).
Based on pairwise comparisons between the means of HTV, MRTVWMP, and MRTVSPR, we observed a significant
difference between the MRTVSPR approach and HTV for
volumes outlined based on T2 (P = .0024) and ADC500 (P = .0004). The mean difference between tumor volumes estimated from ADC and DCE maps was 780 mm3 (P< .0005) when WMP approach was used, and 524 mm3 (P< .02) for the SPR approach.
Comparison of Quantitative Multiparametric Parameters between Tumor and Nontumor ROIs
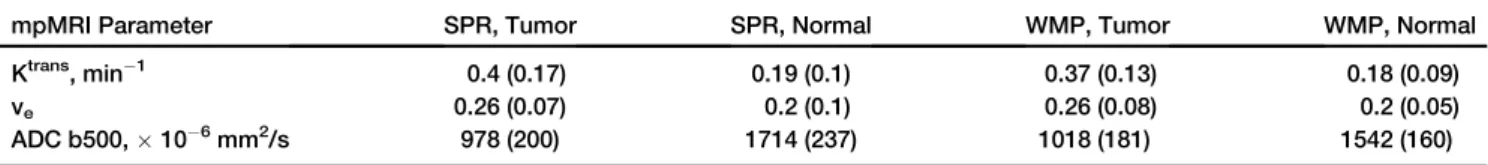
PK analysis resulted in good fits of the model to the data in the majority of voxels. On average, <5% of voxels were discarded based on the R2quality of fit measure. Means of the parameter values measured over tumor ROIs are summarized inTable 2. Differences between the means of the quantitative parameter values measured over tumor ROIs defined with the WMP and SPR approaches were not statistically significant. Mean ROI values of the quantitative parameters (Ktrans, ve, and ADC)
were significantly different between the tumor and normal areas both for WMP and SPR approaches (P< .05).
DISCUSSION
Correlation of imaging with histology is critical for validation and for establishing the utility of novel imaging biomarkers. More specifically, accurate correlation enables analyses of
the relationships between various MRI-based quantitative pa-rameters and histology, and allows for evaluation of the accu-racy of imaging in estimating tumor volume. This study does not address the pathology of MRI biomarkers in PCa. How-ever, considering the existing evidence that there is a correla-tion between mpMRI and underlying PCa pathophysiology (eg, the inverse relationship between cellular density and ADC (24–26), and a relationship between DCE MRI parameters and expression of vascular endothelial growth factor and microvascular density(27)), we believe there is a need for direct correlation of PCa histopathology with pros-tate MRI. This article investigated whether detailed WMP correlation of the prostatectomy specimen is necessary for direct correlation with mpMRI, of whether correlation with a standard pathology report postprostatectomy is sufficient.
We found that the use of the SPR approach led to incorrect lesion localization in a three of 16 cases (19%). It is not clear why there were difficulties in SPR-based pathology correlation in these three cases. The Gleason score was 4 + 3 in one case, and 3 + 4 in the two other cases. The volume of the lesion, based on WMP technique, was >0.5 cc in all three cases. No image quality problems were observed. It is possible that these three cases illustrate false-positive findings in mpMRI. We also cannot exclude an inconsistency in SPR reporting of the lesion laterality. For the lesions identified correctly, the choice of the pathology correlation approach did not result in significant dif-ferences in tumor volumes outlined on mpMRI maps. There was a trend toward underestimation of tumor with either path-ologic approach compared to actual HTV. We also observed a nonsignificant tendency of MRTVSPRvolume to be less than
MRTVWMP volume, and significant volumetric (for DWI
TABLE 1. Tumor Volume Estimates From the Individual MRI Sequences Using SPR and WMP Correlative Approaches (MRTVSPRand MRTVWMP, Respectively) and Their Differences Versus HTV
mpMRI Parameter Mean (SD) MRTVSPR, mm3
Mean (SD) Difference between HTV and MRTVSPR, mm3 Mean (SD) MRTVWMP, mm3 Mean (SD) Difference between HTV and MRTVWMP, mm3 T2WI 1073 (1022)* 919 (745) 1376 (1176) 626 (1229) DCE 1314 (974) 678 (1021) 1711 (1303) 280 (940) ADC 790 (950)* 1202 (794) 931 (1036)* 1061 (730)
ADC, apparent diffusion coefficient; DCE, dynamic contrast enhanced; HTV, histology index tumor volume; mpMRI, multiparametric magnetic resonance imaging; MRI, magnetic resonance imaging; MRTV, magnetic resonance tumor volumes; SD, standard deviation; SPR, surgical pa-thology report; T2WI, T2-weighted imaging; WMP, whole mount papa-thology.
MRI-based measurements that were significantly smaller (P< .005) than HTV based on three-way pairwise comparison between the SPR, WMP, and HTV measurements are marked with asterisk.
Figure 1. Illustrative example of discordant localization of the suspected prostate cancer (PCa), where whole mount pathology (WMP) was necessary to accurately identify the PCa.Top: PCa localization using whole mount annotations as the reference; the PCa chosen was identified on the left of the patient’s prostate, as defined from WMP.Bottom: PCa localization using SPR, however, chose a suspicious-appearing lesion on the right as the PCa (outlined ingreen). Note: normal peripheral zone is outlined inyellowon the same slide in this case. ADC, apparent diffu-sion coefficient; SPR, surgical pathology report; T2W, T2-weighted imaging; WMP, whole mount pathology.
and T2WI) differences between MRTV with either correlative approach and HTV. Likewise, the mean values of the quantita-tive indices (ADC or DCE PK maps) within the outlined tu-mor volume did not differ. The agreement of quantitative MRI parameters within tumor ROIs localized using the two approaches was somewhat expected, as the volumetric overlap was quite significant, leading to consistent mean values extracted from the ROI.
We found that both WMP and SPR approaches result in tu-mor volume estimates that are lower than those estimated from histopathology. Correlation of WM HTV with MRTV has been investigated in a number of prior studies. Turkbey et al.(9)investigated the agreement of histopatholo-gy- and MRI-based index tumor volume estimated in
conjunction with T2W, DCE, DW, and MR spectroscopic imaging. Their study reported high correlation between HTV and MRTV, with the MRTV overestimating HTV by 7%. Mazaheri et al.(10)observed that MRI can either under-estimate or overunder-estimate HTV, depending on the specific MR parameters used and the lesion characteristics, with T2W MRI performing particularly poor in estimating HTV. Several more recent studies concluded that MRI underesti-mates PCa tumor volume (28,29), consistent with our findings. Cornud et al.(30)report that DWI underestimated HTV in almost half of the cases. The differences in the con-clusions of the published studies could be explained by the variability of tumor size and heterogeneity, which could affect the accuracy of tumor volume estimation.
Figure 2. Bland–Altman plots illus-trating the relationship between histology index tumor volume (HTV) in comparison to the volumes estimated on magnetic resonance (MR) imaging after correlation with whole mount pathology (WMP;left column) and surgical pathology report (SPR; right column), for the individual MR parameters. Theblue horizontal line
corresponds to the mean difference,
dashed red linesshow 1.96 standard de-viation (SD) interval. In all cases, there was a tendency for the imaging-based approaches to underestimate HTV. ADC, apparent diffusion coefficient; DCE, dynamic contrast enhanced; MRTV, magnetic resonance tumor vol-umes; T2W, T2-weighted imaging.
TABLE 2. Mean Quantitative Parameters Extracted From the Tumor and Normal ROI Delineated Using WMP and SPR Approaches
mpMRI Parameter SPR, Tumor SPR, Normal WMP, Tumor WMP, Normal
Ktrans, min 1 0.4 (0.17) 0.19 (0.1) 0.37 (0.13) 0.18 (0.09)
ve 0.26 (0.07) 0.2 (0.1) 0.26 (0.08) 0.2 (0.05)
ADC b500,10 6mm2/s 978 (200) 1714 (237) 1018 (181) 1542 (160)
ADC, apparent diffusion coefficient; mpMRI, multiparametric magnetic resonance imaging; ROI, region of interest; SPR, surgical pathology report; WMP, whole mount pathology.
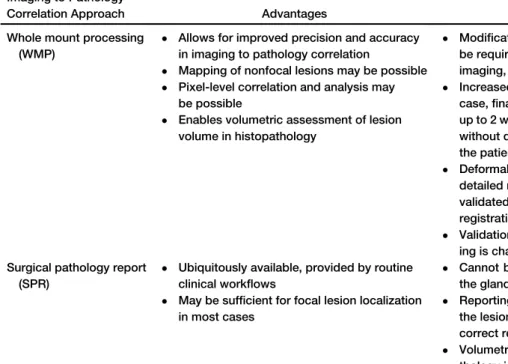
We used a WM specimen processing workflow that intro-duced minimum changes to the standard clinical routine for correlation with mpMRI to identify the location of the index lesion. Image registration techniques that enable detailed mapping between imaging and digitized pathology slides have been proposed (31,32). However, such techniques often require significant alterations to the clinical processing routine that can make their implementation challenging in practice. Even the most basic deviations from the standard of care processing, such as the use of WM sectioning instead of quartered slides or more, introduce delays while not providing any additional information necessary for clinical care(33). More complex approaches can introduce multiple modifications to routine clinical pathology specimen pro-cessing (eg, ex vivo MRI of the specimen, embedding of the traceable strands into the specimen) and in extreme in-stances can create the possibility for making error or compromising the quality of the analysis, which could be detrimental to patient management. As a result, it is desired to use the simplest possible approach for correlating imaging to pathology, which motivated our comparison of the two approaches that are the most straightforward to implement. Clearly, both WMP- and SPR-based approaches have advantages and disadvantages, which we summarized in
Table 3. We suggest that the choice of the specific technique used for correlation of pathology to imaging should be determined on a case by case basis based on the technical capabilities and resources available in a given situation, as well as the specific needs of the study.
Our study has several limitations. The number of lesions used in our analysis is small. This is due to the fact that we limited our study to a well-defined group of significant-volume PZ tumors ($0.5 cc) without hemorrhagic artifacts. We did not consider smaller lesions as it has been suggested by several studies that the focal lesion is the biological driver of PCa in the individual patient (9,22,34,35). We did not score reader confidence level for tumors identified in MRI, so we cannot assess whether the accuracy of lesion localization is actually dependent on the confidence level. Our study focused on PCa patients who underwent prostatectomy and did not consider the use of biopsy data for correlation of the index lesion with the imaging. Sextant core needle biopsy of the prostate gland under the guidance of the transrectal ultrasound is commonly performed. It is possible for such samples to be marked as to their location within the gland, thus facilitating spatial correlation with the imaging based on the prostate zonal anatomy(36). How-ever, consistency of the tissue core labeling differs across the institutions, and sampling error can be quite large: up to 46% of patients can have false-negative results on repeat sextant biopsy(37–39).
In conclusion, WMP is necessary to accurately localize all PCa index lesions. For the purposes of tumor volume mea-surement and quantitative mpMRI assessment of the majority of index lesions, which can be accurately localized through correlation with SPR, there is no significant difference in tumor volumes contoured or quantitative metrics obtained from the TROIs, although overall tumor volumes obtained TABLE 3. Summary of the Advantages and Disadvantages between the WMP and SPR-based Pathology to Imaging Correlation Methods
Imaging to Pathology
Correlation Approach Advantages Disadvantages
Whole mount processing (WMP)
Allows for improved precision and accuracy in imaging to pathology correlation
Mapping of nonfocal lesions may be possible
Pixel-level correlation and analysis may be possible
Enables volumetric assessment of lesion volume in histopathology
Modifications to the routine clinical workflow may be required (tissue processing protocols, ex vivo imaging, patient-specific mold processing)
Increased processing complexity and time (in our case, final pathology report could be delayed by up to 2 weeks when WMP processing was applied), without demonstrated immediate clinical benefit to the patient
Deformable registration is required to enable detailed mapping to imaging; no robust, cross-site validated, and widely available tools for such registration exist
Validation of registration between WMP and imag-ing is challengimag-ing
Surgical pathology report (SPR)
Ubiquitously available, provided by routine clinical workflows
May be sufficient for focal lesion localization in most cases
Cannot be used reliably for mapping all lesions in the gland
Reporting errors (eg, due to incorrect recording of the lesion location) are challenging to identify or correct retrospectively
Volumetric assessment of the lesion from histopa-thology is not possible
with MR were smaller than those estimated from WM histopathology.
ACKNOWLEDGMENTS
This work was supported by National Institutes of Health through grants U01CA151261, P41EB015898, R01CA111288. T.P. received a grant from RWTH Aachen University Hospital. The authors thank Louise Greenberg, M.Ed., and Sebastian Valentin for coordination of this study, and Sandeep Gupta and Ming-Ching Chang from GE Global Research for providing the OncoQuant research software prototype for use in this study.
REFERENCES
1.Hegde JV, Mulkern RV, Panych LP, et al. Multiparametric MRI of prostate cancer: an update on state-of-the-art techniques and their performance in detecting and localizing prostate cancer. J Magn Reson Imaging 2013; 37(5):1035–1054.
2.Dickinson L, Ahmed HU, Allen C, et al. Magnetic resonance imaging for the detection, localisation, and characterisation of prostate cancer: recom-mendations from a European consensus meeting. Eur Urol 2011; 59(4): 477–494.
3.Barentsz JO, Richenberg J, Clements R, et al. ESUR prostate MR guide-lines 2012. Eur Radiol 2012; 22(4):746–757.
4.Stamatakis L, Siddiqui MM, Nix JW, et al. Accuracy of multiparametric magnetic resonance imaging in confirming eligibility for active surveillance for men with prostate cancer. Cancer 2013;1–8.
5.Arumainayagam N, Ahmed HU, Moore CM, et al. Multiparametric MR im-aging for detection of clinically significant prostate cancer: a validation cohort study with transperineal template prostate mapping as the refer-ence standard. Radiology 2013; 268(3):761–769.
6.Heidenreich A, Bellmunt J, Bolla M, et al. EAU guidelines on prostate can-cer. Part I: screening, diagnosis, and treatment of clinically localised disease. Eur Urol 2011; 59(1):61–71.
7.Turkbey B, Mani H, Shah V, et al. Multiparametric 3T prostate magnetic resonance imaging to detect cancer: histopathological correlation using prostatectomy specimens processed in customized magnetic resonance imaging based molds. J Urol 2011; 186(5):1818–1824.
8.Langer DL, van der Kwast TH, Evans AJ, et al. Prostate tissue composition and MR measurements: investigating the relationships between ADC, T2, K(trans), v(e), and corresponding histologic features. Radiology 2010; 255(2):485–494.
9.Turkbey B, Mani H, Aras O, et al. Correlation of magnetic resonance im-aging tumor volume with histopathology. J Urol 2012; 188(4):1157–1163. 10.Mazaheri Y, Hricak H, Fine SW, et al. Prostate tumor volume measurement with combined T2-weighted imaging and diffusion-weighted MR: correla-tion with pathologic tumor volume. Radiology 2009; 252(2):449–457. 11.Fennessy FM, Fedorov A, Gupta SN, et al. Practical considerations in T1
mapping of prostate for dynamic contrast enhancement pharmacokinetic analyses. Magn Reson Imaging 2012; 30(9):1224–1233.
12.Tofts PS, Brix G, Buckley DL, et al. Estimating kinetic parameters from contrast-enhanced T1-weighted MRI of a diffusable tracer: standardized quantities and symbols. J Magn Reson Imaging 1999; 10(3):223–232. 13.De Bazelaire CMJ, Duhamel GD, Rofsky NM, et al. MR imaging relaxation
times of abdominal and pelvic tissues measured in vivo at 3.0 T: prelimi-nary results. Radiology 2004; 230(3):652–659.
14.Carr JC, Carroll TJ. Magnetic resonance angiography: principles and ap-plications. Springer; 2011.
15.Fritz-Hansen T, Rostrup E, Larsson HB, et al. Measurement of the arterial concentration of Gd-DTPA using MRI: a step toward quantitative perfusion imaging. Magn Reson Med 1996; 36(2):225–231.
16.Weinmann HJ, Laniado M, M€utzel W. Pharmacokinetics of GdDTPA/dime-glumine after intravenous injection into healthy volunteers. Physiol Chem Phys Med NMR 1984; 16(2):167–172.
17.Priest AN, Gill AB, Kataoka M, et al. Dynamic contrast-enhanced MRI in ovarian cancer: initial experience at 3 tesla in primary and metastatic dis-ease. Magn Reson Med 2010; 63(4):1044–1049.
18.Trivedi H, Turkbey B, Rastinehad AR, et al. Use of patient-specific MRI-based prostate mold for validation of multiparametric MRI in localization of prostate cancer. Urology 2012; 79(1):233–239.
19.Fedorov A, Beichel R, Kalpathy-Cramer J, et al. 3D Slicer as an image computing platform for the Quantitative Imaging Network. Magn Reson Imaging 2012; 30(9):1323–1341.
20.Jonmarker S, Valdman A, Lindberg A, et al. Tissue shrinkage after fixation with formalin injection of prostatectomy specimens. Virchows Arch 2006; 449(3):297–301.
21.Wolters T, Roobol MJ, van Leeuwen PJ, et al. A critical analysis of the tumor volume threshold for clinically insignificant prostate cancer using a data set of a randomized screening trial. J Urol 2011; 185(1): 121–125.
22.Stamey TA, Freiha FS, McNeal JE, et al. Localized prostate cancer. Rela-tionship of tumor volume to clinical significance for treatment of prostate cancer. Cancer 1993; 71(3 Suppl):933–938.
23.Zou KH, Warfield SK, Bharatha A, et al. Statistical validation of image seg-mentation quality based on a spatial overlap index. Acad Radiol 2004; 11(2):178–189.
24.Wang L, Mazaheri Y, Zhang J, et al. Assessment of biologic aggres-siveness of prostate cancer: correlation of MR signal intensity with Gleason grade after radical prostatectomy. Radiology 2008; 246(1): 168–176.
25.Wang XZ, Wang B, Gao ZQ, et al. Diffusion-weighted imaging of prostate cancer: correlation between apparent diffusion coefficient values and tu-mor proliferation. J Magn Reson Imaging 2009; 29(6):1360–1366. 26.Zelhof B, Lowry M, Rodrigues G, et al. Description of magnetic resonance
imaging-derived enhancement variables in pathologically confirmed pros-tate cancer and normal peripheral zone regions. BJU Int 2009; 104(5): 621–627.
27.Ren J, Huan Y, Wang H, et al. Dynamic contrast-enhanced MRI of benign prostatic hyperplasia and prostatic carcinoma: correlation with angiogen-esis. Clin Radiol 2008; 63(2):153–159.
28.Rud E, Klotz D, Rennesund K, et al. Detection of the index tumor and tumor volume in prostate cancer using T2W and DW MRI alone. BJU Int 2014; 114:E32–E42.
29.Le Nobin J, Orczyk C, Deng F-M, et al. Prostate tumor volumes: agreement between MRI and histology using novel co-registration software. BJU Int 2014; 114:E105–E112.
30.Cornud F, Khoury G, Bouazza N, et al. Tumor target volume for focal ther-apy of prostate cancer-does multiparametric magnetic resonance imaging allow for a reliable estimation? J Urol 2014; 191(5):1272–1279. 31.Ward AD, Crukley C, McKenzie CA, et al. Prostate: registration of digital
histopathologic images to in vivo MR images acquired by using endorectal receive coil. Radiology 2012; 263(3):856–864.
32.Meyer C, Ma B, Kunju LP, et al. Challenges in accurate registration of 3-D medical imaging and histopathology in primary prostate cancer. Eur J Nucl Med Mol Imaging 2013; 40(Suppl 1):S72–S78.
33.Hollenbeck BK, Bassily N, Wei JT, et al. Whole mounted radical prostatec-tomy specimens do not increase detection of adverse pathological fea-tures. J Urol 2000; 164(5):1583–1586.
34.Noguchi M, Stamey TA, McNeal JE, et al. Prognostic factors for multifocal prostate cancer in radical prostatectomy specimens: lack of significance of secondary cancers. J Urol 2003; 170(2 Pt 1):459–463.
35.Wise AM, Stamey TA, McNeal JE, et al. Morphologic and clinical signifi-cance of multifocal prostate signifi-cancers in radical prostatectomy specimens. Urology 2002; 60(2):264–269.
36.Kozlowski P, Chang SD, Jones EC, et al. Combined diffusion-weighted and dynamic contrast-enhanced MRI for prostate cancer diagnosis–corre-lation with biopsy and histopathology. J Magn Reson Imaging 2006; 24(1): 108–113.
37.Epstein JI, Walsh PC, Sauvageot J, et al. Use of repeat sextant and tran-sition zone biopsies for assessing extent of prostate cancer. J Urol 1997; 158(5):1886–1890.
38.Stroumbakis N, Cookson MS, Reuter VE, et al. Clinical significance of repeat sextant biopsies in prostate cancer patients. Urology 1997; 49(3A Suppl):113–118.
39.Svetec D, McCabe K, Peretsman S, et al. Prostate rebiopsy is a poor sur-rogate of treatment efficacy in localized prostate cancer. J Urol 1998; 159(5):1606–1608.