AN EVOLUTIONARY ALGORITHM FOR FAST INTENSITY BASED IMAGE
MATCHING BETWEEN OPTICAL AND SAR SATELLITE IMAGERY
P. Fischer1,∗, P. Schuegraf2, N. Merkle1, T. Storch1 1
Remote Sensing Technology Institute, German Aerospace Center (DLR), M¨unchener Str. 20, 82234 Wessling, Germany -(Peter.Fischer, Nina.Merkle, Tobias.Storch)@dlr.de
2
Dept. of Scientific Computing, University of Applied Science Munich, Lothstr. 20, Munich, Germany - [email protected] Commission III, WG III/6
KEY WORDS:Evolutionary Algorithm, Image Matching, Tie Point Search, Multi-Sensor Matching, Co-Registration
ABSTRACT:
This paper presents a hybrid evolutionary algorithm for fast intensity based matching between satellite imagery from SAR and very high-resolution (VHR) optical sensor systems. The precise and accurate co-registration of image time series and images of different sensors is a key task in multi-sensor image processing scenarios. The necessary preprocessing step of image matching and tie-point detection is divided into a search problem and a similarity measurement. Within this paper we evaluate the use of an evolutionary search strategy for establishing the spatial correspondence between satellite imagery of optical and radar sensors. The aim of the proposed algorithm is to decrease the computational costs during the search process by formulating the search as an optimization problem. Based upon the canonical evolutionary algorithm, the proposed algorithm is adapted for SAR/optical imagery intensity based matching. Extensions are drawn using techniques like hybridization (e.g. local search) and others to lower the number of objective function calls and refine the result. The algorithm significantely decreases the computational costs whilst finding the optimal solution in a reliable way.
1. INTRODUCTION
Over the last decades we observe an ever increasing number of satellites delivering optical high- (HR) and very high-resolution (VHR) imagery (Belward and Skien, 2015). This situation serves as catalyst for the development and application of a broad range of methodologies in the domain of Change Detection, Mosaiking, Classification and Multi-Temporal Image Analysis. The combi-nation of aerial imagery acquired by one or several sensors of-fers possibilities by means of image interpretation and classifica-tion (S¨orgel et al., 2017). The highly accurate co-registraclassifica-tion of the imagery is a necessity, misregistration lead to unreliable and error-prone results (Townshend et al., 1992) (Dai and Khorram, 1998) (Sundaresan et al., 2007).
The absolute geo-location accuracy of optical ortho-images de-pends on several factors, e.g. the satellite orbit determination and the instrument position estimation. The first can be solved within the decimeter range, the resulting influence is almost in the same range as the position estimation. For the second this holds not true, due to the long baseline even small errors in the instrument attitude and thermally influenced mounting angle estimation can lead to geo-location errors in the magnitude of up to several me-ters. Therefor ground control information remains a necessity for reaching high absolute geometric accuracies (Reinartz et al., 2011).
Due to the nature of SAR systems, the instruments attitude de-termination has no influence on the absolute geometric accuracy of the orthorectified SAR image. The co-registration of opti-cal and SAR imagery is therefor recognized as an adequate way to improve the absolute geometric accuracy of optical imagery
∗Corresponding author: +49 81 53 28 15 61
and minimize image misalignment errors (Reinartz et al., 2011) (Merkle et al., 2015) (Perko et al., 2011).
Tie points between the optical and SAR image need to be iden-tified in order to enable later on a geometric transformation and therefor the co-registration of the optical image which leads to a raise by means of absolute geometric accuracy. Establishing the necessary correspondence between the two images can done by intensity-based approaches and feature-based approaches (Zi-tov and Flusser, 2003). Intensity-based approaches rely on the comparison of raw pixel values, which is problematic to a cer-tain degree when it comes to inter-sensor matching. SAR and optical systems are distinguished by (a) being active and pas-sive systems, (b) recording signals in different wavelength do-mains (c) with different imaging geometries. The first leads to almost equal response signals for SAR systems independent from weather conditions and image acquisition time in contrast to op-tical systems where the state of the atmosphere (water vapor con-tent) and image acquisition time (illumination conditions due to season and day-time) strongly influence the image product. The second influences the characteristic of the recorded signal, SAR systems are known for being mostly sensitive to the physical con-ditions (e.g. surface roughness) whereas optical systems mainly describe the chemical properties (due to absorption/reflectance) of the illuminated entities by means of spectroscopy (S¨orgel et al., 2017). Different imaging geometries mentioned third limits for instance the usage of in principal well defined 3D objects with significant borders (e.g.. buildings), as the different viewing per-spectives lead to different depictions in 2D image plane the taller the object is. Nevertheless it’s possible to establish a statistical measure of similarity given somehow comparable image content. Mutual Information giving a statistical measurement of depen-dence between two sets has proven to be suitable for resolving the inter-sensor similarity measurement under certain circumstances
in the domain of remote sensing (Siddique et al., 2012) (Suri and Reinartz, 2010) mainly overcoming the differences in the opti-cal and SAR image related to systematic differences between the sensor systems (e.g. wavelength/bandwidth and passive versus active system). Roundabouts have already been used successfully combining several advantageous features for inter-sensor match-ing. They are rotation-invariant, they are almost planar which leads to low projective effects (lowering influence of difference in imaging geometry) and most important as paved roads are of-ten surrounded by vegetation they are easily to identify in optical images because of the color change and in SAR images because of the changing Signal-to-Clutter ratio.
The need for developing fast and efficient algorithms for image matching between optical and SAR images is therefor given, as resolving misalignment errors by co-registration is recognized as not just beneficial but as a prerequisite for almost every later on conducted evaluation. Special attraction is given to fully auto-mated algorithms which minimize the time-consuming process of tie-point localization (Scheffler et al., 2017). Intensity-based algorithms, which can be considered to be template matching algorithms, are often computationally expensive (Merkle et al., 2017). The main components of such algorithms are (a) search and (b) compare, where (a) means exploring a given region in im-age space and (b) deals with computing a quantitative similarity measure between two image regions.
Whilst extensive research has been done in the domain of de-veloping fast and efficient similarity measurement functions, the search for tie-points is in most cases implemented as a simple moving-window approach. As remote sensing data are in most cases distributed as georefereced datasets, the size of the search space has to consider the spatial offset between the SAR and the optical image and furthermore the absolute pointing accuracy of both sensor systems. This situation leads to a search space with an absolute size of several tens of square meters. Given the sub-meter resolution of the SAR and optical system, several hundreds of times the similarity function has to be called in order to find the best matching position.
Evolutionary Algorithms have proven their ability to overcome this drawback by means of minimizing computational costs in template matching (Cuevas et al., 2013) (Cuevas et al., 2017) (Oliva et al., 2014). A smart search strategy balancing explo-ration and exploitation of the search space lowers the number of similarity function calls thus lowering computational costs. In this paper we adapt the canonical evolutionary algorithm for finding tie points between SAR and optical remote sensing im-agery. The goal is to significantly reduce computational costs of the search whilst ensuring reliable and stable search results. In section 2 a detailed description of the algorithm and the data pre-processing is given. Section 3 describes the experiments carried out and gives the results. Section 4 concludes with giving a short perspective on possible next steps in the refinement of the pro-posed algorithm.
2. ALGORITHM
The aim of the algorithm is to solve the search for the global max-imum of a given function within the borders of a search space de-fined by the size of two georeferenced overlapping images, where the two (optical/SAR) sets of pixel values serve as independent parameters of the objective function. The raw image patches are currently manually pre-selected and passed as parameters. The
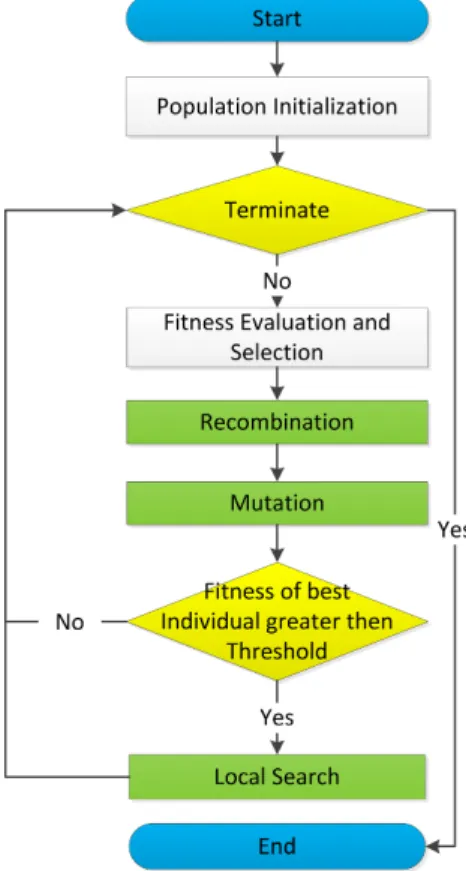
search algorithm follows the design of the canonical Evolution-ary Algorithm (EA) (Zhang et al., 2011). After initializing a pop-ulation of solution candidates and assigning fitness values using a suitable objective and fitness function to these individuals, an evolution process is applied leading the population to converge towards the formulated optimum. The algorithm is combined with a local search algorithm, as such a hybridization of EAs which is also known as Memetic Algorithm has been proven to be beneficial (Ong et al., 2010). Historical search experiences are incorporated by using a look-up table for positions already inves-tigated in search space. Figure 1 depicts the iterative sequential operations of the algorithm.
Figure 1. Algorithm description
The EA needs to be adapted for the specific problem domain of template matching using SAR and optical remote sensing im-agery. In the following we describe the used objective and fitness function, later on we give a brief view on the evolutionary oper-ators for selection, recombination and mutation. The operoper-ators of EAs rely on probabilities which are given as parameters. The performance of EAs is strongly influenced by the chosen param-eters, we give the used ones for the experiments in Table 1. The determination of an optimal parameter set (e.g. hyperparameter optimization) is a non trivial task and not the focus of this work. Therefor the used parameters were chosen by the authors expe-rience with the goal to enable moderate convergence in the later experiments of this paper. No further hyperparameter tuning was conducted. Parameter Value Recombination Rate 0.7 Mutation Rate 0.09 Selection Gap 70 % Population Size 50 Max. Nbr. of Generations 160 Table 1. Parameter Description of EA
2.1 Objective Function
The objective function has to yield a statement about the qual-ity of match between a subset of the optical image and a patch of the SAR image. As the signal recorded by an optical system differs fundamentally from the signal recorded by a SAR system, the objective function needs to be independent from units and the range of values. Mutual Information (MI) being a measure of the amount of information that one random set of measurements contains about another set of measurements suits well for our ap-plication (Cover and Thomas, 2006). The used objective function is therefor given in Equation 1, where MII(X;Y)is the relative entropy between the joint distribution and the product distribution p(x)p(y)of the optical and SAR image.
M I(X;Y) =X y∈Y X x∈X p(x, y) log( p(x, y) p(x)p(y)) (1) The usage of other objective functions for similarity measure-ment is possible. Mean absolute difference (MAD), normalized cross-correlation (NCC) and variations of the before mentioned are well established in template matching. However for the spe-cific optic to SAR matching problem the applicability of MI for giving a response about the dependency between an optical and a SAR image has been given by several publications, e.g. (Suri and Reinartz, 2010) and (Siddique et al., 2012).
2.2 Search Strategy
The search is formulated as an optimization problem where the goal is to find the position (u, v)∗ of the global maximum of Equation 1 in search space given two independent sets of pixel valuesx∈Xandy∈Y, therefor the goal is given with
(u, v)∗= argmax
x∈X,y∈Y
M I(x, y) (2)
2.2.1 Fitness Function The higher the MI value of an indi-vidual, the higher its fitness. Due to the nature of the objective function and the specific input of SAR and optical image pixel values, the raw MI values cannot be simply translated into a fit-ness value suitable for an evolutionary algorithm. Only limited assumptions can be made about the value and range of the com-puted MI values resulting from the comparision of an optical and a SAR image. To overcome this issue a rank-based fitness assign-ment is used where the range of the fitness values is given by the size of the population. Having a population withnindividuals the individual with the highest MI value of the population gets ranknwhereas the unfittest individual gets rank1.
2.2.2 Selection The determination of individuals used for breeding is realized by a roulette wheel selection. The proba-bility of selection of an individual is given by the ratio between the individuals fitness value and the cumulative sum of all fit-ness values of the population. For instance within a population of five individuals the fittest individual has a selection probability of 1/3whereas the unfittest individual has a selection probability of 1/15.
2.2.3 Recombination The recombination of two individuals is realized in an uniform rectangular fashion. Given two in-dividuals xi and xi+1, the rectangular space is spanned by the row/column-coordinates of both individuals. The crossover points within this space are determined independently by a ran-dom uniform distribution.
2.2.4 Mutation The aim of the mutation is to enable small jumps within the search space preventing the algorithm to get stuck in a local optimum. The mutation operator adds to the row-and column-coordinates a rrow-andom value. The rrow-andom value is determined by using a normal distribution.
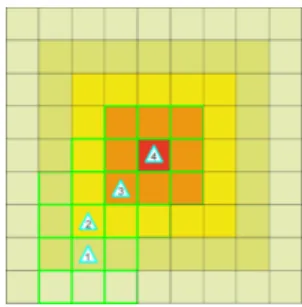
2.2.5 Local Search We use steepest ascent hillclimbing. For the 8 neighbors of the fittest individual the objective function is evaluated in a clockwise fashion. If one of the 8 neighboring positions gives a higher MI value, the position of the individ-ual is shifted to this new position. The local search is repeated until there is no more significant raise in the MI value. Figure 2 illustrates this process. The given raster size is 9 rows times 9 columns. The pixel colormap raises from bright green to dark red, where the colors correspond to low and high MI respectively. The maximum is at the center of the raster. The white triangles with cyan borders show for each iteration of the hillclimbing al-gorithm the current position. The pixels with bright green corners are the ones for which the MI is computed.
Figure 2. Hillclimbing for finding local maximum Using such a local search algorithm ensures to find the global maximum if one individual is already in the close neighbourhood of the optimum.
2.2.6 Population Memory Due to the dynamic behaviour of population based search algorithms in conjunction with a grid-spaced search space it can happen that a position in search space is evaluated by different individuals during the search process. This leads to unneccesary computational costs. To overcome this, all positions in search space already evaluated are stored in a pop-ulation memory (e.g. Lookup-Table) in combination with the cor-responding objective function value.
2.2.7 Termination Criterion The algorithm terminates given no change in the sum of theM Ivalues of thenfittest population member overmiterations. In the following Section 3 the influ-ence of this two parameters on success rate and computational costs of the algorithm are discussed.
3. EXPERIMENTS AND RESULTS 3.1 Sample Data
The experiments were carried out with three different data sources which are overlapping.
• Two optical images acquired by the WorldView-2 (WV-2) and the Quickbird (QB) satellite having a spatial resolution of 0.5m and 0.6m respectively and
• one radar image recorded by the German TerraSAR-X (TSX) satellite having a spatial resolution of 0.5m.
As the three images raster grids are shifted towards each other by a subpixel magnitude, the images were resampled using near-est neighbor algorithm. The smallnear-est common denominator for reaching a common pixel grid spacing between WV-2 and TSX was 0.25m and for QB and TSX it was 0.05m.
Figure 3 to 8 give a major view an all issues related to the used data. In the WV-2 scene four roundabouts were determined which can visually also be identified in the TSX scene. Figure 3, 4, 5 and 6 depict subsets of the Worldview-2 scene and the corre-sponding TerraSAR-X data. Two roundabouts can be identified in the Quickbird scene, Figure 7 and 8 show subsets of the QB scene including these roundabouts and their TSX counterparts. The four columns (a, b, c, d) of the aforementioned Figures show from left to right:
• A subset of the optical satellite image (e.g. WV-2, QB) where in transparent cyan the region used for the search is highlighted. The roundabout is marked in transparent green, the center of the roundabout is marked with a green dot.
• The corresponding image slice of the TSX image. The search patch is also highlighted in cyan, the manually deter-mined roundabout position is marked with a red circle and a red dot as centroid.
• The optical image with the search space highlighted in cyan and the roundabout colored in green, the bounding box of the TSX patch is shown in red, the position of the round-about in the TSX image is shown by a red transparent circle.
• The MI image of the search space - the size is given by the size of the subset in the optical image minus the patch of the SAR image. The colormap goes from dark blue (low MI) to dark red (high MI).
At the data preparation stage we recognized that in two of the six experiments the expected matching position was not the global maximum of theM Ifunction, see Figure 5 (d) and 6 (d). As the formulation of the objective function is not the scope of this paper and as such behavior is known to be a drawback of all similar-ity measurement based matching methods, the experiments were carried out ignoring this unsatisfying situation.
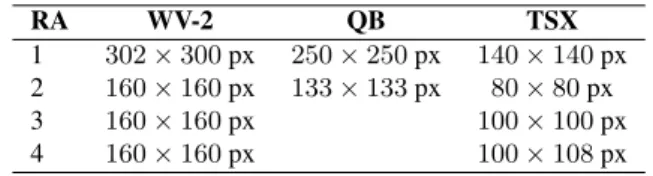
Table 2 gives a description about the cyan image slice sizes of the optical WV-2 and QB scene and the corresponding TSX patch size. RA WV-2 QB TSX 1 302×300px 250×250px 140×140px 2 160×160px 133×133px 80×80px 3 160×160px 100×100px 4 160×160px 100×108px
Table 2. Image Description 3.2 Experiment Description
The goal of the experiments is to proof that an EA can lower the computational costs for finding tie points between an optical and a SAR image using template matching. Six experiments are carried out as four rotaries are identified in the WV-2 and the TSX scene and two rotaries can be found in both the QB and the TSX scene. The computational costs are measured by means of objective function calls. A moving window algorithm calls the
objective function for each position in the search space to find the maximum MI value, which is then expected to be the best matching position. The number of possible positions in the search space is given by the search space size in the optical image minus the SAR patch size. In Table 3 the last column gives for the six experiments the number of function calls if the full search space would be exploited using a moving window approach.
After initialization using the parameters given in Table 1 the aim of the algorithm is to find the maximum MI position in the search space. Each individual of the population represents a solution candidate, the number of objective function calls is counted. The total number of objective function calls is given by the sum of
• the initial calls - one for each individual, thus 50 for the whole population
• the calls for the offspring evaluation within each new gen-eration, for instance a population size of 50 individuals and a selection gap of 0.7 leads to a maximum of 35 calls per iteration, the number can be lower having the informa-tion about already evaluated posiinforma-tions in search space via Lookup-Table at hand
• and the additional extra costs for the local search carried out by the fittest population member, an iterative process needing 8 calls per iteration (here also the Lookup-Table is used for lowering computational costs if possible.
Two different criterions for termination of the algorithm are used in the following experiments. (a) we compute the global maxi-mum beforehand and terminate the algorithm immediately after reaching this value and (b) the algorithm is terminated after a cer-tain time of no progress. Details concerning both scenarios are given in subsection 3.3.
Besides of this the number of times the search algorithm succeeds is determined. For this experimental setting the true maximum value was computed beforehand.
As Evolutionary Algorithms are Heuristics we follow the law of the big number to get a stable measure about the performance of the algorithm. Each experiment is repeated 1000 times.
3.3 Algorithm Performance
The algorithm performance was measured using two different scenarios. In Scenario A the algorithm is terminated immedi-ately after reaching the global optimum. This scenario indicates whether the algorithm converges at what speed and whether the usage of EA for the given search problem is beneficial by means of lowering computational costs. Scenario B deals with the iden-tification of a suitable termination criterion. Obviously the al-gorithm has to stop when no more progress can be measured. Progress is measured by measuring the cumulative sum of the MI value of thenbest individuals and comparing this value to the value reached in previous iterations. Does the value remain sta-ble overmiterations the algorithm stops. The determination of suitable parameters fornandmhaving the goal of high success rate and low computational costs in mind is the topic of Scenario B.
(a) (b) (c) (d) Figure 3. Roundabout 1 (a) WorldView 2, (b) TerraSAR-X, (c) Overlay, (d) MI Search Space
(a) (b) (c) (d)
Figure 4. Roundabout 2 (a) WorldView 2, (b) TerraSAR-X, (c) Overlay, (d) MI Search Space
(a) (b) (c) (d)
Figure 5. Roundabout 3 (a) WorldView 2, (b) TerraSAR-X, (c) Overlay, (d) MI Search Space
(a) (b) (c) (d)
Figure 6. Roundabout 4 (a) WorldView 2, (b) TerraSAR-X, (c) Overlay, (d) MI Search Space
(a) (b) (c) (d)
Figure 7. Roundabout 1 (a) QuickBird, (b) TerraSAR-X, (c) Overlay, (d) MI Search Space
(a) (b) (c) (d)
3.4 Scenario A - Optimum known
The results of the experiments where the algorithm was termi-nated immediately after reaching the global optimum are given in Table 3. The search algorithm always succeeds in three of the six experiments, in one experiment the search was nearly al-ways conducted successfully (>99.99%). The average number of function calls of these four experiments is in all cases signif-icantly lower than if the whole search space would be explored. For roundabout one and three in the WV-2 scene the number of function calls is lowered to just1.92%and5.1%in comparison to the moving window approach. This significance holds also true for both rotaries in the QB scene, where just3.06%respectively 17.51%of the maximum number of function calls are necessary. For roundabout two in the QB scene the somehow low perfor-mance is explained by the anyhow small search space.
For roundabout two and four in the WV-2 scene the success rate did not achieve100%. The given results with approx. 96.8% and93.8%are nevertheless promising. As the average number of function calls includes the experiments with no success it’s not surprising that the percentage raises to12.86%and16.49% respectively. The lower performance in this two cases can be ex-plained by the more complex nature of the search space. In Figure 3 to 8 the right column (d) shows the fully exploited search space by means of MI values. In the four cases the algorithm succeeded with almost100%the given situation is almost univariate. In Fig-ure 4 and 6 the situation is not that clear which leads obviously to a decrease in the overall success rate and an increase in the average sum of objective function calls.
Sensor RA Success Rate Ave. calls Max. calls
WV-2 1 100 % 497.2 25920 WV-2 2 96.8 % 823.14 6400 WV-2 3 100 % 183.83 3600 WV-2 4 93.8% 514.64 3120 QB 1 100 % 370.39 12100 QB 2 99.99 % 491.8 2809
Table 3. Experimental Results, Termination of Algorithm given true Optimum
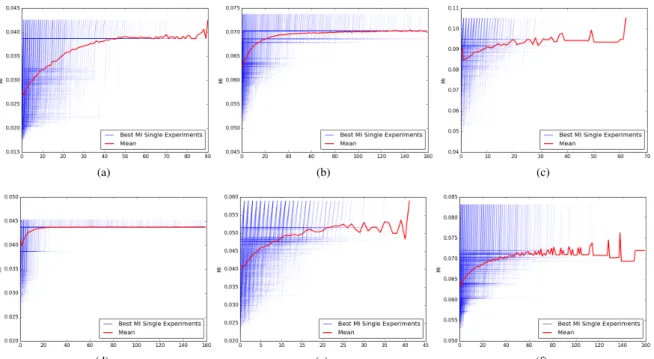
Figure 9 and 10 show the convergence behavior of the algorithm for the six experiments where Figure 9 depicts the MI value of the fittest population member on the y-axis and the generation number on the x-axis and Figure 10 visualizes the mean MI value of the population on the y-axis and the generation number on the x-axis. Each line represents one experiment, thus 1000 lines are drawn per plot. The opacity of the lines is5%- the general behav-ior is highlighted, unexpected behavbehav-ior is still visible. The mean MI value in both plots is given as red line. Both plots give the proof that the algorithm converges towards the global optimum in a robust and reliable manner.
3.5 Scenario B - Optimum unknown
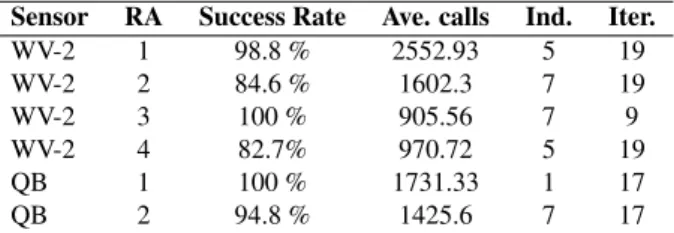
Table 4 gives the results for the experiments where the real opti-mum value was unknown beforehand. The success rate decreased in the mean about 5 % where a strong variability of the decrease throughout the experiments is observed. The average number of function calls increased like expected for all experiments. The last two rows of Table 4 gives the number of fittest individuals and the number of iterations for which no increase in MI was measured until stopping the search. A grid search was done to approximate the best values for this two parameters where the
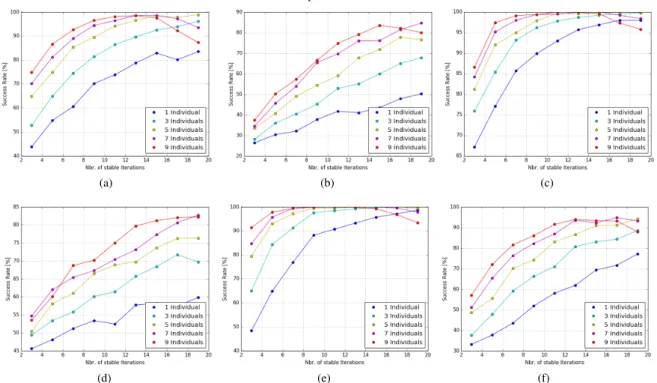
number of individuals was1,3,5,7,9and the number of iter-ations was3,5,7,9,11,13,15,17,19. As Figure 11 shows is the average number of function calls during search strongly de-pending on this two parameters. For both parameters the less the better one might say. The counterpart position is proposed when it comes to the average success rate. Figure 12 clearly indicates that the overall success of the search is the better the more indivi-uals are taken into account in measuring search progress and the longer no more progress is measured.
Sensor RA Success Rate Ave. calls Ind. Iter.
WV-2 1 98.8 % 2552.93 5 19 WV-2 2 84.6 % 1602.3 7 19 WV-2 3 100 % 905.56 7 9 WV-2 4 82.7% 970.72 5 19 QB 1 100 % 1731.33 1 17 QB 2 94.8 % 1425.6 7 17
Table 4. Experimental Results - Optimum Unknown
4. CONCLUSION
An algorithm is proposed which is capable of finding tie points between optical and SAR images. The aim of the algorithm is to reduce significantly the computational costs of the search pro-cess. Given the results of the experiments we have the proof that the application of the proposed search algorithm is in most cases beneficial. EAs and their operators rely on probabilities which are given as parameters. In the future our goal is to adapt the oper-ators for the specific problem domain of finding spatially shifted image patches within a multi-sensor environment. Besides of this the algorithm should also be extended by using established tech-niques which help to reduce the computational costs further. Sev-eral generic versions of EAs have been published during the last decade which outperform the canonical one. We found out that basic MI is not that robust in delivering the optimal matching po-sition than expected. The adaption or even development of a new more reliable objective function is not the scope of this work -however in the future we will evaluate the usage of other more sophisticated functions. As the intensity-based similarity mea-sure between optical and SAR imagery was identified to be the major drawback of our approach, we want to evaluate the usage of EAs searching for geometric features like circles directly in the future. This would probably overcome the issues identified during this research project.
REFERENCES
Belward, A. S. and Skien, J. O., 2015. Who launched what, when and why; trends in global land-cover observation capacity from civilian earth observation satellites. ISPRS Journal of Pho-togrammetry and Remote Sensing103(Supplement C), pp. 115 – 128. Global Land Cover Mapping and Monitoring.
Cover, T. and Thomas, J., 2006.Elements of Information Theory. John Wiley and Sons.
Cuevas, E., Echavarra, A., Zaldvar, D. and Prez-Cisneros, M., 2013. A novel evolutionary algorithm inspired by the states of matter for template matching. Expert Systems with Applications
40(16), pp. 6359 – 6373.
Cuevas, E., Osuna, V. and Oliva, D., 2017. Template Matching. Springer International Publishing, Cham, pp. 65–93.
Dai, X. and Khorram, S., 1998. The effects of image misreg-istration on the accuracy of remotely sensed change detection.
(a) (b) (c)
(d) (e) (f)
Figure 9. MI value of fittest individual for WV-2 (Roundabout 1 (a), 2 (b), 3 (c), 4 (d)) and QB (Roundabout 1 (e) and 1 (f)) experiments
(a) (b) (c)
(d) (e) (f)
Figure 10. Mean MI of population for WV-2 (Roundabout 1 (a), 2 (b), 3 (c), 4 (d)) and QB (Roundabout 1 (e) and 1 (f)) experiments
IEEE Transactions on Geoscience and Remote Sensing 36(5), pp. 1566–1577.
Merkle, N., Luo, W., Auer, S., Mller, R. and Urtasun, R., 2017. Exploiting deep matching and sar data for the geo-localization accuracy improvement of optical satellite images. Remote Sens-ing.
Merkle, N., M¨uller, R. and Reinartz, P., 2015. Registration of optical and sar satellite images based on geometric feature tem-plates. ISPRS - International Archives of the Photogramme-try, Remote Sensing and Spatial Information SciencesXL-1/W5, pp. 447–452.
Oliva, D., Cuevas, E., Pajares, G. and Zaldivar, D., 2014. Tem-plate matching using an improved electromagnetism-like algo-rithm.Applied Intelligence41(3), pp. 791–807.
Ong, Y. S., Lim, M. H. and Chen, X., 2010. Memetic computa-tion; past, present and future [research frontier].IEEE Computa-tional Intelligence Magazine5(2), pp. 24–31.
Perko, R., Raggam, H., Gutjahr, K. and Schardt, M., 2011. Using worldwide available terrasar-x data to calibrate the geo-location accuracy of optical sensors. In: 2011 IEEE International Geo-science and Remote Sensing Symposium, pp. 2551–2554. Reinartz, P., Mller, R., Schwind, P., Suri, S. and Bamler, R., 2011. Orthorectification of vhr optical satellite data exploiting the geo-metric accuracy of terrasar-x data.ISPRS Journal of Photogram-metry and Remote Sensing66(1), pp. 124 – 132.
Scheffler, D., Hollstein, A., Diedrich, H., Segl, K. and Hostert, P., 2017. Arosics: An automated and robust open-source image
(a) (b) (c)
(d) (e) (f)
Figure 11. Average number of function calls for WV-2 (Roundabout 1 (a), 2 (b), 3 (c), 4 (d)) and QB (Roundabout 1 (e) and 1 (f)) experiments
(a) (b) (c)
(d) (e) (f)
Figure 12. Success Rate for WV-2 (Roundabout 1 (a), 2 (b), 3 (c), 4 (d)) and QB (Roundabout 1 (e) and 1 (f)) experiments co-registration software for multi-sensor satellite data. Remote
Sensing.
Siddique, M. A., Sarfraz, M. S., Bornemann, D. and Hellwich, O., 2012. Automatic registration of sar and optical images based on mutual information assisted monte carlo. In:2012 IEEE Inter-national Geoscience and Remote Sensing Symposium, pp. 1813– 1816.
S¨orgel, U., Wegner, J. D. and Thiele, A., 2017.Fusion von optis-chen und Radardaten. Springer Berlin Heidelberg, Berlin, Hei-delberg, pp. 733–769.
Sundaresan, A., Varshney, P. K. and Arora, M. K., 2007. Robust-ness of change detection algorithms in the presence of registration errors. Photogrammetric Engineering & Remote Sensing73(4), pp. 375–383.
Suri, S. and Reinartz, P., 2010. Mutual-information-based reg-istration of terrasar-x and ikonos imagery in urban areas. IEEE Transactions on Geoscience and Remote Sensing48(2), pp. 939– 949.
Townshend, J. R. G., Justice, C. O., Gurney, C. and McManus, J., 1992. The impact of misregistration on change detection.
IEEE Transactions on Geoscience and Remote Sensing 30(5), pp. 1054–1060.
Zhang, J., h. Zhan, Z., Lin, Y., Chen, N., j. Gong, Y., h. Zhong, J., Chung, H. S. H., Li, Y. and h. Shi, Y., 2011. Evolutionary com-putation meets machine learning: A survey.IEEE Computational Intelligence Magazine6(4), pp. 68–75.
Zitov, B. and Flusser, J., 2003. Image registration methods: a survey.Image and Vision Computing21(11), pp. 977 – 1000.