LIDARPHENO: A LOW-COST LIDAR-BASED 3D SCANNING SYSTEM
FOR PLANT MORPHOLOGICAL TRAIT CHARACTERIZATION
A Thesis Submitted to the College of Graduate and Postdoctoral Studies In Partial Fulfillment of the Requirements
For the Degree of Master of Science
In the Department of Electrical and Computer Engineering University of Saskatchewan
Saskatoon, SK, Canada
By
KARIMALI PANJVANI
i
Permission to Use
In presenting this thesis in partial fulfillment of the requirements for a Postgraduate degree from the University of Saskatchewan, I agree that the Libraries of this University may make it freely available for inspection. I further agree that permission for copying of this thesis in any manner, in whole or in part, for scholarly purposes may be granted by the professor or professors who supervised my thesis work or, in their absence, by the Head of the Department or the Dean of the College in which my thesis work was done. It is understood that any copying or publication or use of this thesis or parts thereof for financial gain shall not be allowed without my written permission. It is also understood that due recognition shall be given to me and to the University of Saskatchewan in any scholarly use which may be made of any material in my thesis.
Requests for permission to copy or to make other uses of materials in this thesis/dissertation in whole or part should be addressed to:
Head of the Department of Electrical and Computer Engineering 57 Campus Drive
University of Saskatchewan
Saskatoon, Saskatchewan S7N 5A9 Canada
OR Dean
College of Graduate and Postdoctoral Studies University of Saskatchewan
116 Thorvaldson Building, 110 Science Place Saskatoon, Saskatchewan S7N 5C9
Canada
Disclaimer
Reference in this thesis to any specific commercial products, process, or service by trade name, trademark, manufacturer, or otherwise, does not constitute or imply its endorsement, recommendation, or favoring by the University of Saskatchewan. The views and opinions of the author expressed herein do not state or reflect those of the University of Saskatchewan and shall not be used for advertising or product endorsement purposes.
ii
Abstract
The ever-growing world population brings the challenge for food security in the current world. The gene modification tools have opened a new era for fast-paced research on new crop identification and development. However, the bottleneck in the plant phenotyping technology restricts the alignment in Geno-pheno development as phenotyping is the key for the identification of potential crop for improved yield and resistance to the changing environment. Various attempts to making the plant phenotyping a “high-throughput” have been made while utilizing the existing sensors and technology. However, the demand for ‘good’ phenotypic information for linkage to the genome in understanding the gene-environment interactions is still a bottleneck in the plant phenotyping technologies. Moreover, the available technologies and instruments are inaccessible, expensive and sometimes bulky.
This thesis work attempts to address some of the critical problems, such as exploration and development of a low-cost LiDAR-based platform for phenotyping the plants in-lab and in-field. A low-cost LiDAR-based system design, LiDARPheno, is introduced in this thesis work to assess the feasibility of the inexpensive LiDAR sensor in the leaf trait (length, width, and area) extraction. A detailed design of the LiDARPheno, based on low-cost and off-the-shelf components and modules, is presented. Moreover, the design of the firmware to control the hardware setup of the system and the user-level python-based script for data acquisition is proposed. The software part of the system utilizes the publicly available libraries and Application Programming Interfaces (APIs), making it easy to implement the system by a non-technical user.
The LiDAR data analysis methods are presented, and algorithms for processing the data and extracting the leaf traits are developed. The processing includes conversion, cleaning/filtering, segmentation and trait extraction from the LiDAR data. Experiments on indoor plants and canola plants were performed for the development and validation of the methods for estimation of the leaf traits. The results of the LiDARPheno based trait extraction are compared with the SICK LMS400 (a commercial 2D LiDAR) to assess the performance of the developed system.
Experimental results show a fair agreement between the developed system and a commercial LiDAR system. Moreover, the results are compared with the acquired ground truth as well as the commercial LiDAR system. The LiDARPheno can provide access to the inexpensive LiDAR-based scanning and open the opportunities for future exploration.
iii
Acknowledgments
I would like to thank my supervisors Prof. Khan A Wahid and Prof. Anh V Dinh. Their continued guidance, supervision and support has been invaluable for my program and this thesis work at the University of Saskatchewan.
I am grateful for the funding support, which made this work possible, from Canada First Research Excellence Fund (CFREF) managed and distributed by the Global Institute for Food Security (GIFS) at University of Saskatchewan.
I would like to extend my sincere gratitude and appreciat ion to our collaborator Dr. Scott Noble (Mechanical Engineering, University of Saskatchewan) and his group members, David Pastl and Tyrone Keep, for providing me with the commercial LiDAR and its libraries as well as the setup for in-laboratory experimentation. Moreover, their constant support and valuable feedback in this thesis have been of great help in the assessment of the developed system.
I would like to acknowledge Monica Thurlbeck for providing an opportunity to work at the retail service locations at the University of Saskatchewan, which helped me integrate into Canadian culture. I extend my sincere appreciation to Peyman Pourhaj (Dept.of ECE, University of Saskatchewan) for his guidance in some technical aspects of the system design. I thank all my friends in Canada and India for believing in me and being there all the time.
Finally, I cannot describe in words how grateful I am to my parents (Abdulsultan Panjwani and Nasim Panjwani), my siblings (Amin and Saniya), and my fiancée Kinjal Lakhani for their support in the times when I needed it most. All my accomplishments have only been possible due to their unconditional love, care, belief in me and the sacrifices they made for my studies.
iv
Dedication
Dedicated to the two women in my life, my mother (Nasim Panjvani) and my fiancée (Kinjal Lakhani), for their tremendous love, care, support and desire for my continued studies.
v Table of Contents Page Number Permission to Use i Abstract ii Acknowledgments iii Dedication iv Table of Contents v
List of Tables viii
List of Figures ix
List of Abbreviations xi
Chapter 1 Introduction 1
1.1 Global Food Security Challenges and Potential Solutions ... 1
1.2 Research Objectives ... 3
1.3 Thesis Organization ... 3
Chapter 2 Literature Review 5 2.1 The Term ‘Plant Phenotyping’ and its Need ... 5
2.2 Sensors and Imaging Technologies in Plant Phenotyping ... 6
2.2.1 Single Dimension (1D) Sensors in Plant Phenotyping ... 7
2.2.2 Visible Spectrum Imaging ... 7
2.2.3 Thermal Imaging ... 8
2.2.4 Imaging Spectroscopy ... 9
2.2.5 3-Dimensional (3D) Imaging ... 10
2.3 LiDAR-based 3D imaging in Plant Phenotyping ... 11
2.4 High-Throughput Plant Phenotyping Platforms ... 14
2.5 Need for Low-Cost Plant Phenotyping Sensors/Platforms ... 14
Chapter 3 Design and Development of LiDARPheno system 16 3.1 Design Requirements ... 16
3.2 Design of the Hardware for the System ... 17
vi
3.2.1.1 LiDAR-Lite v3 ... 19
3.2.2 Rotating Mechanism for the Scanner ... 20
3.2.3 Microcontroller and its Specifications ... 21
3.2.4 Raspberry Pi, a Camera Module, and their Specifications ... 23
3.2.4.1 A Raspberry Pi Camera Module ... 24
3.2.5 Power Module ... 24
3.2.6 Full Design of the Hardware and Wiring Diagram ... 25
3.3 Firmware for Arduino Uno ... 28
3.3.1 Scan Time: the Time Required for a Single Scan ... 30
3.4 A Software Program for Raspberry Pi and Data Formats for LiDAR Raw Data ... 32
3.5 Power Consumption Analysis for LiDARPheno ... 34
3.6 Summary of the Hardware Cost ... 35
Chapter 4 Experimental Setup and Data Acquisition 37 4.1 Materials Used for the Experiments ... 37
4.1.1 Plant Material ... 37
4.1.2 High-Resolution Commercial 2D LiDAR ... 38
4.1.3 Document Scanner ... 40
4.2 Experimental Setup ... 41
4.2.1 Experimental Setup for LMS400 ... 41
4.2.2 Experimental Setup for LiDARPheno ... 42
4.3 Data Acquisition ... 43
4.3.1 Data Acquisition using LMS400 ... 43
4.3.2 Data Acquisition using LiDARPheno ... 45
4.3.3 Ground Truth Data Acquisition ... 46
4.4 Data Formats ... 47
Chapter 5 Data Analysis/Post-Processing 49 5.1 LiDAR Raw Data ... 49
5.2 Conversion to Cartesian coordinate system ... 51
5.3 Background Removal ... 52
vii
5.4.1 Choosing parameters for Point Cloud Filtering algorithm ... 55
5.5 Point Cloud Segmentation ... 57
5.6 Leaf Trait Extraction ... 59
5.6.1 Leaf Length ... 59
5.6.2 Leaf Width ... 61
5.6.3 Leaf Area ... 62
5.7 Parameters used in post-processing steps. ... 63
Chapter 6 Results and Discussion 64 6.1 Leaf Number Annotation ... 64
6.2 Trait Extraction Results ... 65
6.2.1 Leaf Length Estimation Results ... 66
6.2.1.1 Experiment 1 Leaf Length Estimation Results ... 66
6.2.1.2 Experiment 2 Leaf Length Estimation Results ... 68
6.2.1.3 Estimation and Ground Truth Leaf Length Relation ... 69
6.2.2 Leaf Width Estimation Results ... 71
6.2.2.1 Results for Leaf Width Extraction ... 71
6.2.2.2 Estimation and Ground Truth Leaf Width Relation ... 73
6.2.3 Leaf Area Estimation Results ... 74
6.2.3.1 Results for Leaf Area Estimation ... 74
6.2.3.2 Estimation and Ground Truth Leaf Area Relation ... 76
6.3 Comparing LiDARPheno and LMS400 Derived Results ... 77
Chapter 7 Conclusion and Recommendations for the Future Work 82 7.1 Conclusion ... 82
7.2 Recommendations for the Future Work ... 83
7.2.1 Limitations and improvement suggestions: ... 84
viii
List of Tables
Page Number
Table 3-1: Comparison of the low-cost LiDAR sensors ... 18
Table 3-2: Specification of the Arduino Uno Rev3 ... 22
Table 3-3: Power consumption analysis of individual devices of the LiDARPheno ... 35
Table 3-4: Summary of the hardware cost for the LiDARPheno system ... 36
Table 6-1: Leaf length estimation results for an arbitrary wild plant ... 66
Table 6-2: Leaf length estimation results for the Experiment 1 ... 67
Table 6-3: Results of leaf length estimation on Canola plants. ... 68
Table 6-4: Results of experiment 2 – part “b” on Canola Plant 3 ... 69
Table 6-5: Leaf width estimation results using LiDARPheno (LP) and LMS400 (LMS) ... 71
Table 6-6: Results of Leaf width estimation on canola plants – experiment 2 ... 72
Table 6-7 : Results of leaf width estimation at a different height ... 72
Table 6-8: Leaf Area estimation results using LiDARPheno (LP) and LMS400 (LMS) ... 74
Table 6-9: Results of leaf area estimation on canola plants – experiment 2... 75
Table 6-10: Results of leaf area estimation at a different height ... 75
ix
List of Figures
Page Number
Figure 2-1: The fundamental operating principle of the LiDAR ... 11
Figure 3-1: Basic architecture of the system ... 17
Figure 3-2: LiDAR-Lite v3 by Garmin Inc. (picture source: https://www.sparkfun.com) ... 19
Figure 3-3: Mechanical design of the scanning setup ... 20
Figure 3-4: A picture of Arduino Uno Rev3 (picture source: https://www.arduino.cc) ... 21
Figure 3-5: A picture showing raspberry pi 3 model B (source: www.raspberrypi.org) ... 23
Figure 3-6: An image showing pi camera module rev1.3 (source: www.amazon.ca) ... 24
Figure 3-7: (A) DC-DC power converter, (B) LiPo 7.4V battery, and (C) power adapter. ... 25
Figure 3-8: A prototype of the LiDARPheno ... 26
Figure 3-9: Wiring diagram of the LIDARPheno hardware system ... 27
Figure 3-10: Flowchart of the program for Arduino in the prototype for LiDARPheno ... 29
Figure 3-11: Comparison of scanning time for different FoV and angular resolution. ... 31
Figure 3-12: Flowchart of the software program in the raspberry pi ... 32
Figure 4-1: Digital images of the indoor plants used for the experiment in the laboratory: (A) an arbitrary wild plant, (B) orchid and (C-E) Aglaonema plant ... 38
Figure 4-2: Growing canola in the laboratory ... 39
Figure 4-3: Sick LMS400-2000 (source: https://www.nexinstrument.com/LMS400-2000) ... 40
Figure 4-4: Canon LiDE 220 (Canon, USA) ... 40
Figure 4-5: Data acquisition setup for LMS400 ... 41
Figure 4-6: Data acquisition setup for LiDARPheno system ... 43
Figure 4-7: The data flow diagram of the acquisition using LiDARPheno ... 45
Figure 4-8: The process of acquiring ground truth leaf area information ... 46
Figure 5-1: Raw distance data acquired from an arbitrary wild plant ... 50
Figure 5-2: Reflectance and signal strength information for an arbitrary wild plant ... 50
Figure 5-3: Point cloud representation after conversion to Cartesian coordinates ... 52
Figure 5-4: Histograms of the percentage reflectance and signal strength of the wild plant. .... 53
Figure 5-5: Histogram of the distance to the sensor ... 54
x
Figure 5-7: Point clouds after cleaning and filtering the noisy data points... 56
Figure 5-8: Result of segmentation on the point cloud data ... 59
Figure 5-9: Measurement of leaf length using a curve fitting method ... 61
Figure 5-10: Measurement of leaf width using a curve fitting method ... 61
Figure 5-11: Delaunay triangulation of the leaf point cloud data ... 63
Figure 6-1: Annotated RGB images of the plants for Experiment 1 ... 64
Figure 6-2: Annotated RGB images of the canola for Experiment 2 ... 65
Figure 6-3: Relation between estimation with LMS400 data and ground truth leaf length ... 70
Figure 6-4: Relation between LiDARPheno estimated leaf length and ground truth ... 70
Figure 6-5: Correlation plot for estimated width using LMS400 and ground truth ... 73
Figure 6-6: Correlation plot for estimated width using LiDARPheno and ground truth ... 73
Figure 6-7: LMS400 Estimate area and ground truth area relation... 76
Figure 6-8: LiDARPheno estimated leaf area and ground truth relation. ... 77
Figure 6-9: Relationships between LiDARPheno-derived and LMS400-derived leaf lengths .. 78
Figure 6-10: Relationships between LiDARPheno-derived and LMS400-derived leaf widths .. 78
xi List of Abbreviations µm micrometer 1D One-Dimensional 2D Two-Dimensional 3D Three-Dimensional AC Alternate Current
APE Absolute Percentage Error
API Application Programming Interface
CA$ Canadian Dollars
cm centimeters
CSI Camera Serial Interface
CSV Comma Separated Value
CT X-ray Computed Tomography
DC Direct Current
DPI Dots per Inch
DSI Display Serial Interface
fps frames per second
g grams
GB Gigabytes
HDMI High-Definition Multimedia Interface HTPP High Throughput Phenotyping Platform
Hz Hertz (samples/second)
I/O Input/output
I2C Inter-Integrated Circuit
IoT Internet of Things
IR Infrared
KB Kilobytes
LAN Local Area Network
LiDAR Light Detection and Ranging
xii
LiPo Lithium Polymer
mA milliampere
MHz MegaHertz
mm millimeters
MRI Magnetic Resonance Imaging
NDVI Normalized Difference Vegetation Index
NIR Near-Infrared
nm nanometers
OS Operating System
PNG Portable Network Graphics
PtCloud Pont Cloud
PWM Pulse Width Modulation
R2 Coefficient of Determination
RGB Red, Green and Blue - Three channels of an image
RMSE Root Mean Squared Error
ToF Time of Flight
UAV Unmanned Arial Vehicle
USB Universal Serial Bus
V Volts
1
Chapter 1
Introduction
1.1 Global Food Security Challenges and Potential Solutions
The ever-growing population on earth calls for the need to increase food production by 1.5 times [1], [2]. The population of the earth is expected to reach 9.73 billion by 2050 [2]. If the current practices for farming were to utilize and the agricultural land expansion continues, there will be the more significant impact on the environment with substantial CO2 emissions by
greenhouses and increased nitrogen use [3]. In addition to increasing the food production, global temperature rise, flooding and diseases make the food security a primary concerns across political leaders [4]. There is a requirement for improvements in farming practices and study to increase the crop yield along with high resistance to disease, pests and changing environmental conditions [4].
The concept of Genotype and Phenotype terms first introduced by Wilhelm Johannsen (1909). In general, the genotype is the “genetic constitution of an organism” and phenotype is the “collection of traits possessed by a cell or organism that results from the interaction of the genotype and the environment” [5]. The food quality and food security improvements can be achieved by creating a new crop variety using gene editing technology [4]. While there have been many technological improvements and advances in gene editing/sequencing technologies [6]–[8], the technologies for the plant phenotyping are still developing and are not fully explored, making it a bottleneck for agriculture research [7]. Hence, efforts to make the plant phenotyping high-throughput is a necessity to balance the advances in genotyping with phenotyping.
Traditionally, plant phenotyping has been achieved by manually collecting the phenotypes from the plants to select the best individual variety [9]. Technological advancement in the plant phenotyping has been a topic of interest among interdisciplinary researchers in recent years. The efforts have been put into using and optimizing the available technologies to adapt to the need of plant phenotyping [7]. Ranging from the use of active sensors to measure the biochemical traits to
2
use of imaging sensors have been explored to find the relation between the genome and the environment [9]. However, most of the developments have been focused on lab experiments with some for in-field experiments, but are unavailable commercially at large scale. The challenge of feeding the increasing population is critical and hence has gained attention from many governments around the world. Research institutes and networks have been established to tackle the issues faced in the plan phenotyping field. For example, Plant Phenotyping and Imaging Research Center (P2IRC) [10] at University of Saskatchewan, International Plant Phenotyping Network (IPPN) [11] in Germany, Australian Plant Phenomics Facility (APPF) [12], North American Plant Phenotyping Network (NPPN) [13], and many others.
Plant imaging using a 2-dimensional (2D) color – visible light spectrum (VIS) – cameras were used by numerous researcher to develop a plant trait characterization algorithms [14], [15]. However, the VIS cameras are prone to the lighting conditions and might perform differently under changing lighting conditions, leaf shadows, overlapping leaves and differentiating leaves from the soil background [16]. Moreover, various other imaging such as thermal imaging, fluorescence imaging, and hyperspectral imaging can provide information related to canopy temperature, biochemical contents and water stress [16].
Tomographic imaging such as Magnetic Resonance Imaging (MRI) and X-ray Computed Tomography (CT) can provide information from the root and shoot architecture and distribution [17], [18]. However, the tomographic imaging is bulky and still remains low-throughput [16]. In addition, 3-dimensional (3D) imaging can provide the detailed view of the plant structure above-ground. Technologies such as Time of Flight (ToF), Light Detection and Ranging (LiDAR), and Stereo Vision cameras have been used to create a detailed map of the vegetation and canopy structures [16]. In contrast to 2D imaging techniques, 3D imaging is slow, expensive and can be bulky for field phenotype acquisition.
The above ground structure of a plant is an essential characteristic to evaluate the plant’s ability to resist environmental changes and diseases. Moreover, the above ground organism of the plant is responsible for the process of the photosynthesis – apparently, one of the most critical trait to estimate the yield – and growing the fruit or seeds. Leaf area, leaf expansion, and the ground cover are some of the traits that can be used to estimate the photosynthetic rate [19].
3
Commercial technologies available for plant phenotyping are few, inaccessible and expensive. Exploring the effect of gene modification and editing at a large scale requires phenotyping technologies to be robust, inexpensive and accessible.
1.2 Research Objectives
The primary objective of this thesis work is to investigate the application of low-cost 3D imaging sensor and to develop an affordable system. The following research objectives were set to meet the goal of developing a cost-effective system:
• To design and develop a scanning system based on low-cost LiDAR sensor that is low-cost, portable and easy-to-build.
• To develop a low-level software program (firmware) to operate the hardware of the system using existing libraries and Application Programming Interfaces (APIs).
• To develop software and algorithms that can process the acquired data including, conversion from raw data to generate a 3D point clouds, cleaning, filtering and correcting the data, segmentation of individual plant structures (i.e., leaves).
• To estimate the traits of the plant using the processed data. In this thesis, Leaf’s area, length, and width are estimated using the point cloud data.
• To compare the performance of the developed system with the commercial LiDAR scanner with respect to the estimation of the traits.
1.3 Thesis Organization
The subsequent chapters are organized as follows:
Chapter 2 reviews the literature relating the topic of plant phenotyping and various
phenotyping techniques being utilized. In this chapter, different types of phenotypes and recent advances in the estimation of those phenotypes are presented. Moreover, different imaging techniques that are currently being studied and developed are explained.
Chapter 3 provides the detailed design of the low-cost LiDAR scanning system
(LiDARPheno). The detailed design requirements, assessment of various low-cost LiDAR sensors, the design of the firmware and software for portability and remote operability, and power consumption and battery life estimation are discussed in this chapter.
4
Chapter 4 describes the experimental material and data acquisition process. This chapter
also describes the commercial LiDAR used to assess the performance of the LiDARPheno system. Various types of plants used for experiments and the acquisition of the ground truth information using manual methods are discussed.
Chapter 5 discusses the processing of the raw data from the LiDAR and introduces the
algorithms developed to process the data. The conversion of raw data to coordinate system and cleaning, filtering and segmentation of the individual leaves is described. It also discusses the methods deployed for estimation of the plant leaf area, length, and width.
Chapter 6 presents the results of the experiments performed and the interpretation of the
results. Comparison between results obtained with LiDARPheno and commercial LiDAR scanner is presented to assess the performance of the low-cost design.
Finally, Chapter 7 concludes the findings of this research work and provides direction for improvements to the designed system as well as analysis software.
5
Chapter 2
Literature Review
This chapter includes the review of plant phenotyping techniques and transition of the plant phenotyping from traditional to modern technological advances in the field. Section 2.1 provides an overview of the term ‘plant phenotyping’ and the need for the assessment of the physiological characteristics of the plant. Section 2.2 discusses the available sensor technologies and sensors that are being utilized to develop plant phenotyping platforms. Section 2.3 reviews past and recent works in the LiDAR-based plant phenotyping. Section 2.4 provides insights into the phenotyping platforms, and finally, Section 2.5 establishes the need for low-cost phenotyping solutions.
2.1 The Term ‘Plant Phenotyping’ and its Need
The term ‘genotype’ and ‘phenotype’ were first introduced by plant scientist Wilhelm Johannsen about a century ago [9]. As Johannsen stated in [20]:
“All ‘types’ of organisms, distinguishable by direct inspection or only by finer methods of measuring or description, may be characterized as ‘phenotypes’.” The term ‘phenotype’ is used by a variety of health and life science fields till now. However, there is no standard definition of the term and is used in different ways to define a particular situation [5]. In general, plant phenotyping is an assessment of all the visible, measurable and observable characteristics of a plant. For example, plant height, leaf shape, water contents, nitrogen contents, photosynthetic rate, leaf expansion, ground cover, leaf area, etc.
The technological improvements and new findings in the gene sequencing have brought opportunities to both improve the yield as well as the quality of the crops [4], [6], [9], [14], [15]. However, there is limited research and development towards improving the ordinary methods of the crops’ assessment and hence is the bottleneck for the researchers’ and plant breeders’ capability to perform at the same rate as of genetic modification scientists [14], [15], [18]. Manual measurement and collection of the phenotypes are labor intensive, prone to errors and tiresome for
6
the breeders. The replacement of the human efforts put into the phenotype collection is required to minimize the errors and to fasten the process of the selective breeding.
The knowledge of how genomic variation interacts with the environment is crucial in understanding the function of different genes, which consequently improves the overall process of producing the new crop. Hence, the phenotyping process plays a vital role in the development of the new crops with higher yield and better resistance to the changing environment. The new crops can help in the major food security challenge which is to feed an ever-growing population by 2050. Due to the increasing demand for ‘good’ phenotypic information, which can be helpful in the discovery of the gene-environment interaction, technological advancements in phenotyping has become a crucial field of research. In recent years, there have been many studies on how existing, and new sensors and methods can be deployed at the advantage of the plant phenotyping [7], [15], [16]. Researchers have demonstrated the helpfulness of Visible Spectrum (VIS) imaging from counting the number of leaves to the estimation of biomass [16]. Scientists have developed technologies and processing algorithms by adapting existing sensors for plant phenotyping. Moreover, medical imaging techniques such as Magnetic Resonance Imaging (MRI) and X-ray Computed Tomography (CT) were also utilized for imaging the plant structures [17], [18]. Overall, the imaging technologies might prove to be really helpful in the understanding of the gene-environment interactions.
2.2 Sensors and Imaging Technologies in Plant Phenotyping
The field of digital plant phenotyping may include imaging, measuring and recording environmental parameters, and modeling. There are various types of devices and sensors available for measuring the environmental parameters, such as soil moisture content, temperature, wind speed and direction, humidity, rainfall, sunlight intensity, etc. Also, imaging and reconstruction the plants model can be performed using different imaging and scanning techniques such as VIS or 2D camera, Infrared (IR) camera, Near Infrared (NIR) camera, Hyperspectral camera, fluorescence camera, CT, MRI, Time of Flight (ToF) camera, LiDAR scanners, and laser scanners. All the technologies have some advantages and some disadvantages. The following subsections discuss the different technologies and techniques being studied and utilized in the plant phenotyping.
7
2.2.1 Single Dimension (1D) Sensors in Plant Phenotyping
1D sensors are capable of measuring some of the plant and environmental traits such as temperature, plant height, field moisture, measuring wind speed and rainfall detection. The optical sensor such as GreenSeeker (NTech Industries Inc., USA) has been used by researchers to monitor the growth and development of the crop [21]. For example, an estimation of the nitrogen uptake by crops has been executed [22], [23]. An Internet of Things (IoT) based system was proposed to monitor the environmental parameters in the field by [24]. The IoT based system utilizes various sensors including soil moisture, rail fall detection, wind speed and wind direction monitoring. Also, it uploads the data on the cloud server, and the data can be utilized to detect fungal in the crop fields.
2.2.2 Visible Spectrum Imaging
Visible spectrum (VIS) imaging has been of great interest to the plant scientists in recent years. The main reason for the popularity of VIS imaging is the availability of the imaging sensors. Most smartphones have cameras included and can be used to take the pictures in the field. The VIS cameras have imaging sensor that captures the light in the visible spectrum of the light (400-750 nm wavelength). The VIS image raw data is stored as 2D data and provides the information in three channels, red (~600 nm), green (~550 nm), and blue (~450 nm) spectrum of the visible light; hence, commonly referred as RGB (red, green, blue) images.
RGB or visible imaging is extensively used by plant scientists due to its ease of use, cost-effectiveness, and maintenance [16]. Moreover, the vast availability of tools and algorithms for RGB images makes the process of data acquisition and analysis easy for plant scientists without the need to learn and develop application-specific software programs. The VIS imaging is mostly used in the controlled environment. However, in the recent years, there has been a large number of attempts to extract the plant traits with the image data taken from the field. Primarily, the RGB imaging is used to count number of leaves [25], [26], estimate shoot biomass [27], [28], leaf morphology [29] and root architecture [30], [31].
Recently many image-based phenotyping algorithms and platforms have been proposed to ease the task of estimating the physiological traits of the plants. For example, Phenotiki [32] is open software and hardware, affordable image-based phenotyping platform that can perform the tasks of analyzing morphology, growth color and leaf count in rosette-shaped plants. The platform
8
uses off-the-shelf components and can be ordered from many available suppliers. Another example of the high-throughput phenotyping pipeline is HTPheno [33], a plugin to the image analysis software ImageJ, an open source image analysis software. This plugin can analyze the height, width and projected shoot area of the plant.
For past few years, the field of artificial intelligence and machine learning is mostly appreciated by many fields of the science and life science if not left alone. The visible images have been fed into the deep learning networks to train the model for phenotypic traits and then test the network with the data [34]–[36]. The results of the segmentation on images for trait characterization shows a promising future for the plant phenotyping community.
Overall, the visible imaging is a promising technology for the plant phenotyping tasks. However, the visible light imaging suffers from the effect of lighting conditions, the color of the plants and soil, and controlling the overlapping of leaves. The RGB image analysis methods often fail in the presence of minimal brightness differences in the soil and plant, leaf and plant shadows, overlapping leaves, and the influence of the lighting conditions. Due to these uncontrollable conditions, visible light imaging methodologies suffer from the inaccuracy in segmentation, the most crucial step in the image analysis. However, the visible light imaging can provide much insightful information when the lighting and plant conditions are favorable.
2.2.3 Thermal Imaging
Thermal imaging or infrared thermography technology typically operates in the infrared spectrum of the light and detects the radiation by objects in the infrared region of the light spectrum. The typical thermal imaging sensitive spectrum range is 3-5 µm for short wavelengths [16]. The availability of the highly sensitive thermal imaging cameras and its use in the vegetation detection, the thermal imaging is gaining popularity among plant scientists.
The leaf surface temperature measurements can be helpful in understanding the plant water relationship [16]. Thermal imaging has been used for drought phenotyping and understanding the behavior of the stomatal [37]. In [38], authors have used thermal/infrared imaging to study the response of genetic variation in wheat and barley with respect to water deficiency. This study concluded that thermal imaging could prove to be the perfect estimation for water contents in the canopy and is a reliable source for high-throughput measurements. The thermal imaging has been
9
widely used for crops and trees [16]. Moreover, thermal imaging has also been combined with the spectral imaging to improve the water content estimation [39].
Despite the many benefits of the thermal imaging, they are still expensive and difficult to operate. Moreover, availability of the thermal image processing algorithms limits the use of thermal imaging. It is notable that thermal imaging requires extensive calibration for use in the estimation of water contents. High level of calibration and the requirement of specific knowledge of the environment when the imaging was performed makes the thermal imaging one of the technologies that require technical inclination. Fusion of the information from the thermal imaging and RGB imaging can provide means to separate the soil water contents from that of the plant [16].
2.2.4 Imaging Spectroscopy
The plants tend to absorb most of the light in the visible spectrum (400-700 nm) with the highest reflectance in the green region (~550 nm) of the visible light spectrum. However, the near-infrared (NIR) wavelengths ranging from 700 to 1200 nm have better reflectance from the plant leaves than that of visible light. Moreover, with the increasing wavelengths near 2500 nm, the absorption is higher, resulting in the low reflectance due to water contents in the plant leaves [40]. Plant’s spectral reflectance information has been used to develop various vegetation indices by using the difference or ratio of the reflectance data at two or more wavelengths. For example, normalized difference vegetation index (NDVI), which is a good indicator of detection of the vegetation in remote sensing using an aerial vehicle or using handheld detectors. Several indices have been developed using the imaging spectroscopy [16].
The spectral reflectance indices are used to measure the water status, chlorophyll contents, and green biomass in phenotyping the plants. For instance, Schlemmer et al. [41] have acquired the reflectance information in the range 350-2500 nm and used the ratios of reflectance at 630 and 680 nm wavelengths and ratio of 600/680 nm to introduce two new indices, namely orange/red chlorophyll absorption ratio (OCAR) and yellow/red chlorophyll absorption ratio (YCAR). The two ratios defined by the authors have shown a strong relation (r2 = 0.83) to the chlorophyll contents of the plant. Hyperspectral and multispectral cameras are extensively used to estimate the water status in the plants.
The imaging spectroscopy can provide relatively accurate information for plant phenotyping. However, the data produced using the spectroscopy is significant in size. Moreover,
10
the devices and instruments used for spectroscopy are expensive and limits the acceptance by the breeding programs and plant scientists [16]. Overall, the spectral imaging is a promising technology for the prediction of canopy water contents, green biomass and various indices that can be used to predict vegetation, biomass or photosynthetic rates.
2.2.5 3-Dimensional (3D) Imaging
A 3D imaging can supplement the limitations of the 2D images by adding the 3rd dimension to the scene, i.e., depth. The 3D imaging sensors have been used extensively in the computer gaming industry. The 3D imaging sensor technologies available are 2D photogrammetry [42], light detection and ranging (LiDAR), stereo vision, time-of-flight (ToF) cameras and recently consumer-grade gaming interface Microsoft Kinect [16]. These sensor technologies have been used in the plant phenotyping tasks in recent years.
A 3D imaging can help in the estimation of the traits and architectures of the plants. An approach to constructing a 3D point cloud by using 2D images taken from different angles has been used by researchers. In [43], authors have constructed a 3D model of the plants using 2D images taken from multiple view-angles. The stereo vision cameras are also used in the field of plant phenotyping to construct a 3D model of the plants. For instance, Frasson et al. [44] have generated a 3D digital model of the Maize using stereo vision camera. While 3D model reconstruction from the multi-perspective 2D images is possible, the process highly depends on the quality of the 2D images, which suffers from the illumination conditions as explained in the section 2.2.2. In addition, extensive calibration for the 2D cameras is required to estimate the 3D models.
The Time-of-flight (ToF) based cameras can acquire information at the relatively high frame rate (up to 50fps) and are suitable for field data acquisition. However, sunlight affects the performance of the ToF cameras [45]. In [30], authors have constructed a 3D approximation of the plant by combining ToF and RGB data. A successful attempt was made to fuse the stereo image with ToF image by Song et al. [46]. Going a step forward, recently, Li and Tang [47] proposed the use of ToF camera to estimate the leaf length, width, area and collar height of the corn plant. A 3D model has been constructed with 23 different views. While ToF cameras are ideal for high-throughput 3D data acquisition, they are influenced by the sunlight, and low resolution limits the adaptation in phenotyping applications.
11
The LiDAR is best known for the 3D model reconstruction of the canopy due to its accuracy, robustness, and resolution. LiDAR uses a laser light emission and calculates the distance to reflecting object by recording the time of travel from and back to LiDAR. In plant phenotyping, several attempts toward the reconstruction of the canopy have been made. 3D reconstruction of the 3D model allows for the analysis of the complex traits, such as shape, area, and alignment of the leaves. LiDAR-based 3D imaging technology is explained in section 2.3.
2.3 LiDAR-based 3D imaging in Plant Phenotyping
The light detection and ranging (LiDAR), as its name suggests, uses light to measure the distance to the object by calculating the time of travel by the pulse of light. The LiDAR is also used by law enforcement agents to measure the velocity of the car on the roads. LiDAR can estimate the distance very accurately, and two successive measurements can be used to measure the velocity accurately. The fundamental operating principle of the LiDAR is shown in Figure 2-1.
12
LiDAR uses the laser emitter to emit light, and a photo/laser detector captures the light reflected by the surface. By considering that the speed of light is constant, the travel time of the light pulse is recorded by a time recorder or timer. The time used for calculation of the distance to the reflecting object is from the emission of the pulse of the light until the reflected pulse is received by the detector. The time is then divided by two and multiplied with the constant speed of light, consequently revealing the distance to reflecting object.
LiDAR became known to general public in the early 1970s when the astronauts used it to map the surface on the moon. Since then, LiDAR has been used in remote sensing applications and generally involves data acquisition with an airplane or helicopter. The LiDAR data is then combined with other information collected during the same flight, such as GPS information to map the acquired data to geolocation [48].
In recent years, LiDAR’s accuracy and ability to precisely map the structures drew attention across various fields, especially plant phenotyping community. It is believed that LiDAR can provide an opportunity to look at the plant with more accurate 3D modeling, consequently revealing the critical parameters of the plants such as the shape and structure of the leaves. Moreover, LiDAR uses its own light source, eliminating the illumination limitations of 2D imaging. A 2D LiDAR collects two-dimensional information, generally using a rotating mirror, at a very high speed. The 3D model of the canopy can be constructed while moving the 2D LiDAR along the direction of the scanning plane. While 3D model constructed using LiDAR scans is not as dense as those constructed using 2D images, the scans can provide useful information for extracting the plant morphological traits [49]–[51].
Derry et al. [52] have included the 2D LiDAR (LMS400, Sick AG, Waldkirch, Germany) in their field-based phenotyping platform, Phenomobile, for estimating the canopy height in the different height genotypes of the wheat. The higher correlation between the manual measurement of the canopy height and one estimated using LiDAR data was achieved. The study concluded that LiDAR is potentially the best alternative to the image based methods. In a similar study, Tilly et al.[53], used the terrestrial laser scanner Riegle VZ-1000 to measure the height of the rice crop. The study concludes that there is a higher correlation between manual measurements and the ones estimated using LiDAR data. In [49], authors have validated the feasibility of 2D terrestrial LiDAR to reconstruct the 3D model of the trees. The authors conclude that 3D modeling of the canopy can reveal new opportunities for assessing the essential structural and geometric traits of the plants. In
13
[51], the authors use the 2D LiDAR to construct the 3D point cloud by moving the LiDAR along the scan direction. The study concluded with an overall error of 6.84% in height estimation of the cotton plants.
The fusion of the LiDAR imaging with various other imaging techniques can provide a better understanding of the plant. Omasa et al.[54], in their study of 3D LiDAR imaging for understanding plant responses, states that there is a potential for better understanding of the plant response to stress condition by combining the approaches of 2D imaging with LiDAR imaging. The structural analysis combined with hyper- or multispectral cameras can provide an opportunity to understand the plant’s structure as well as the response to different environmental conditions. In [55], authors have obtained the high correlation between LiDAR estimated leaf area and dry weight of the leaf in the wheat. Moreover, authors prove the usefulness of the LiDAR imaging in the phenotyping of the wheat using portable high-resolution LiDAR.
Recently, in the past two years, the feasibility of LiDAR to construct the 3D model and analyze the 3D to understand structural variety in the plants has drawn attention from many researchers dealing in the plant phenotyping field. In one of the recent studies, Berni et al. [56] analyzed the 3D data captured with a 2D LiDAR (LMS400, Sick Inc., Germany). In the study authors integrated the LiDAR on the high-throughput phenotyping platform, Phenomobile, and experiments were performed on fields of the wheat. Phenotypic characteristics included plant height, ground cover, and above-ground biomass. Authors also compared the results obtained using the LiDAR data with the ones obtained using RGB camera and NDVI. The study of wheat ground cover, above-ground biomass and plant height using LiDAR concluded the utility of LiDAR in the field phenotyping application with the non-destructive approach. In another study [57], authors have monitored the leaf movement activity in the indoor plant, linden regel, using terrestrial LiDAR. Moreover, in the study, authors have collected data in the varying lighting conditions including total absence of the light. The study on indoor plant indicates the utility of the terrestrial LiDAR in accurately tacking of the leaf movement parameterization. Following the established methods in [51], the authors performed the in-field experiments for growth analysis for cotton plants in [58]. The analysis of the plant morphological traits such as height, projected canopy area, and plant volume was extracted from the LiDAR data. Moreover, the plot level 3D model was created indicating the high accuracy and feasibility of the LiDAR device in the high-throughput plant phenotyping.
14
2.4 High-Throughput Plant Phenotyping Platforms
The high-throughput phenotyping platforms (HTPPs) are the platforms that include either a single or multiple sensing technologies with the aim of collecting a vast amount of data from the field that can reveal some beneficial phenotypic information. The platform generally incorporates the high-performance computer or data logger collecting a vast amount of data and storing the data either in local storage or in the remote file servers. The primary objective of utilizing those platform is to overcome the limitation of the manual phenotypic information collection and to generate, organize and store data so that they are accessible and easily accessible for further analysis.
Numerous efforts have been put on developing HTTPs. For example, the Phenomobile Lite® [59] developed by APPF, is a lightweight field-based phenotyping platform that includes an RGB camera, hyperspectral camera, thermal camera and LiDAR sensors. Another example of the field-based platform is HeliPod [59] by the APPF which is equipped with high-resolution RGB and thermal camera. The LemnaTec Corporation provides a fully automated platform for field-based phenotyping as well as solutions for laboratory experiments [60]. PhenoFab® [61] is a greenhouse platform by KeyGene for collecting the digital phenotypes. PhenoSpex PlantEye [62] is the high-resolution 3D LiDAR-based platform for field phenotyping by PhenoSpex. After its introduction to the commercial market, PlantEye has been used to model the plants. In the recent review paper, Rebetzke et al. [63] review the high-throughput phenotyping and its effect on enhancing the crop genetic resources.
2.5 Need for Low-Cost Plant Phenotyping Sensors/Platforms
Despite the availability of technologies and platforms for plant phenotyping, there is a need for the low-cost sensors and platforms. The available technologies and platforms are still in the research phase and are not ready for commercial use, and those available commercially are highly expensive, inaccessible and bulky. The devices and technologies are computationally expensive due to sophisticated algorithms for phenotype extraction. For example, 3D photogrammetry using 2D images requires many high-resolution images taken from different angles and high level of calibration is required. Furthermore, the algorithms for processing the images to generate a 3D model are computationally expensive, requiring the use of high-end processors and huge memory.
15
On the other hand, LiDAR can provide the phenotypic information accurately with reasonably easy processing steps. However, LiDAR sensors are expensive and bulky. The fact that available technologies are expensive, monetarily and/or computationally, limits the exploration by the research community at large. Hence, there is a need to develop the cost-effective solutions for the phenotyping.
This thesis work attempts to investigate the feasibility of low-cost LiDAR sensor and to build a system with inexpensive modules for 3D scanning of plants. The device/system will have ability to use existing libraries and APIs as well as provide a depth information to construct a point cloud for in-lab experiments. The target application of the system is in-lab or in the greenhouse environment and possibly in the challenging field environment for relatively simple trait extraction. The principle targets are rosette-shaped plants such as Canola in their early development phase with application in plant growth monitoring. The scope of this work is limited to controlled environment as the primary objective is to assess the feasibility and utility of the low-cost system for some of the phenotyping tasks.
16
Chapter 3
Design and Development of LiDARPheno system
This chapter discusses the design and development of 3D scanning system (LiDARPheno) using low-cost Light Detection And Ranging (LiDAR) sensor as follows: Section 3.1 sets the requirement of the low-cost LiDAR-based scanning system. Section 3.2 discusses the design of a hardware setup and components used. Section 3.3 explains the firmware design for Arduino Uno and different scanning schemes. Section 3.4 provides the insights into a software program for Raspberry Pi. Section 3.5 discusses power requirement and battery life calculations. Finally, Section 3.6 provides summary of the cost for individual parts of the system.
3.1 Design Requirements
For the design of the low-cost LiDAR scanning system, the following requirements have been set:
• The developed system should be low-cost. It is required and was one of the goals of this research project that a system be inexpensive.
• The LiDARPheno system should be able to capture a depth profile of the scene that is being scanned and provide control over the horizontal and vertical Field-of-View as well as the angular resolution.
• The system should be portable and capable of utilizing the wireless communication with a goal of the remote operation.
• The LiDARPheno should be able to communicate and find the pre-configured Wi-Fi access point at the operating system boot-up.
• The system should have the available hardware resources that can be utilized to interface other sensors and devices, if necessary.
• The developed system should be able to upload data to the user-specified file server, ultimately making it remotely accessible.
17
3.2 Design of the Hardware for the System
Figure 3-1 shows an underlying architecture of the system. Hardware design includes a selection of a LiDAR sensor, mechanical structure, controlling devices and power module. Various LiDAR sensors and approach to control have been explored to meet the requirement of the hardware design. The following sub-sections discuss the selection of sensor, devices, and approaches utilized in developing LiDARPheno hardware.
LiDAR scanner
LiDAR sensor
Control and User
Interface
Controller
Power Module
Mechanical
Structure
Motors
Structure
holding LiDAR
User Software
(Application)
DC-DC converter
Battery
Power Adapter
Internet
End User
Figure 3-1: Basic architecture of the system
3.2.1 LiDAR Sensor
LiDAR is a distance measurement technique that uses light in the form of pulsed laser to measure range or distance to the reflecting surface. While selecting a LiDAR device, it is necessary to take some of the essential characteristics under consideration as described below:
18
• Resolution: the angular aperture of the transmitted dot or laser point, the
characteristic that defines the smallest detectable area.
• Scan Rate: It is a property that defines the speed of sample acquisition. For
example, 50Hz scan rate means 50 samples/second
• Laser Wavelength: Wavelength of the incident laser light is one of the required
property to think about as it directly relates to the plant’s ability to reflect the light.
• Range: Generally measured in meters, range describes the operable range of the
sensor. The range is a distance unto which the sensor can measure the distance to the reflecting object.
In this selection process, various low-cost (less than CA $1000) LiDAR sensors have been explored and assessed against different characteristics as mentioned above. Table 3-1 shows the comparison between different low-cost LiDAR sensors.
Table 3-1: Comparison of the low-cost LiDAR sensors
After assessing various LiDAR sensors, it was decided to select LiDAR-Lite v3 (Garmin Inc., USA) as a potential candidate for the low-cost system. One of the principal reasons for
LiDAR Sensor/Device Range Field of
View Laser Wavelength Scan Rate (Point/ second) Price (as of June 2018) LiDAR-Lite v3 Laser Rangefinder 0 – 40 meters N/A 905 nm 500 CA $159.99 RPLIDAR A2 360° Laser Scanner 0.15 – 12 meters 0 - 360° 785 nm 2000-8000 CA $390.00 Sweep V1 360° Laser Scanner 40 meters 0 - 360° 905 nm 1000 CA $450.64 Benewake TF01 LIDAR Rangefinder (10 m) 0. 3 – 10 meters N/A 850 nm 500 CA $220.19
19
choosing the LiDAR-Lite v3 was the price, as it would allow building extremely low-cost system. Other reasons for decision included laser light wavelength of 905 nm (plant leaves reflect most of the light at this wavelength), possibility to design customized scanning mechanism, and feasibility of using it in an Unmanned Arial Vehicle (UAV) as it has a range up to 40 meters.
3.2.1.1 LiDAR-Lite v3
LiDAR-Lite v3 works on the principle of Time of Flight (ToF). ToF uses the time between the transmission and reception of pulsed laser light at 905 nm to calculate the distance to the reflecting surface. LiDAR-Lite v3 can measure distances with an accuracy of ±2.5 cm. This low-cost LiDAR sensor is a low power device with operating voltage of 5V DC and current consumption of about 130 mA while in continuous operation (105 mA when idle) [64]. Figure 3-2 presents a picture showing LiDAR-Lite v3.
Figure 3-2: LiDAR-Lite v3 by Garmin Inc. (picture source: https://www.sparkfun.com)
LiDAR-Lite v3 can operate in -20 to 60°C temperature range and weighs 22 grams. It has a maximum repetition rate of 500 samples/second or 500Hz. The sensor provides two interfacing options: 1) I2C (Inter-Integrated Circuit) and 2) PWM (Pulse Width Modulation). Either can be used to interface the sensor with a controller. However, I2C provides a better option and configurable device address, which helps to interface multiple devices to one I2C bus of the controller.
Moreover, the manufacturer provides an open source library for interfacing the sensor with Arduino (an open source, open hardware platform) controllers. Full technical details and specifications of the LiDAR-Lite v3 are available in [64].
20
3.2.2 Rotating Mechanism for the Scanner
As LiDAR-Lite v3 is not a scanner, the mechanism needs to be designed to use this sensor for building a 3D scanner. Two small hobby servo motors have been utilized to build a scanning setup, which fulfills the requirement of portability. Figure 3-3 shows the mechanical setup of the scanner using two multipurpose, two long “C” brackets and two servo motors.
Figure 3-3: Mechanical design of the scanning setup1
1(Sources for individual 3D models of the components: www.grabcad.com, www.sketchup.com, and
21
The scanning setup consists of two mini long “C” brackets (ASB-303, lynxmotion – RobotShop Inc., Canada), two mini multi-purpose (ASB-301, lynxmotion – RobotShop Inc., Canada) and two micro servo motors (HS-85BB, Hitec, South Korea). First servo motor at the base level controls the vertical motion of the LiDAR, and another motor in the middle of the setup controls the horizontal motion of the system. Servo motor HS-85BB operates at 4.8V-6.0V DC with current consumption around 280 mA (8 mA while idle) [65]. Servo motor, brackets and LiDAR sensor were assembled using manufacturer supplied screws, bolts, and nuts.
3.2.3 Microcontroller and its Specifications
An open-source electronics hardware platform, Arduino [66], has was chosen to control the assembly and connect the LiDAR device. Specifically, Arduino Uno Rev3 (Arduino SRL, Italy) was utilized due to its operating speed, availability of 14 digital input/output pins (including 6 PWM outputs) and six analog inputs, and provision of various communication protocols consisting of UART, I2C, and PWM. Apart from the proper technical specification, Arduino Uno is an inexpensive platform for prototype development and has a vast number of tutorials available on their website. Availability of some tutorials makes it an easy-to-use platform. Moreover, the manufacturer of the LiDAR sensor provides an open-source library [67] to interface LiDAR-Lite v3 with Arduino, which matches with one of the goals for this project – minimum code development.
22
Figure 3-4 shows a picture of an Arduino Uno rev3 and Table 3-2 provides detailed technical specifications of the Arduino Uno rev3 (taken from https://store.arduino.cc/arduino-uno-rev3)
Table 3-2: Specification of the Arduino Uno Rev3
At first, Arduino Uno was used for testing and evaluating LiDAR-Lite v3 and to understand the operation of the LiDAR sensor. Arduino Uno was connected to LiDAR using I2C communication interface. After some initial knowledge acquisition, the controller platform was interfaced with two servo motors to build and operate the scanner. Initial testing and learning were performed while Arduino was connected to the computer (Lenovo ThinkCentre, Intel Core i7 @
Detailed Specification of Arduino Uno Rev3 platform
Microcontroller : ATmega328P
Operating Voltage : 5V
Input Voltage (recommended) : 7-12V Input Voltage (limit) : 6-20V
Digital I/O Pins : 14 (includes 6 PWM output pins)
PWM Digital I/O Pins : 6
Analog Input Pins : 6
DC Current per I/O Pin : 20 mA DC Current for 3.3V Pin : 50 mA
Flash Memory : 32 KB SRAM : 2 KB EEPROM : 1 KB Clock Speed : 16 MHz LED_BUILTIN : 13 Length : 68.6 mm Width : 53.4 mm Weight : 25 g
23
3.4 GHz with 64-bit windows operating system, 16 GB RAM) using USB serial communication interface. To meet the requirement of portability and remote connectivity, an open-source mini-computer, Raspberry Pi 3 Model B, was introduced in the design for user software requirement. The following sub-section discusses raspberry pi and its specifications.
3.2.4 Raspberry Pi, a Camera Module, and their Specifications
Raspberry Pi is a credit-card-sized portable and affordable computer and has been accepted by many electronics hobbyist and developers. It has almost all the functionality of a regular computer. In this study, raspberry pi provides connectivity to the internet and remote operability. It operates on the light-weight distribution of Linux operating system (raspbian OS). Figure 3-5 shows a photograph of raspberry pi 3 model B.
In addition to being an inexpensive computer system, raspberry pi provides 40 general-purpose I/O pins, 4 USB 2.0 ports, HDMI video output, wireless LAN, Bluetooth, Ethernet connectivity, CSI camera interface, and DSI interface for connecting a touchscreen display. Detailed specification for the raspberry pi 3 model B is available at [68].
Figure 3-5: A picture showing raspberry pi 3 model B (source: www.raspberrypi.org)
The primary reason for using the raspberry pi and Arduino together, even though raspberry pi is capable of doing the job, is to utilize the already developed and publicly available libraries. For instance, manufacturers of the LiDAR device provides the library to interface it with Arduino and APIs can be easily installed on the raspberry pi to get the functionality of uploading data. Moreover, the raspberry pi can be utilized as the single point processing unit, which can process
24
data as it is acquired and finally upload the results to the desired file server. On top of that, if necessary an independent scanning system with Arduino alone could be attached to central raspberry pi to make a network of the systems. This arrangement provides low code development time, plug-and-play operation, simple processing algorithms and cost-effective arrangement.
3.2.4.1 A Raspberry Pi Camera Module
Figure 3-6: An image showing pi camera module rev1.3 (source: www.amazon.ca)
A raspberry pi camera module rev1.3 was included in the design to take a still 2D image of the scene. A 2D image provides the color details of the scene and can be used to combine with 3D information if required. The camera module has FoV of about 54° and can acquire 2592x1944 pixels still images. It uses OmniVision OV5647 camera sensor. Detailed technical specifications are available at [69]. Figure 3-6 displays an image of the camera module.
3.2.5 Power Module
Power module consists of the DC-to-DC voltage converter, a battery, and a power adapter. These three components/devices are necessary to provide portability of the LiDARPheno. With the addition of the battery to this design, the system could be placed in the anywhere to acquire data without the hassle of the wires.
For this project, a step-down DC power converter by DFRobot is used [70]. This DC-DC converter has 5V or variable voltage selection switch. The input voltage can range from 3.6V to 25V and can provide up to 5A power at the 5V output. Moreover, it provides three different
25
interfaces for output and total of 5 output ports, making it the best device to include in the design as variability of the components in the system. Figure 3-7 (A) shows the DC-DC converter.
A battery is an essential component of any mobile/portable system. Lithium-Polymer (Li-Po) battery was included in the LiDARPheno design. A 7.4V 2000mAh LiPo battery by Robotshop Inc. is a better option as it provides three different connectors and has a capacity of 2Ah [71]. Figure 3-7 (B) represents a picture of this LiPo battery.
A manufacturer recommended power adapter, which can charge the LiPo battery and provide power supply to the system, was used with this design and is shown in Figure 3-7 (C).
Figure 3-7: (A) DC-DC power converter, (B) LiPo 7.4V battery, and (C) power adapter.
In addition to the components mentioned above in the power module of the system, a power MOSFET was included to restrict the power to servo motors while they are not operational. Design includes power MOSFET IRL 620 by Vishay Siliconix, USA, which is a fast switching and cost-effective device. A control output pin on raspberry pi operates the MOSFET, which provides the power saving by reducing the current requirement while the system is not operational.
3.2.6 Full Design of the Hardware and Wiring Diagram
All the components and rotating mechanism were integrated to make a final full design of the LiDARPheno system. These components and setup were then placed into a housing box to make the system portable and easy to carry. Figure 3-8 shows the prototype of the system.
The prototype of the LiDARPheno system consists of all the modules, devices and setup described earlier in this chapter. A red colored housing box holds all the wires, raspberry pi, power module and Arduino Uno inside of it. Moreover, the box was carved so that the raspberry pi’s USB
26
and Ethernet ports are accessible. A camera module is aligned and fixed so that the camera can capture the still 2D color images of the scene being scanned. The power supply wires are left open so that either power adapter (for in-lab use) or a LiPo battery (for remote use) can be connected to power the system.
The system on the back side of it has two holes on each side, which are used to hold the system. The prototype system can be attached to an aluminum bar to hold it on the tripod or attach it wherever required.
Figure 3-8: A prototype of the LiDARPheno
The wiring diagram of the LiDARPheno system prototype is presented in Figure 3-9. The LiDAR sensor (LiDAR-Lite v3) has six pins, out of which two are for power supply (red and black), green and blue colored wires are for communication using I2C communication interface, yellow is for mode control or PWM communication interface and orange is for power enable pin. The power supply pins were connected through the power module, and I2C (SCL and SDA) pins were connected to Arduino Uno’s I2C interface pins (SCL and SDA). Mode control and power enable pins (PWM interface) are left non-connected.
Servo motors, in general, have three pins (two for power supply and one for control using PWM). Power supply pins of both the servo motors (horizontal scan control and vertical scan
27
control) are connected to the power MOSFET to restrict the power supply while the system is not operational. This arrangement reduces power usage while in a remote location. On the other hand, control pins of both the servo motors are connected to Arduino’s digital PWM pins (pin #9 and #11) to control the movement of the servo motors.
Arduino Uno and Raspberry Pi receive power supply from the power module (constant 5V DC). Both the controllers/devices communicate using Universal Serial Bus (USB) interface. Moreover, the MOSFET that controls the power to servo motors is connected to a raspberry pi’s general purpose I/O (GPIO) pin and controls when to provide power to servo motors.
M
Servo 2
M
Servo 1
Power Module
Arduino Uno Raspberry Pi LiDAR-Lite v3 5V DC NC NC 9 11 SDA SCL 5V DC MOSFET GPIO I2C PWM PWM USB Battery or power adapter Input
28
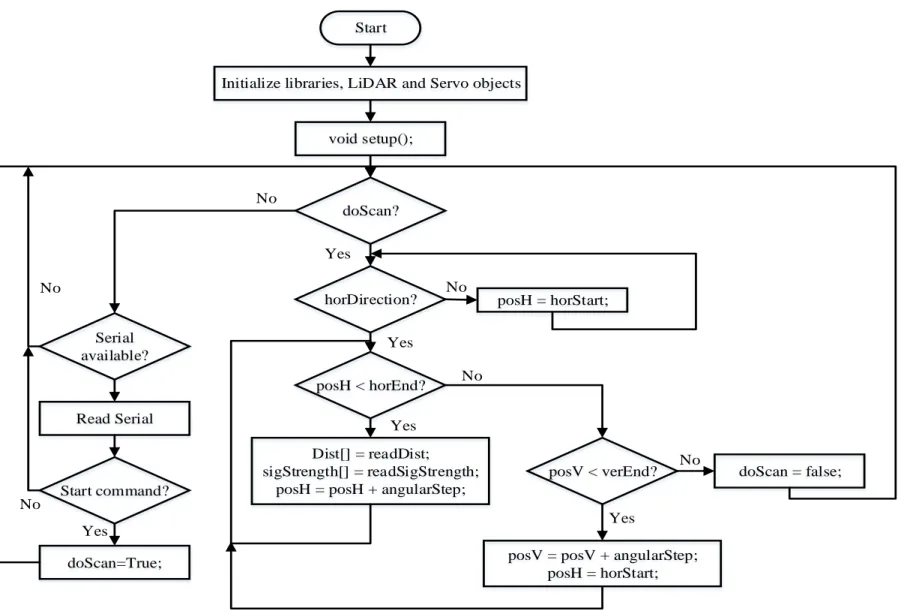
3.3 Firmware for Arduino Uno
The firmware of the LiDARPheno system provides an operating instruction for the system. As mentioned earlier in the design section, the Arduino platform controls the operation of the two servo motors as well as data acquisition from the LiDAR sensor. Hence, the program for Arduino (firmware) should be able to control the scanning operation and be the point of contact for communication between the raspberry pi and the scanning system. Figure 3-10 shows a flowchart of the program for Arduino.
Arduino software is a forever running program, i.e., a loop that keeps running forever or until rebooted. As it is visible from the Figure 3-10, at the boot-up/start of Arduino, the program initializes the required libraries. In this firmware, libraries include Servo [72], Serial [72] and LIDARLite [67] for Arduino Uno. After the library initialization, some of the macros are defined that are required for the operation of the LiDARPheno prototype. In this program, the following macros are defined:
• centerPos: the center position of the servo motors, typically 1500 µs.
• cornerPos: corner position for the system, set to 1900 µs. By setting a servo to this
value, the servo will move to about 130° making it parallel to the surface of the housing box. It is used so that the LiDAR mechanism is not in the FoV of the pi camera module while capturing the 2D image.
• angularStep: This defines the angular resolution of the scan in microseconds
• horStart: this macro defines the angle at which scan starts for the horizontal
direction
• horEnd: angle at which the horizontal scanning stops
• verStart: vertical angle at which the scanning starts
• verEnd: vertical angle at which the scanning stops
After the macros are defined, the LiDAR and Servo instances are created. At the same time, some of the variables that are required for setting the servo positions and reading distance information are defined. This results in the creation of myLidarLite, myServoVer, myServoHor,
posH, horDirection, doScan,and posV.
In the method setup() servo objects are initialized by attach() method of Servo class to connect the servo motors to PWM pin number 9 and 11 of the Arduino Uno and LiDAR object is
29
Start
Initialize libraries, LiDAR and Servo objects
void setup(); doScan? Serial available? Start command? Read Serial doScan=True; horDirection? posH < horEnd? Dist[] = readDist; sigStrength[] = readSigStrength;
posH = posH + angularStep;
posV < verEnd?
posV = posV + angularStep; posH = horStart; doScan = false; Yes posH = horStart; No Yes No Yes No Yes Yes No No No